How to Draw a Timeline - Simple Tutorial
Part 1: What is Timeline?
A timeline is used to illustrate a chain of events, or a series of activities, in chronological order. The period of time is indicated by a straight line, with the events branching from the line in chronological order. These events will often be dated and captioned with supplementary information.
Timelines are often used by historians to study a period of history by understanding how, and when, a series of events took place. They can also be used in business to study past sequences of events, and identify areas in the chain that can be improved.
Part 2: How to Make a Timeline Effortlessly?
Step 1: Start EdrawMax.
Step 2: Navigate to [New]>[Business]>[Timelines]
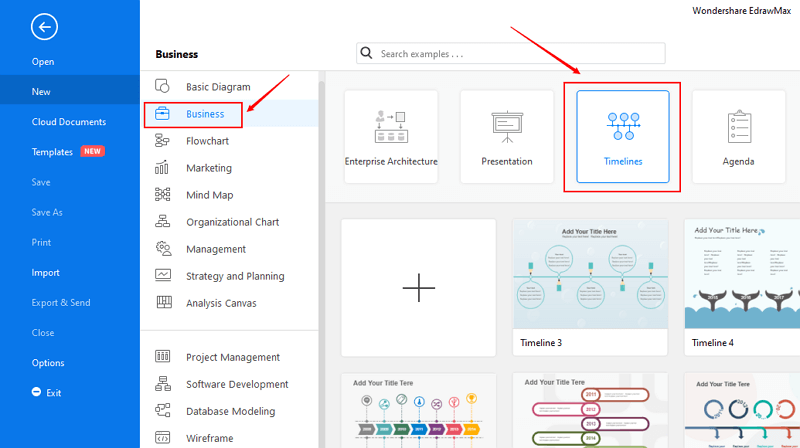
Step 3: Select one timeline template to edit on it or click the [+] sign to start from scratch.
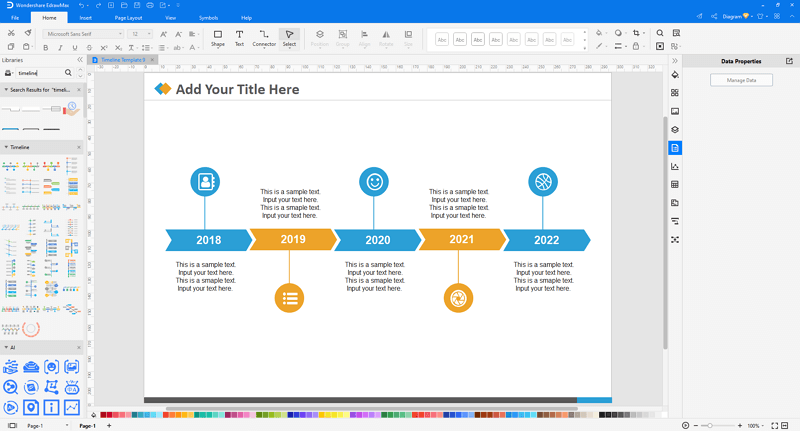
Note: Here are some tips for you about how to make a timeline with EdrawMax.

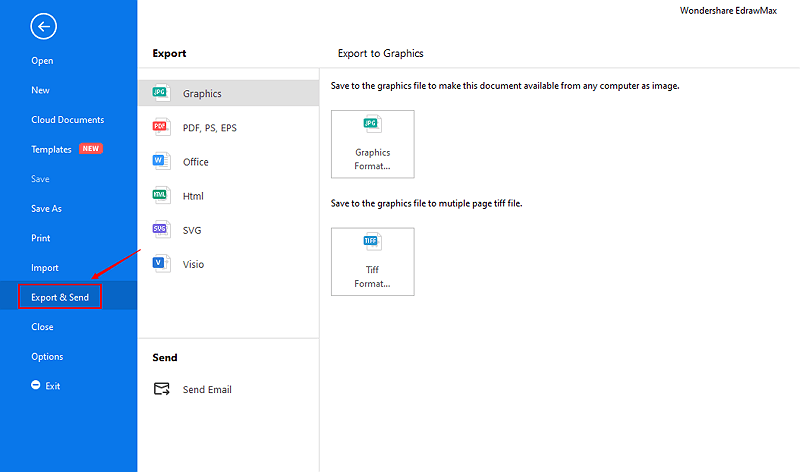
Step 4: You can export the file to Graphics, PDF, editable MS Office file, SVG and Visio vsdx file.
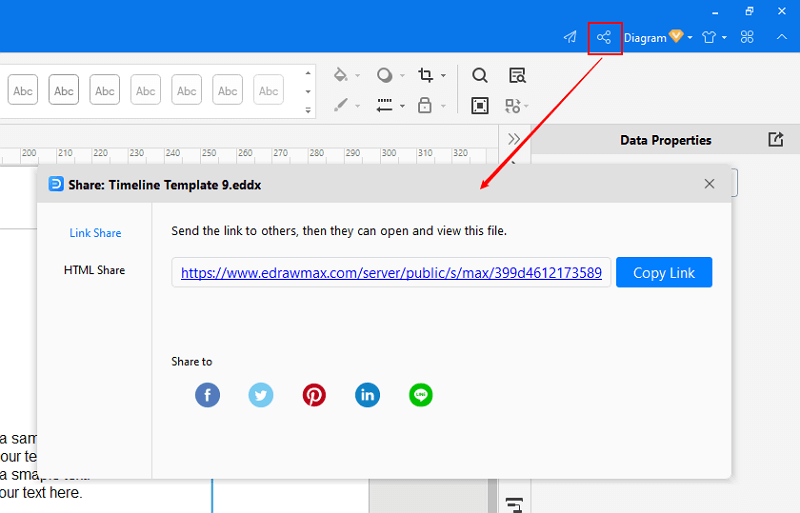
Step 5: And you can share your diagram with others via social media and online website page.
If you want to have a more comprehensive study, please visit: Video Tutorial - How to Create a Timeline
Part 3: Timeline Examples
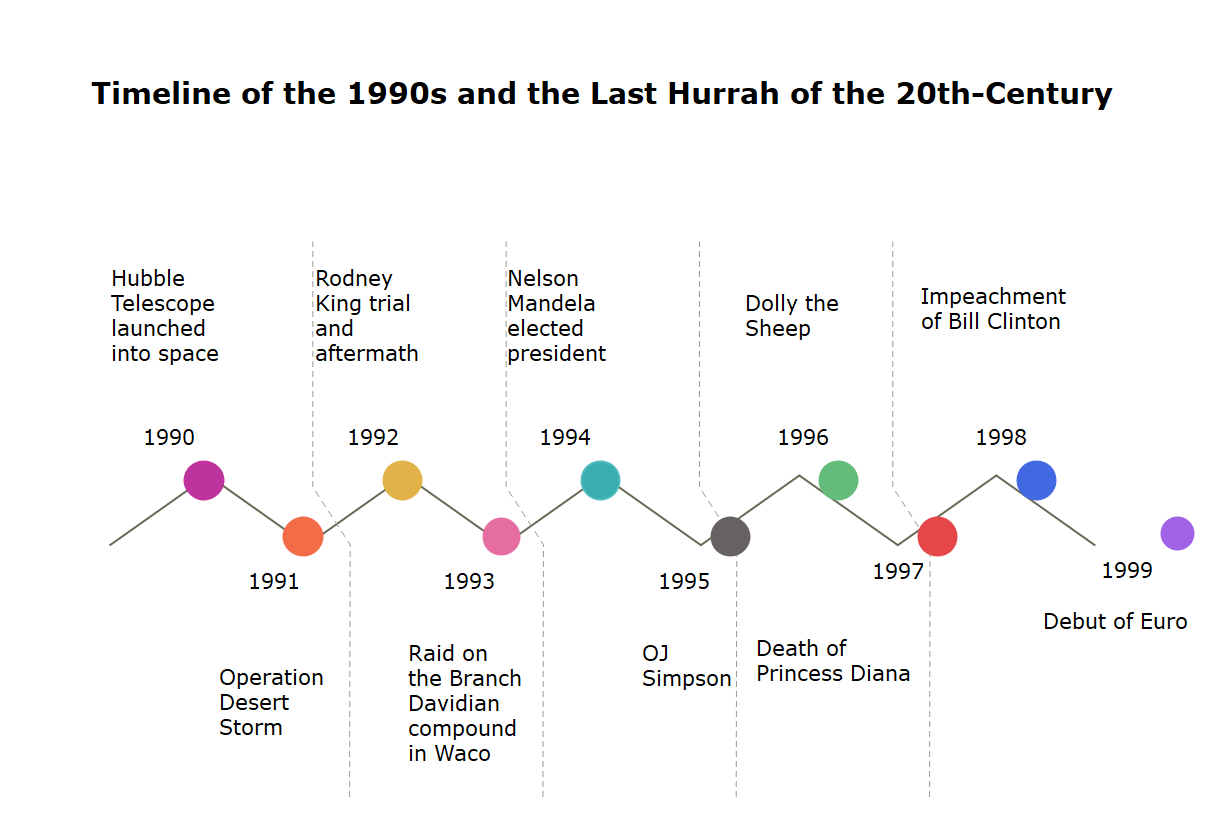
Timeline Example 1
A timeline diagram shows key-events that happened in chronological order from one date to another. In this example, we have talked about the events from the 1990s, going all the way to the start of early 2000. In this timeline diagram, a user can see how the Hubble Telescope was first launched into space to learn what led to the tragic death of Princess Diana to the impeachment of Bill Clinton.
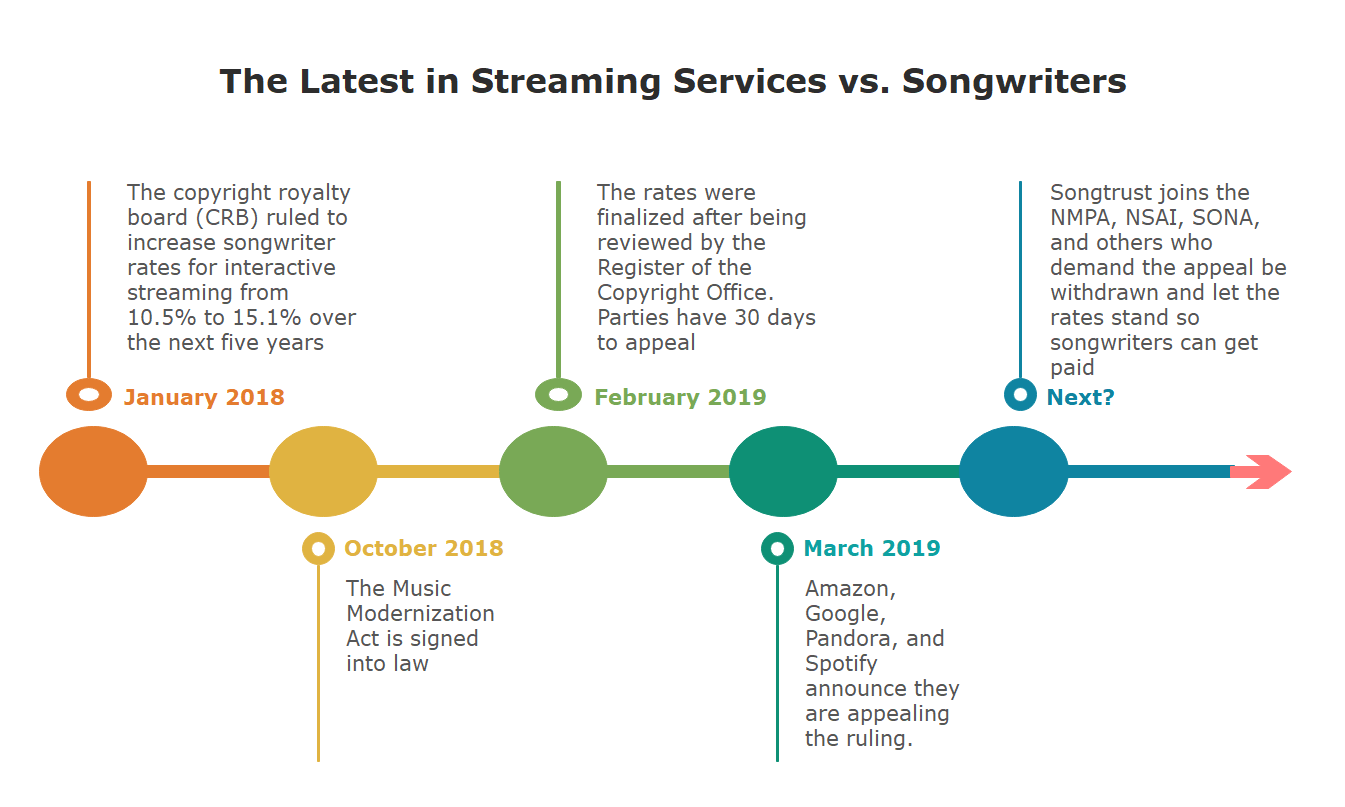
Timeline Example 2
A timeline diagram shows the critical events in chronological order. In this example, after the CRB’s initial ruling for a 44 percent increase in mechanical royalty rates, the music industry’s world changed completely. A user or a music enthusiast can learn more about the current musical world by examining the below diagram.
Part 4: Conclusion
According to this article, there are mainly three parts to illustrate what is timeline, to tell you how to create a timeline easily, and to show you some timeline examples.
EdrawMax is an easiest all-in-one diagramming tool, you can create timelines and any other type diagrams with ease! With ready-made timeline symbols and cliparts, making timelines could be as simple as possible. Also, it supports to export your work in multiple formats and share your work with others. Get started to create your timelines now!

An all-in-one platform for 210+ diagrams.
・ Simple alternative to Visio
・ 26k+ symbols
・ 10K+ free templates
・ 10+ AI diagram generators


