How to Use A Matrix Diagram

Part 1: What is Matrix Diagram?
Matrix diagrams are commonly used by project managers handling projects with a multitude of processes and people that require managing. It helps with understanding the relationships between each element or data set.
Matrix diagrams can compare two or more pieces of data, or data within a single group. They can be used to compare data, people, equipment, and materials, amongst other thing.
A matrix diagram is best used for identifying the causes of problems, comparing the solutions to them, and identifying areas for improvement in a project or process.
Part 2: How to Draw a Matrix Diagram Effortlessly?
How to create a matrix diagram easily? Using EdrawMax to create your own matrix diagram.
Step 1: Open EdrawMax desktop software or EdrawMax web-based application.
Step 2: Navigate to [New]>[Marketing]>[Matrix Diagram]
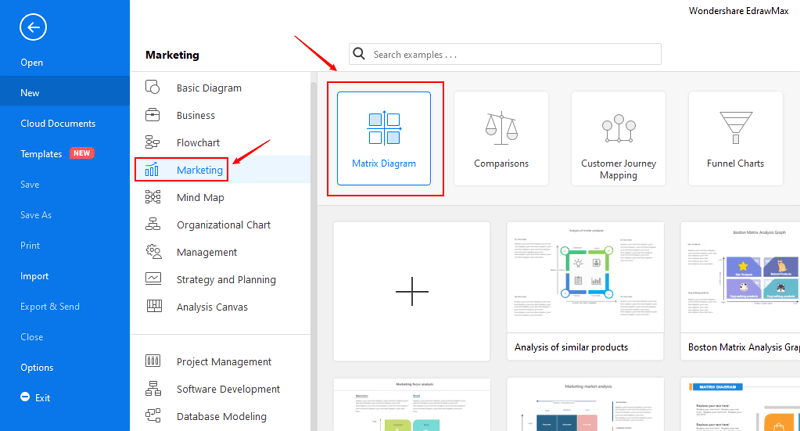
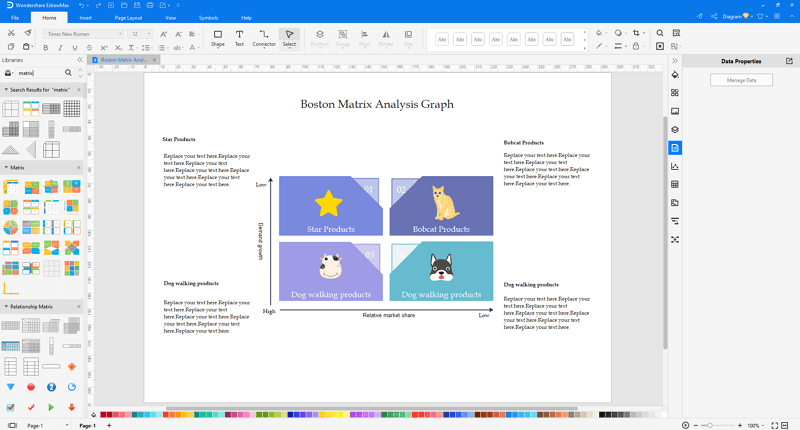
Step 3: Select one matrix diagram template to edit on it or click the [+] sign to start from scratch. Also, you can use massive matrix diagram symbols and elements from libraries in left menu to customize your matrix diagram.
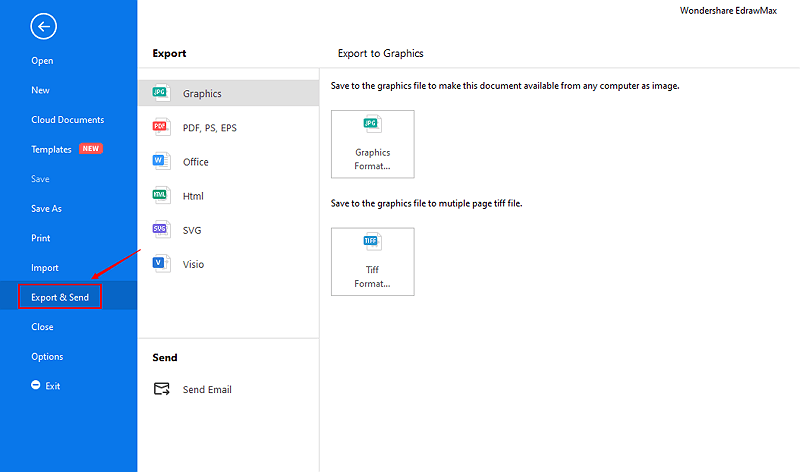
Step 4: Once finished your creation, you can export the file in multiple formats, including Graphics, PDF, editable MS Office file, SVG and Visio vsdx file.
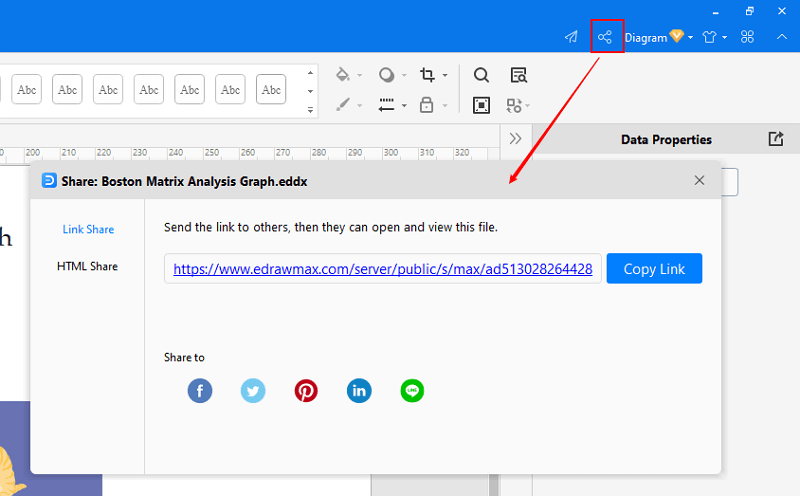
Step 5: Besides, you can share your matrix diagram with others via social media and web page. Or publish your matrix diagram in EdrawMax template gallery to show your work with others.
Part 3: Matrix Diagram Examples
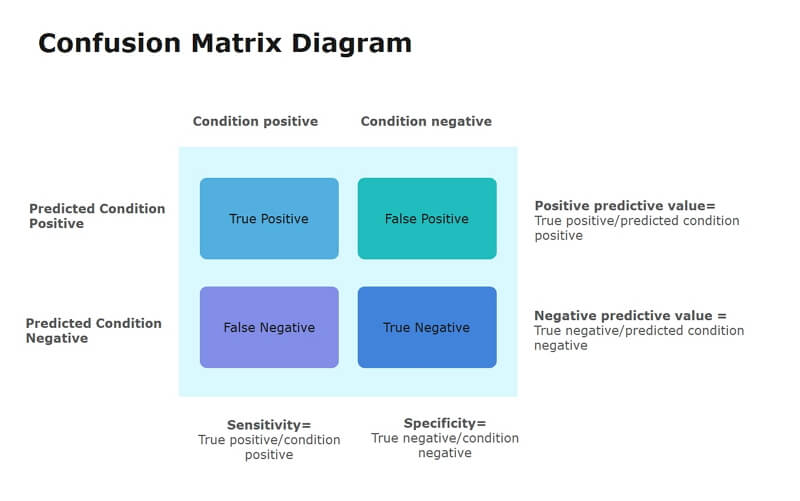
Example1: Confusion Matrix
Confusion matrices, a key tool to evaluate machine learning algorithm performance in classification, are a statistical tool.Contingency tables, a type of confusion matrix, are used in the evaluation of many diagnostic exams for sensitivity, specificity, positive and negative predictive values.
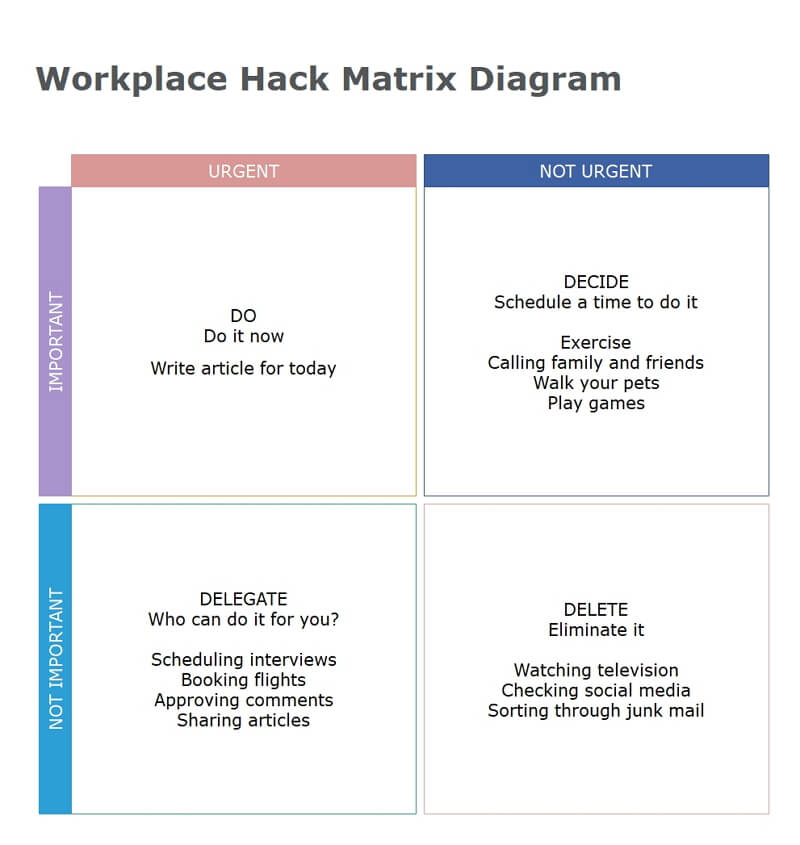
Example2: Workplace Hack Matrix
Use the priority Matrix to make productive decisions in the priority matrix, which balances importance of tasks with urgency. Enter your tasks into the boxes based on urgency and importance.

An all-in-one platform for 210+ diagrams.
・ Simple alternative to Visio
・ 26k+ symbols
・ 10K+ free templates
・ 10+ AI diagram generators


Part 4: Conclusion
According to this article, there are mainly four parts to illustrate what is matrix diagram, to tell you how to draw a matrix diagram, to show you some matrix diagram examples, and to tell you how to use a matrix diagram. Generally speaking, the matrix diagram is very useful because it can help project managers understand the relationships between each element or data set.
EdrawMax is an easiest all-in-one diagramming tool, you can create matrix diagram and any other type diagrams with ease! With substantial matrix diagram symbols and cliparts, making matrix diagram could be as simple as possible. Also, it supports to export your work in multiple formats and share your work with others. Get started to create your matrix diagram now!

