Gantt charts are a popular tool to visualize project schedules. They provide a clear overview of tasks, start and end dates, and dependencies, making them an essential tool for project management. However, manually creating these charts can be a challenging task. That's where Google Sheets comes in, as it is a versatile online spreadsheet tool that can help make this process easier.
In this article, we'll guide you on making a Gantt chart in Google Sheets to help you manage your projects more effectively. If you're handling larger projects, you can use dedicated tools like EdrawProj. Explore both options to determine the best tool for your project's requirements.
How To Create a Gantt Chart in Google Sheets?
With Google Sheets, you can input tasks' start and end dates, and the Gantt chart will automatically update to reflect any changes. A dynamic Gantt chart in Google Sheets makes it convenient for project managers to visualize the progress of their project schedule in real time. Follow the step-by-step guide below to create Gantt charts online in Google Sheets.
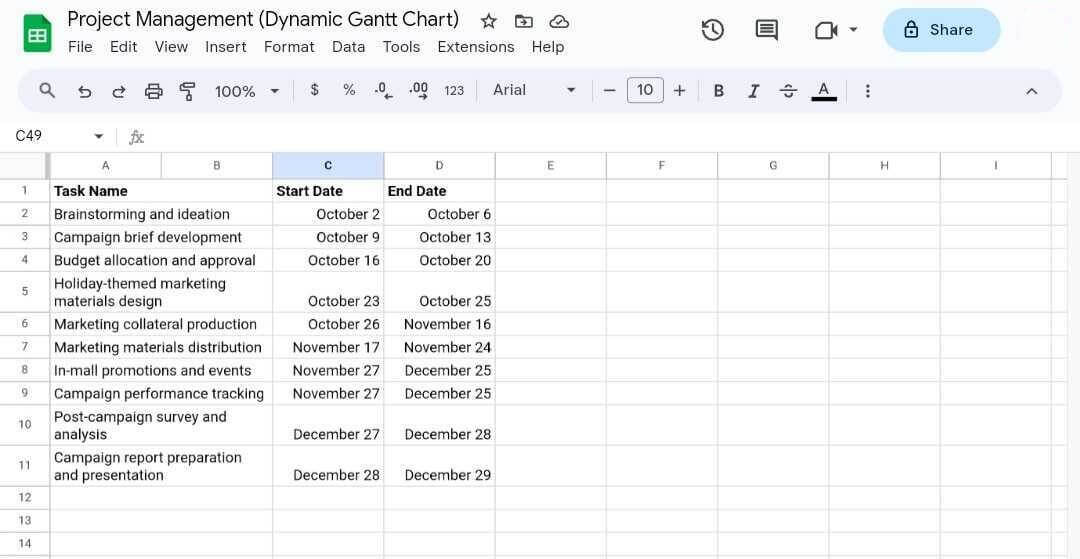
Step 1: Look for a dynamic Gantt chart Google Sheets template online. Alternatively, create a table in Google Sheets with the following columns: Task or Project Name, Start Date, and End Date. Enter the relevant information for each task in your project.
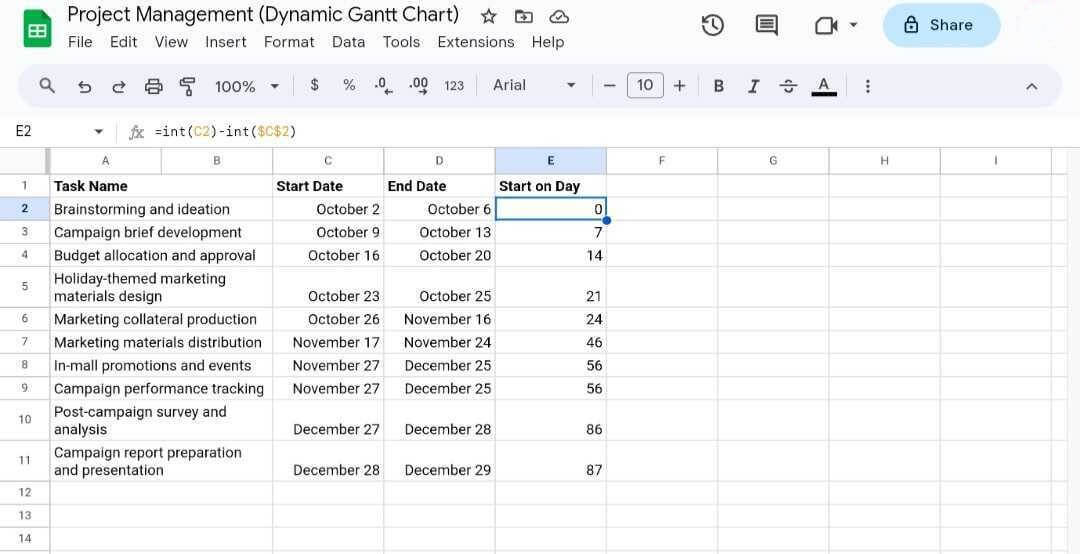
Step 2: Add a new column named Start on Day. Under this column, enter the formula =int(C2)-int($C$2) for day 0. Repeat for the other tasks.
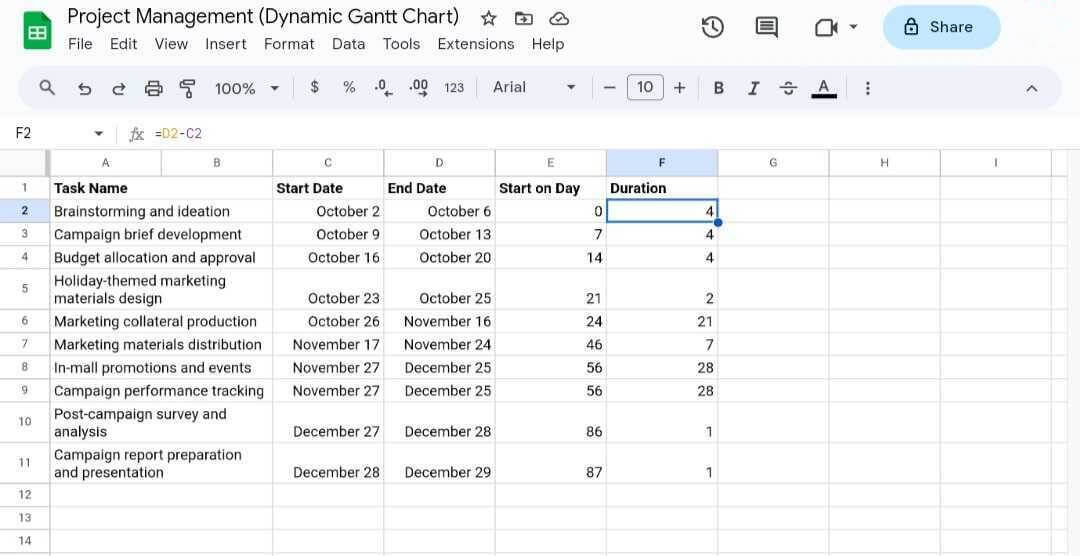
Step 3: Add another column named Duration. Use the formula =End Date - Start Date to calculate the duration of each task. For example, enter =D2-C2 in the Duration column for the first task.
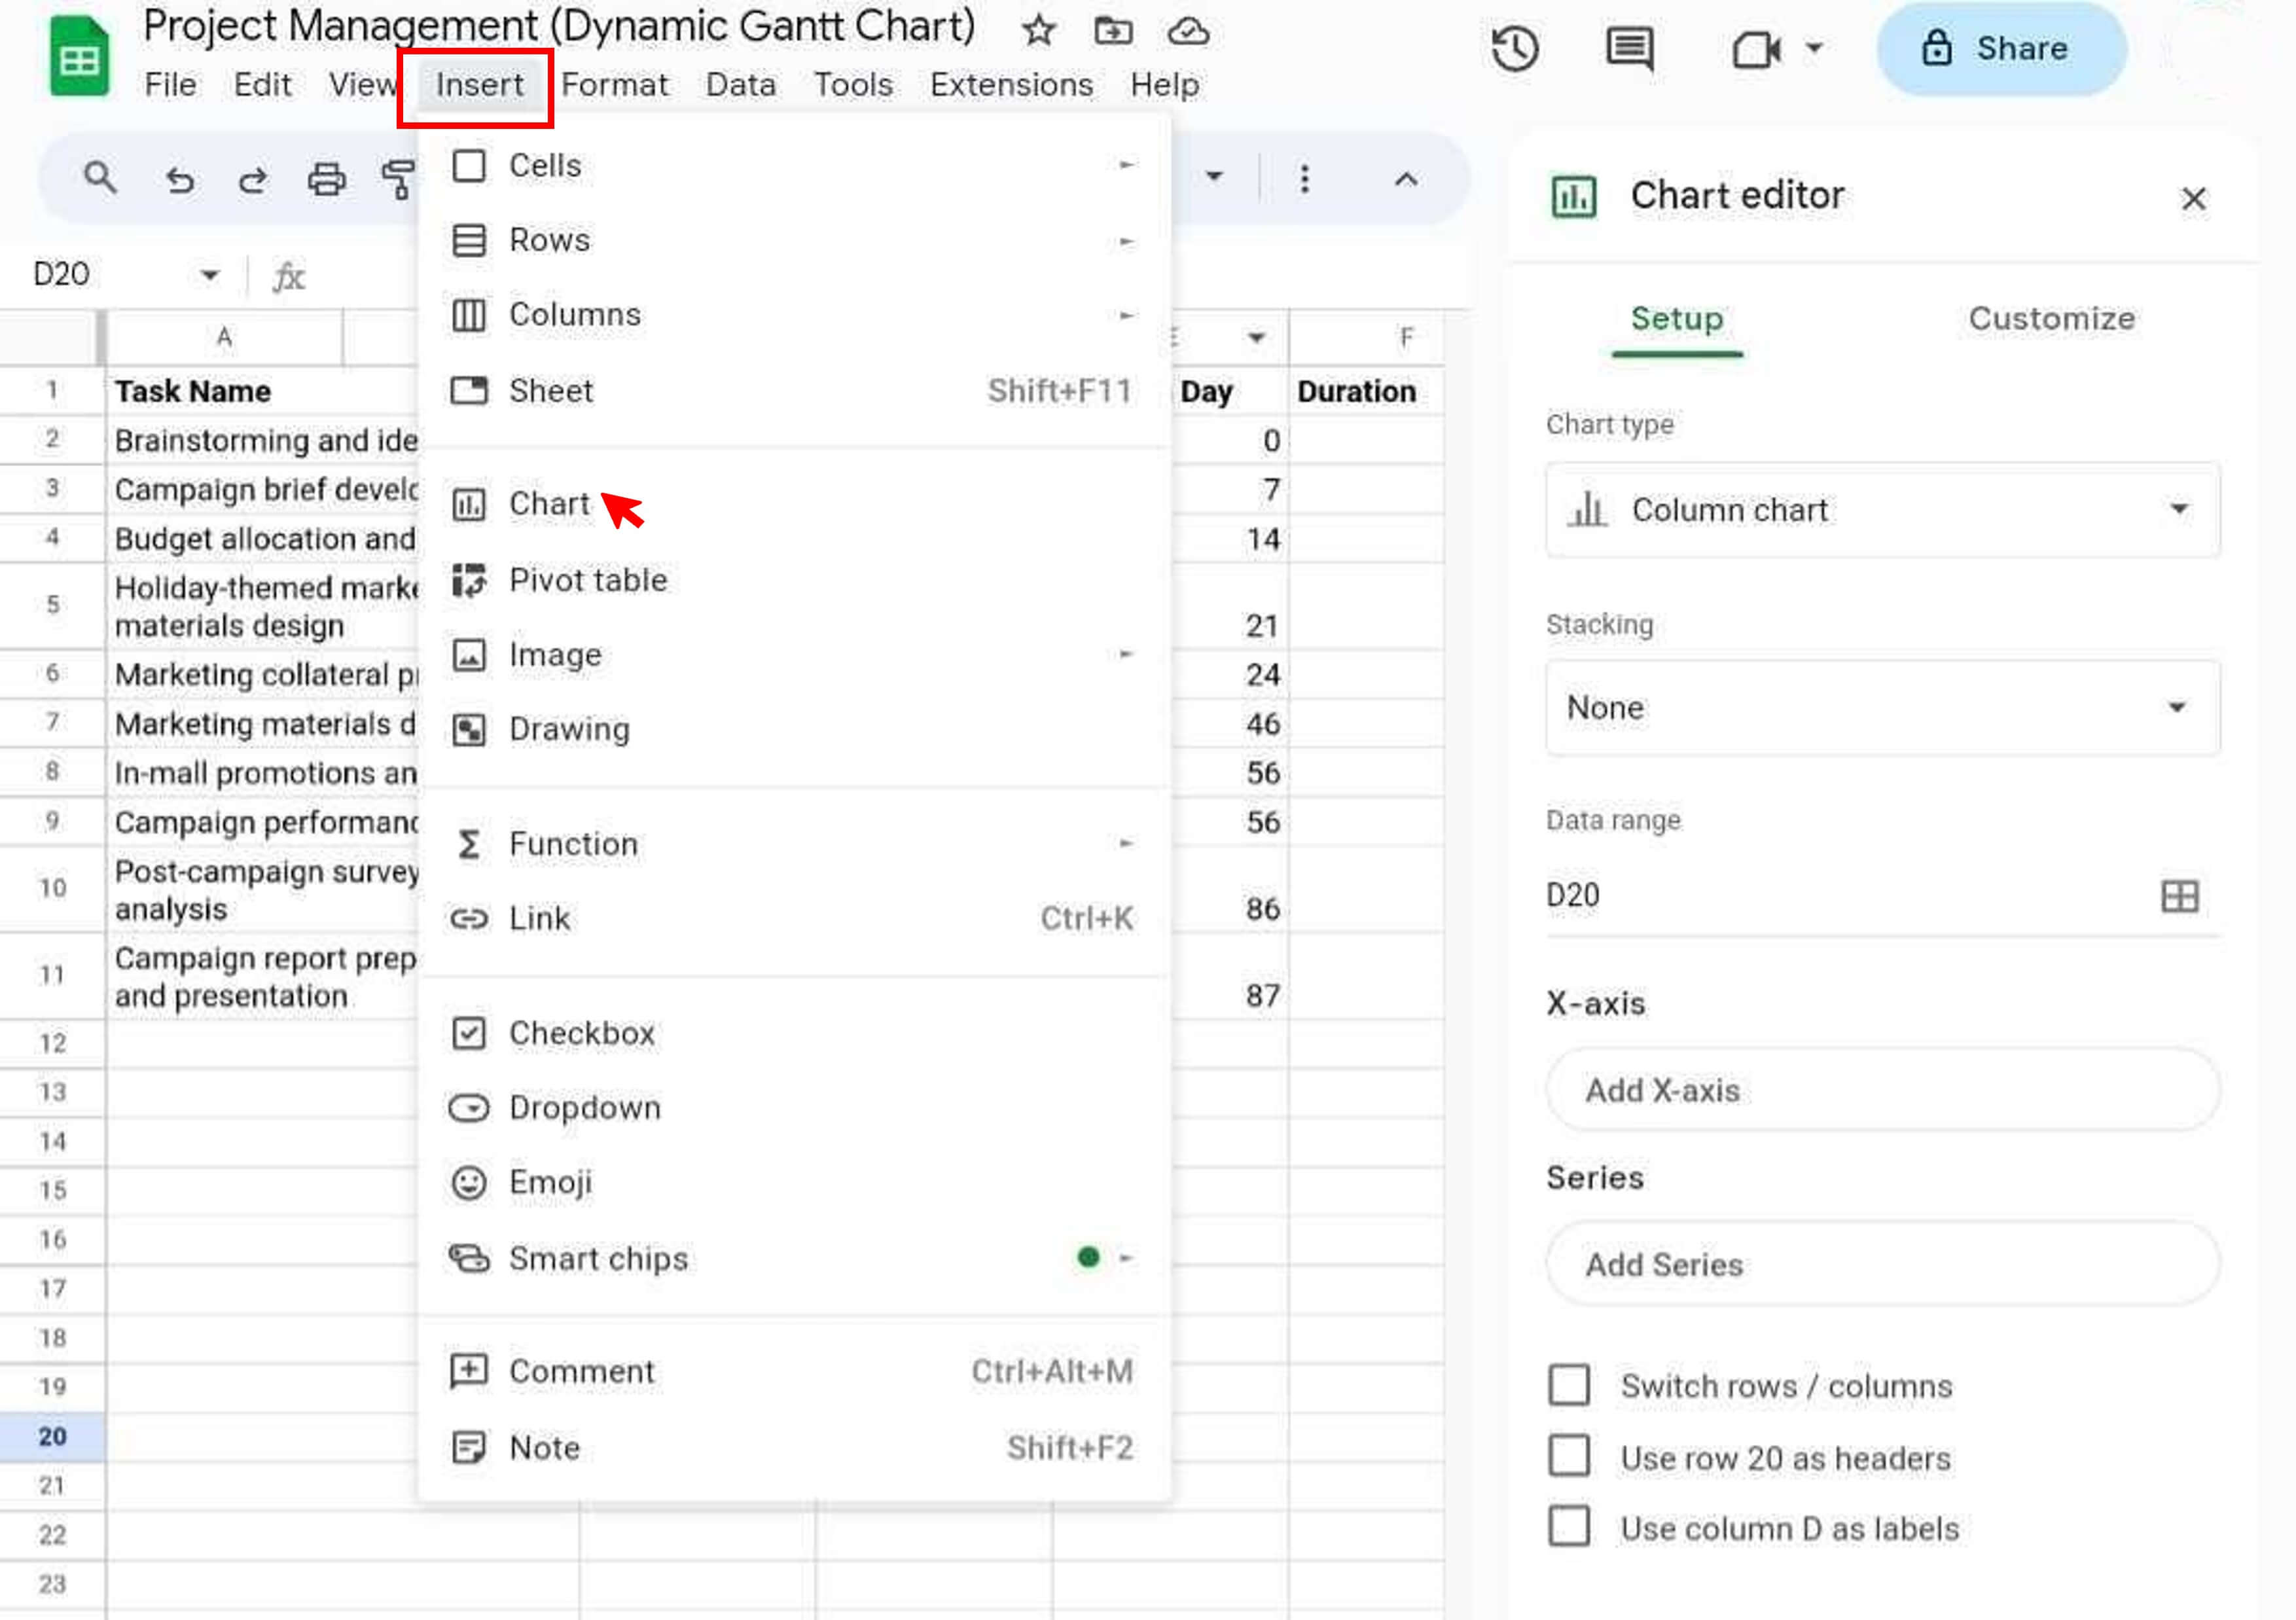
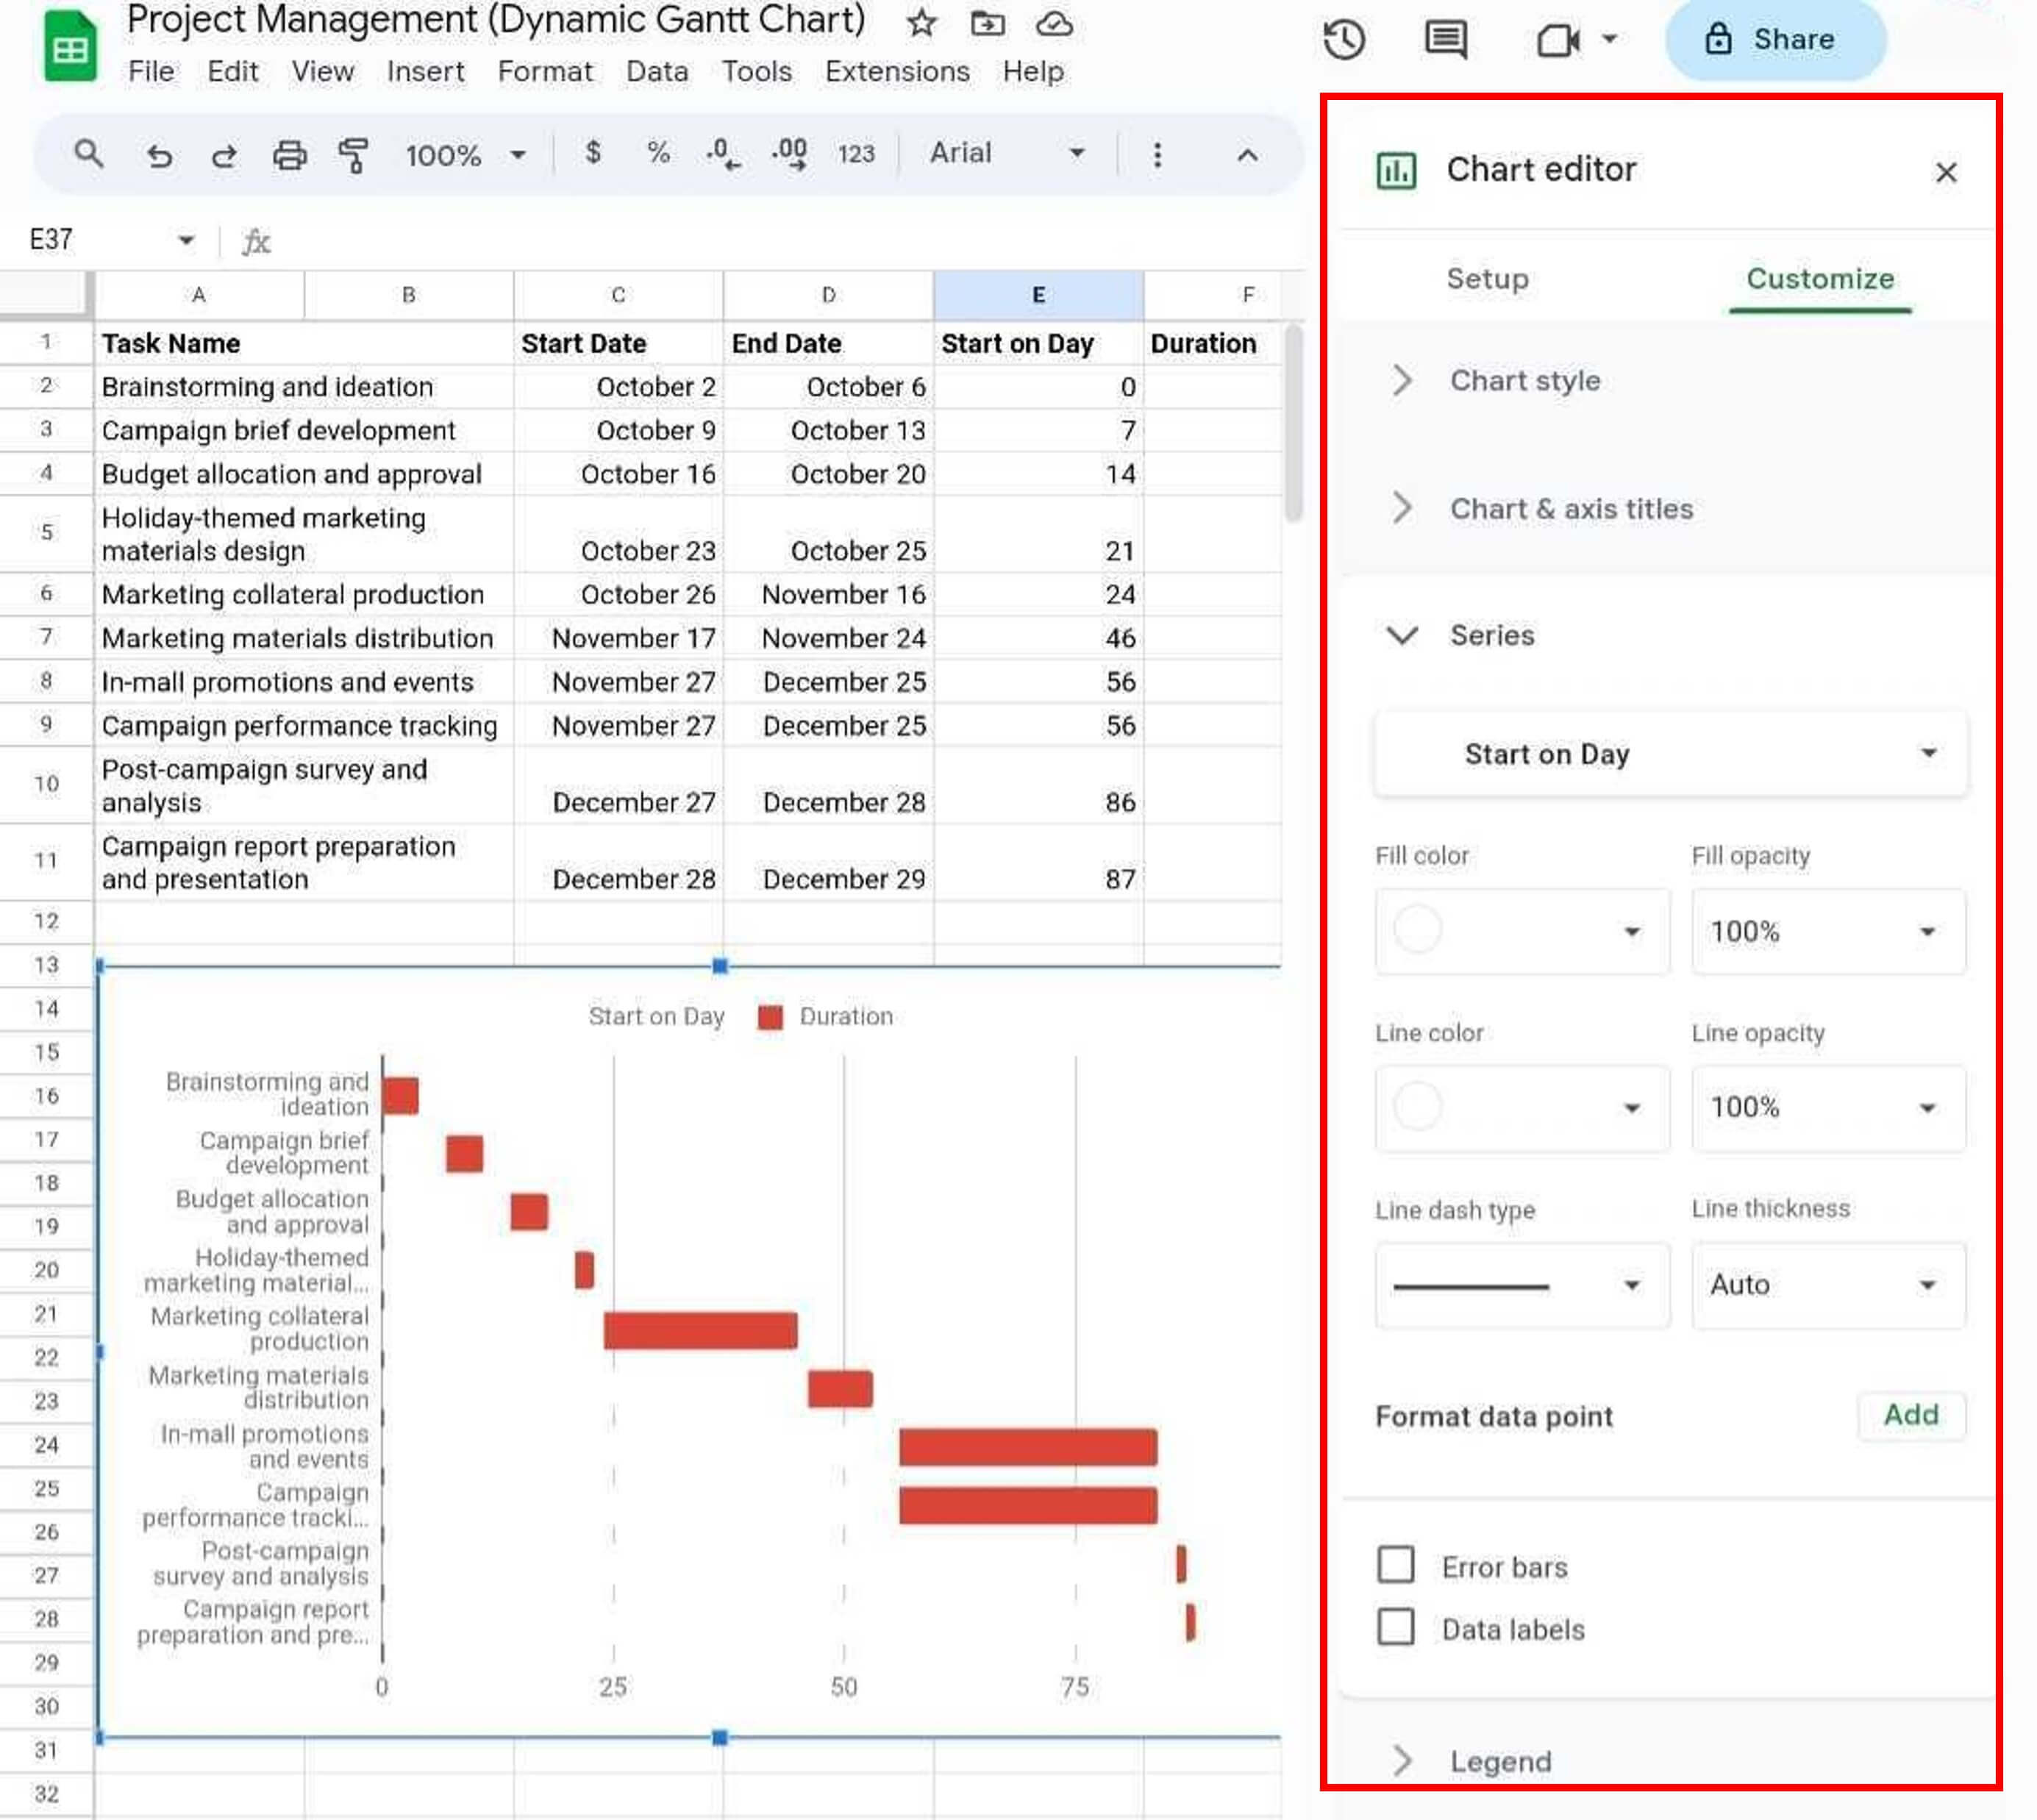
Step 4: Select the content of columns Task Name, Start on Day, and Duration. Then, go to the Insert from the tab in the upper navigation pane and choose Chart. It will open the Chart editor right panel.
Step 5: From the Setup tab, select the Stacked bar chart option in the Chart type drop-down menu. Then, select Horizontally in the Combine ranges drop-down list.
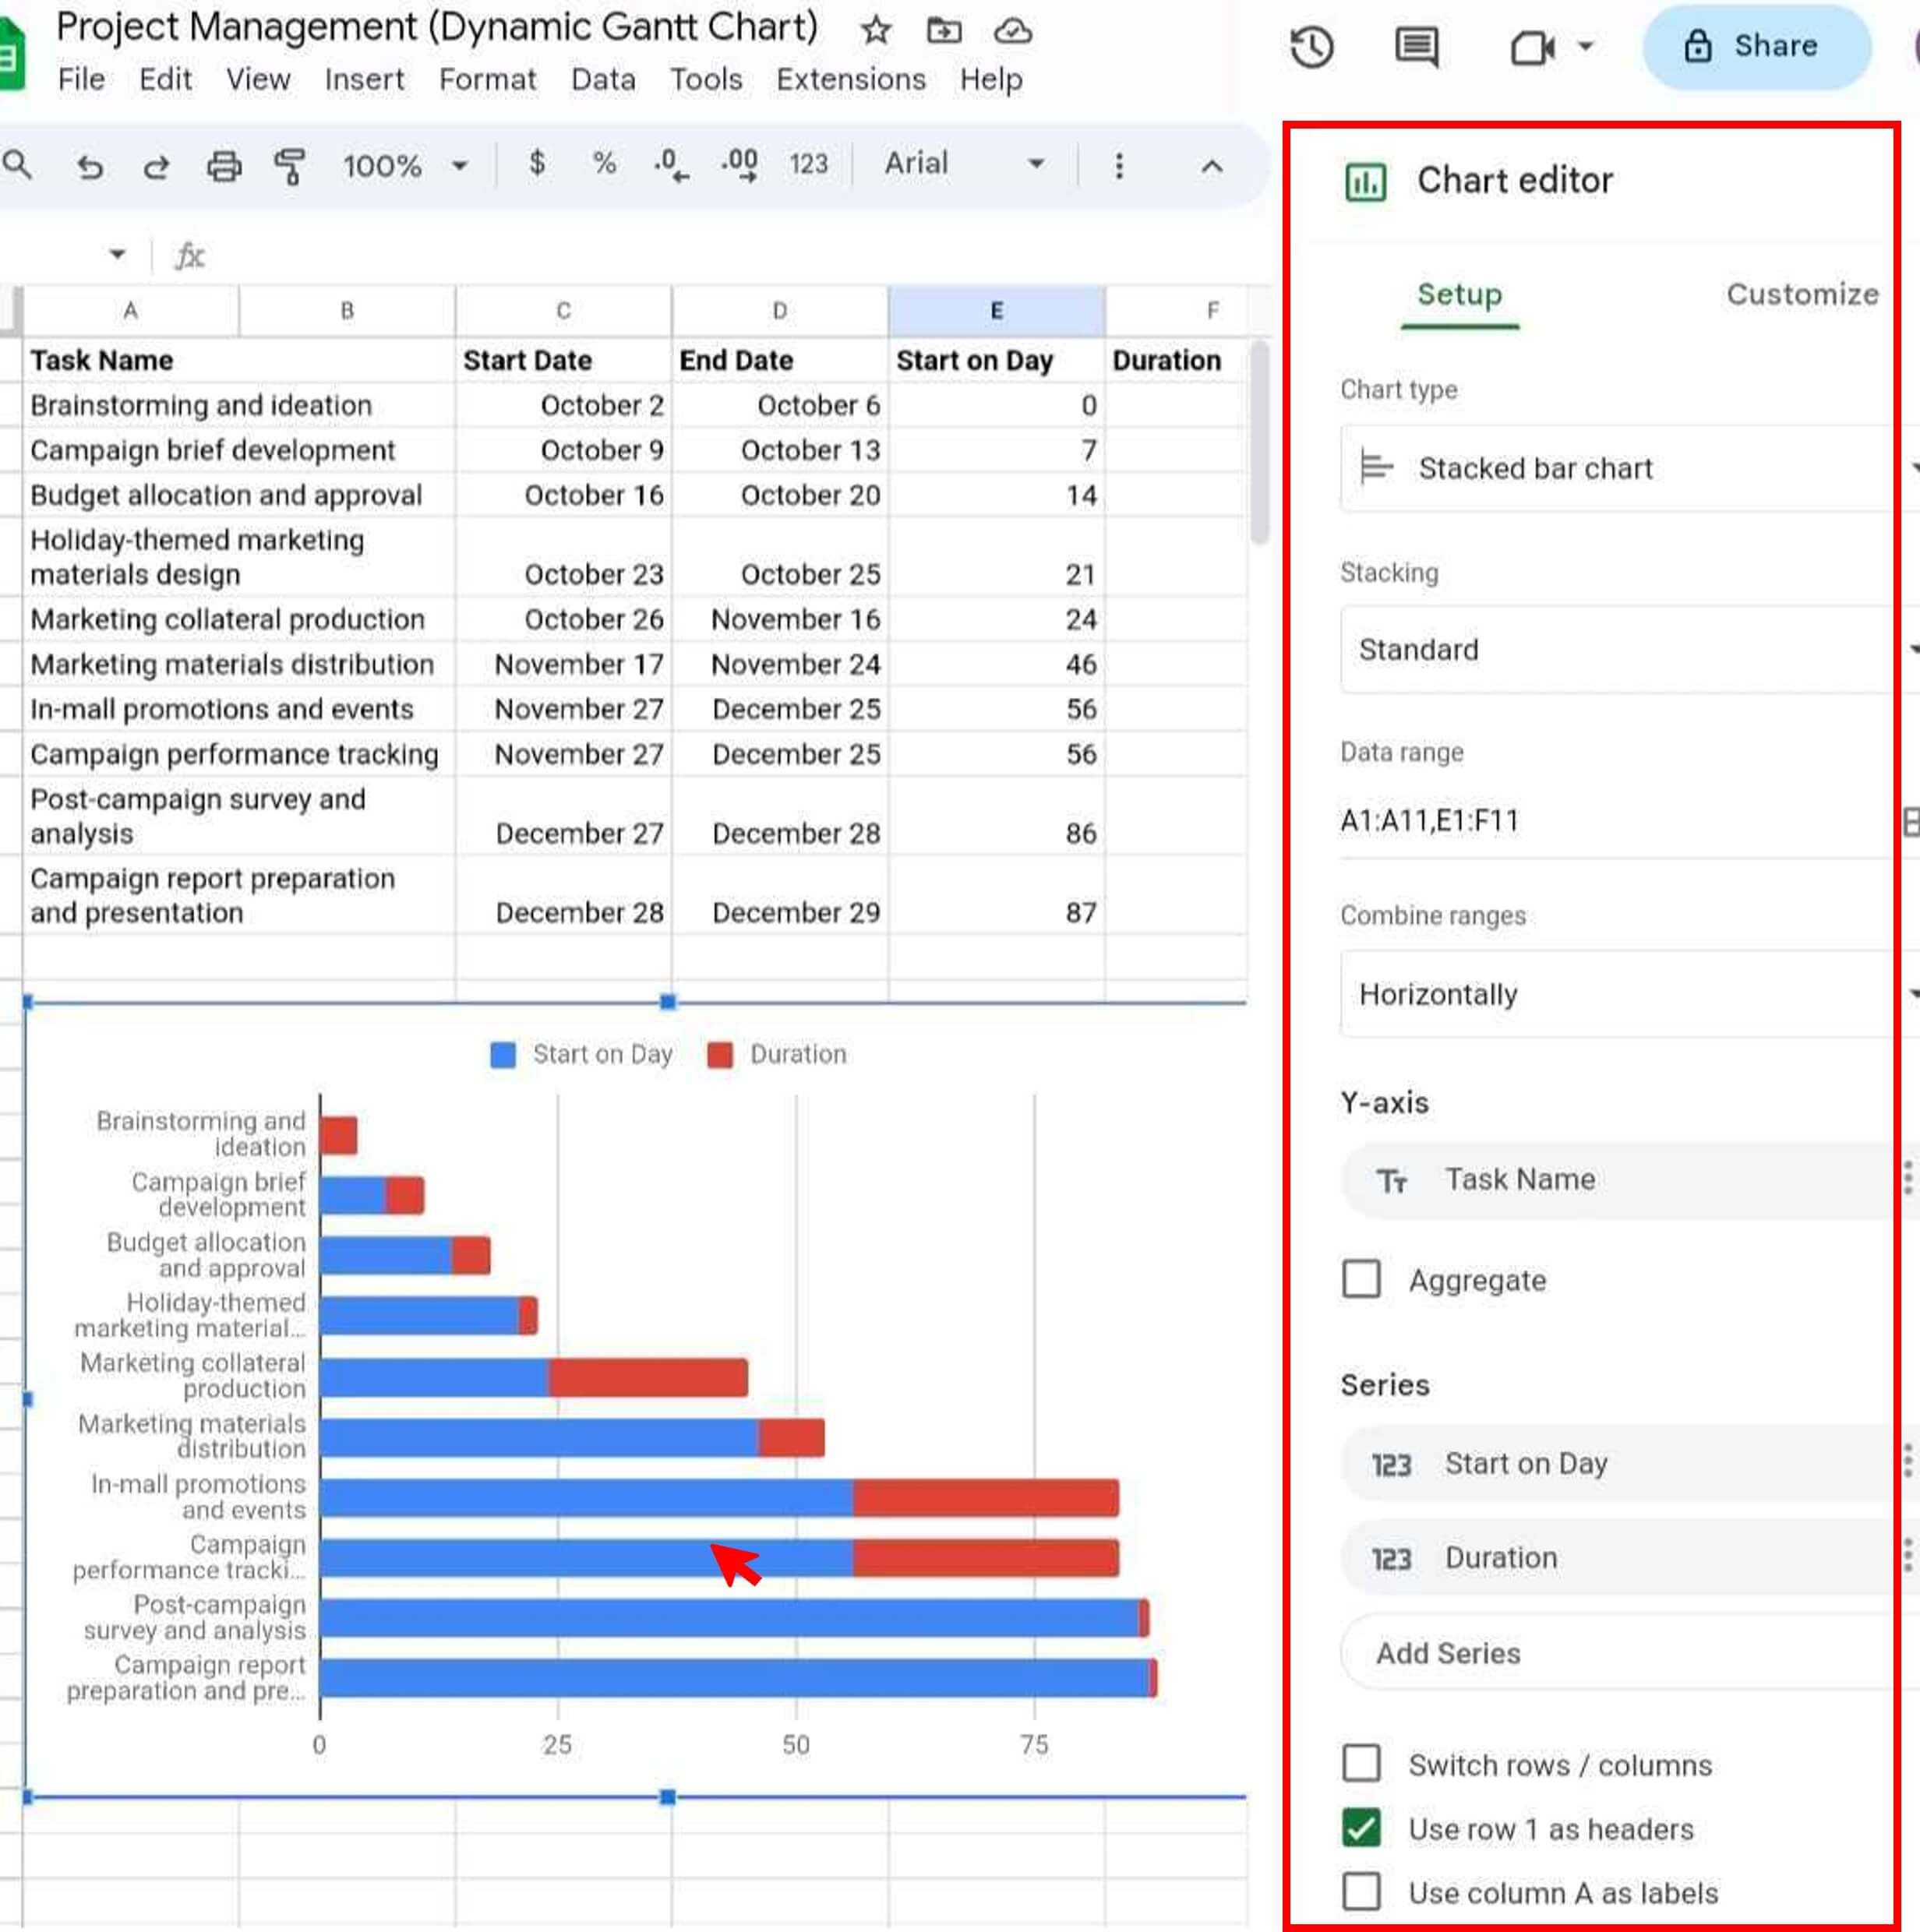
Step 6: In the Y-axis section, choose the Task Name column. Then, add the series Start on Day and Duration in the Series section.
Step 7: Select the Use row 1 as headers checkbox.
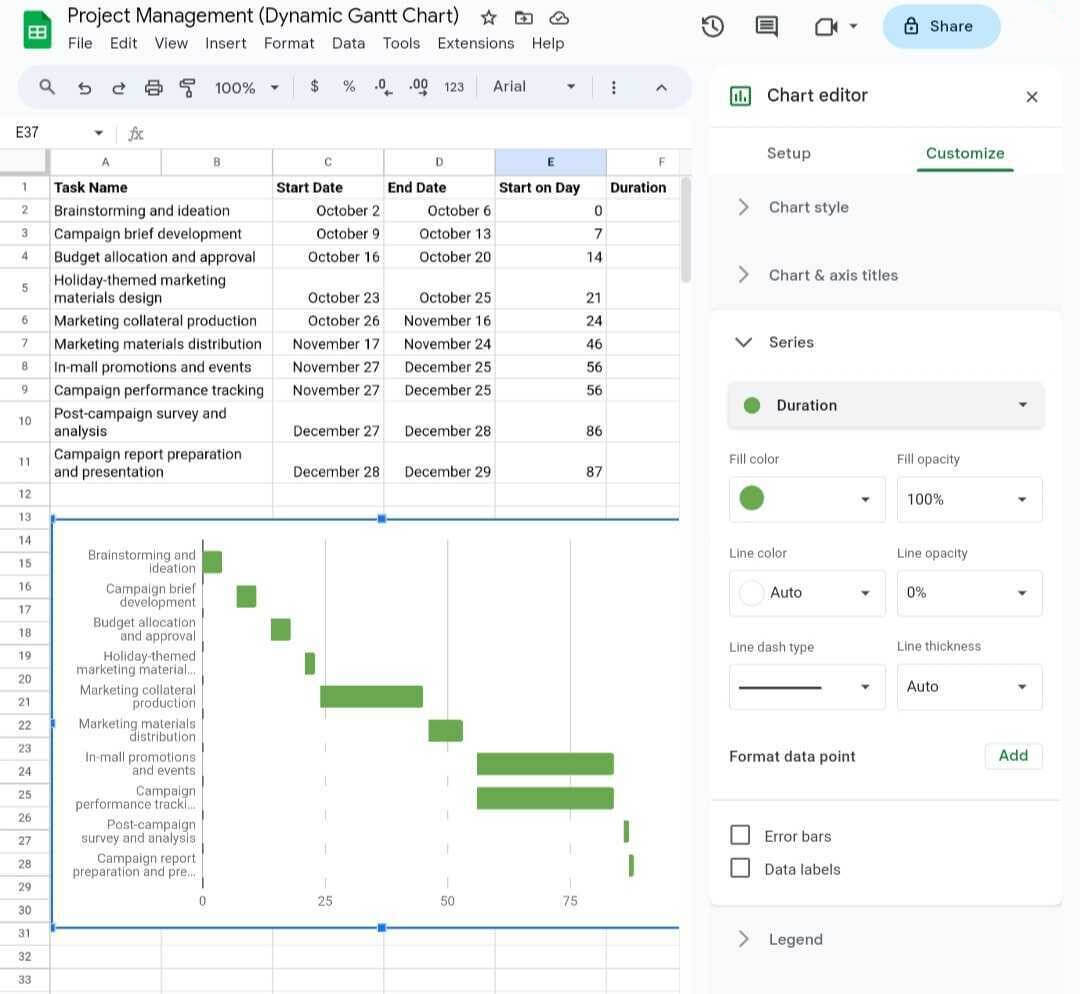
Step 8: Go to the Customize tab in the right panel. Under the Series section, choose Start on Day from the drop-down list. Next, set the Fill Color to white to hide the blue horizontal bars.
Step 9: Format the chart axes, legends, and colors to enhance readability and visual appeal.
While Google Sheets is a good option for creating basic Gantt charts, there are limitations to its functionality. For example, you cannot directly add milestones, show dependencies, or allocate resources to the Gantt charts without using a formula. In such cases, consider using dedicated Gantt chart software like EdrawProj.
How To Create a Gantt Chart in EdrawProj?
Project managers, team leaders, and project members alike often grapple with the challenge of managing large projects involving multiple tasks, dependencies, and personnel. EdrawProj tackles these challenges head-on, offering a comprehensive solution for planning, tracking, and generating reports on projects of diverse sizes and complexities. Follow these steps to create a Gantt chart in EdrawProj:
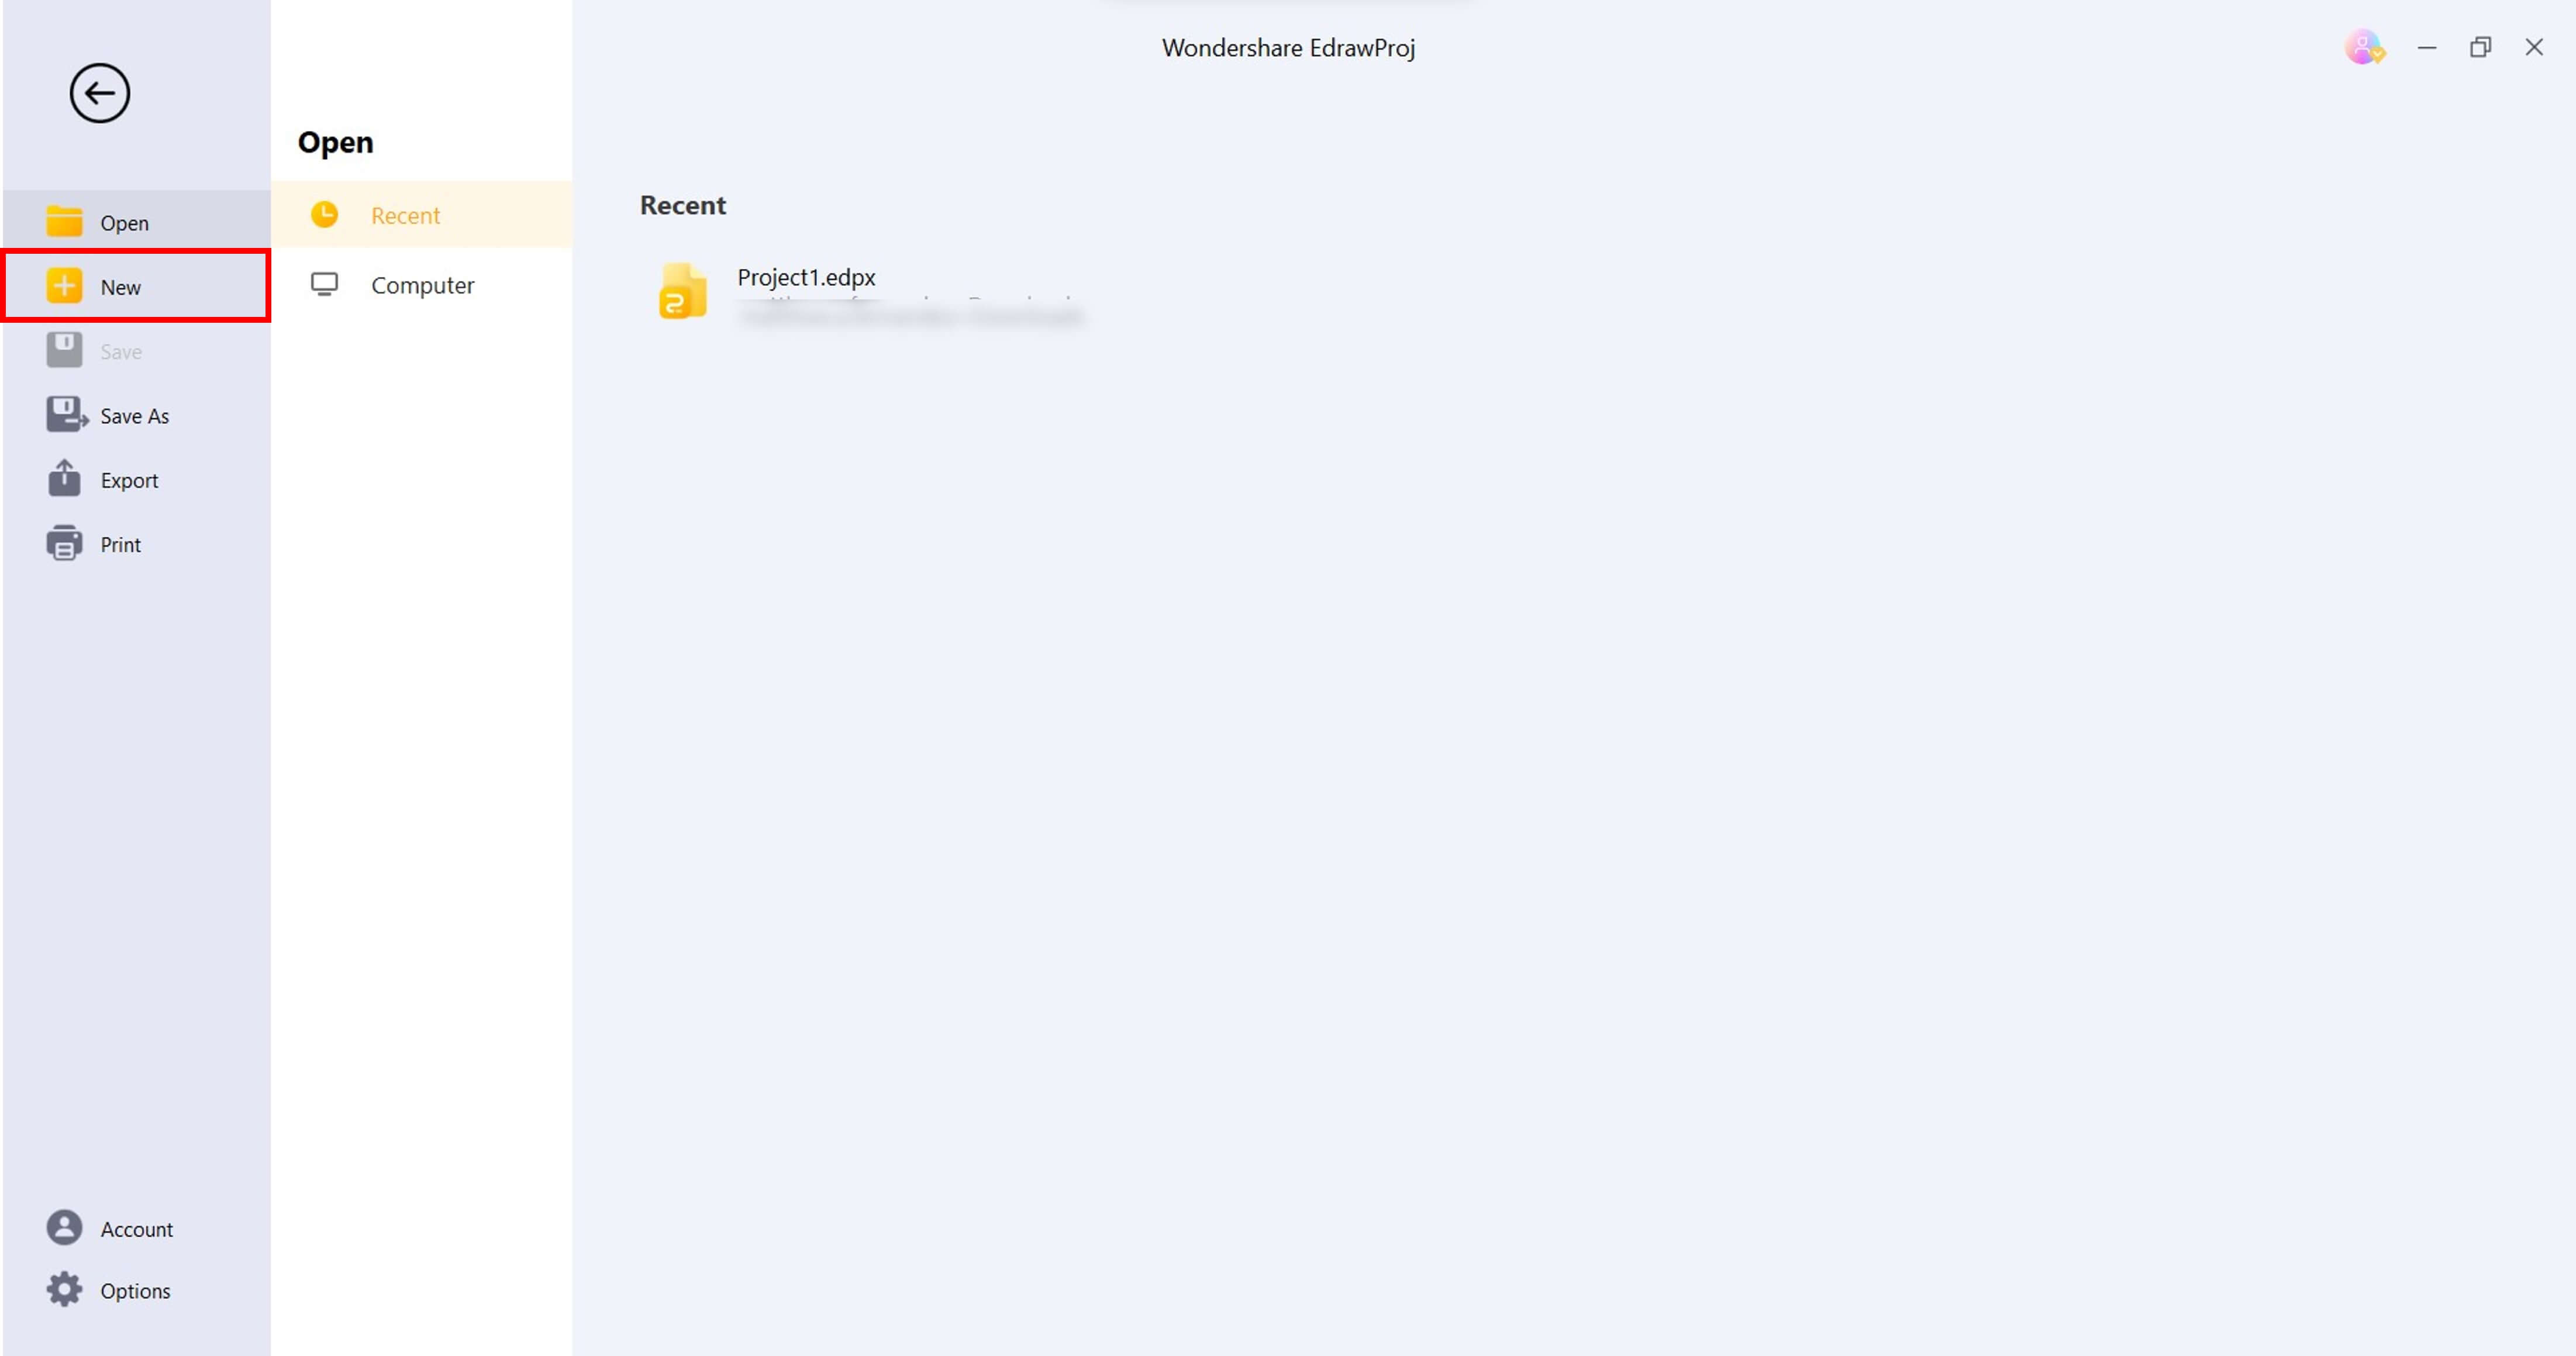
Step 1: To begin using EdrawProj, download and install the software, launch it, and click New in the left-hand navigation pane.
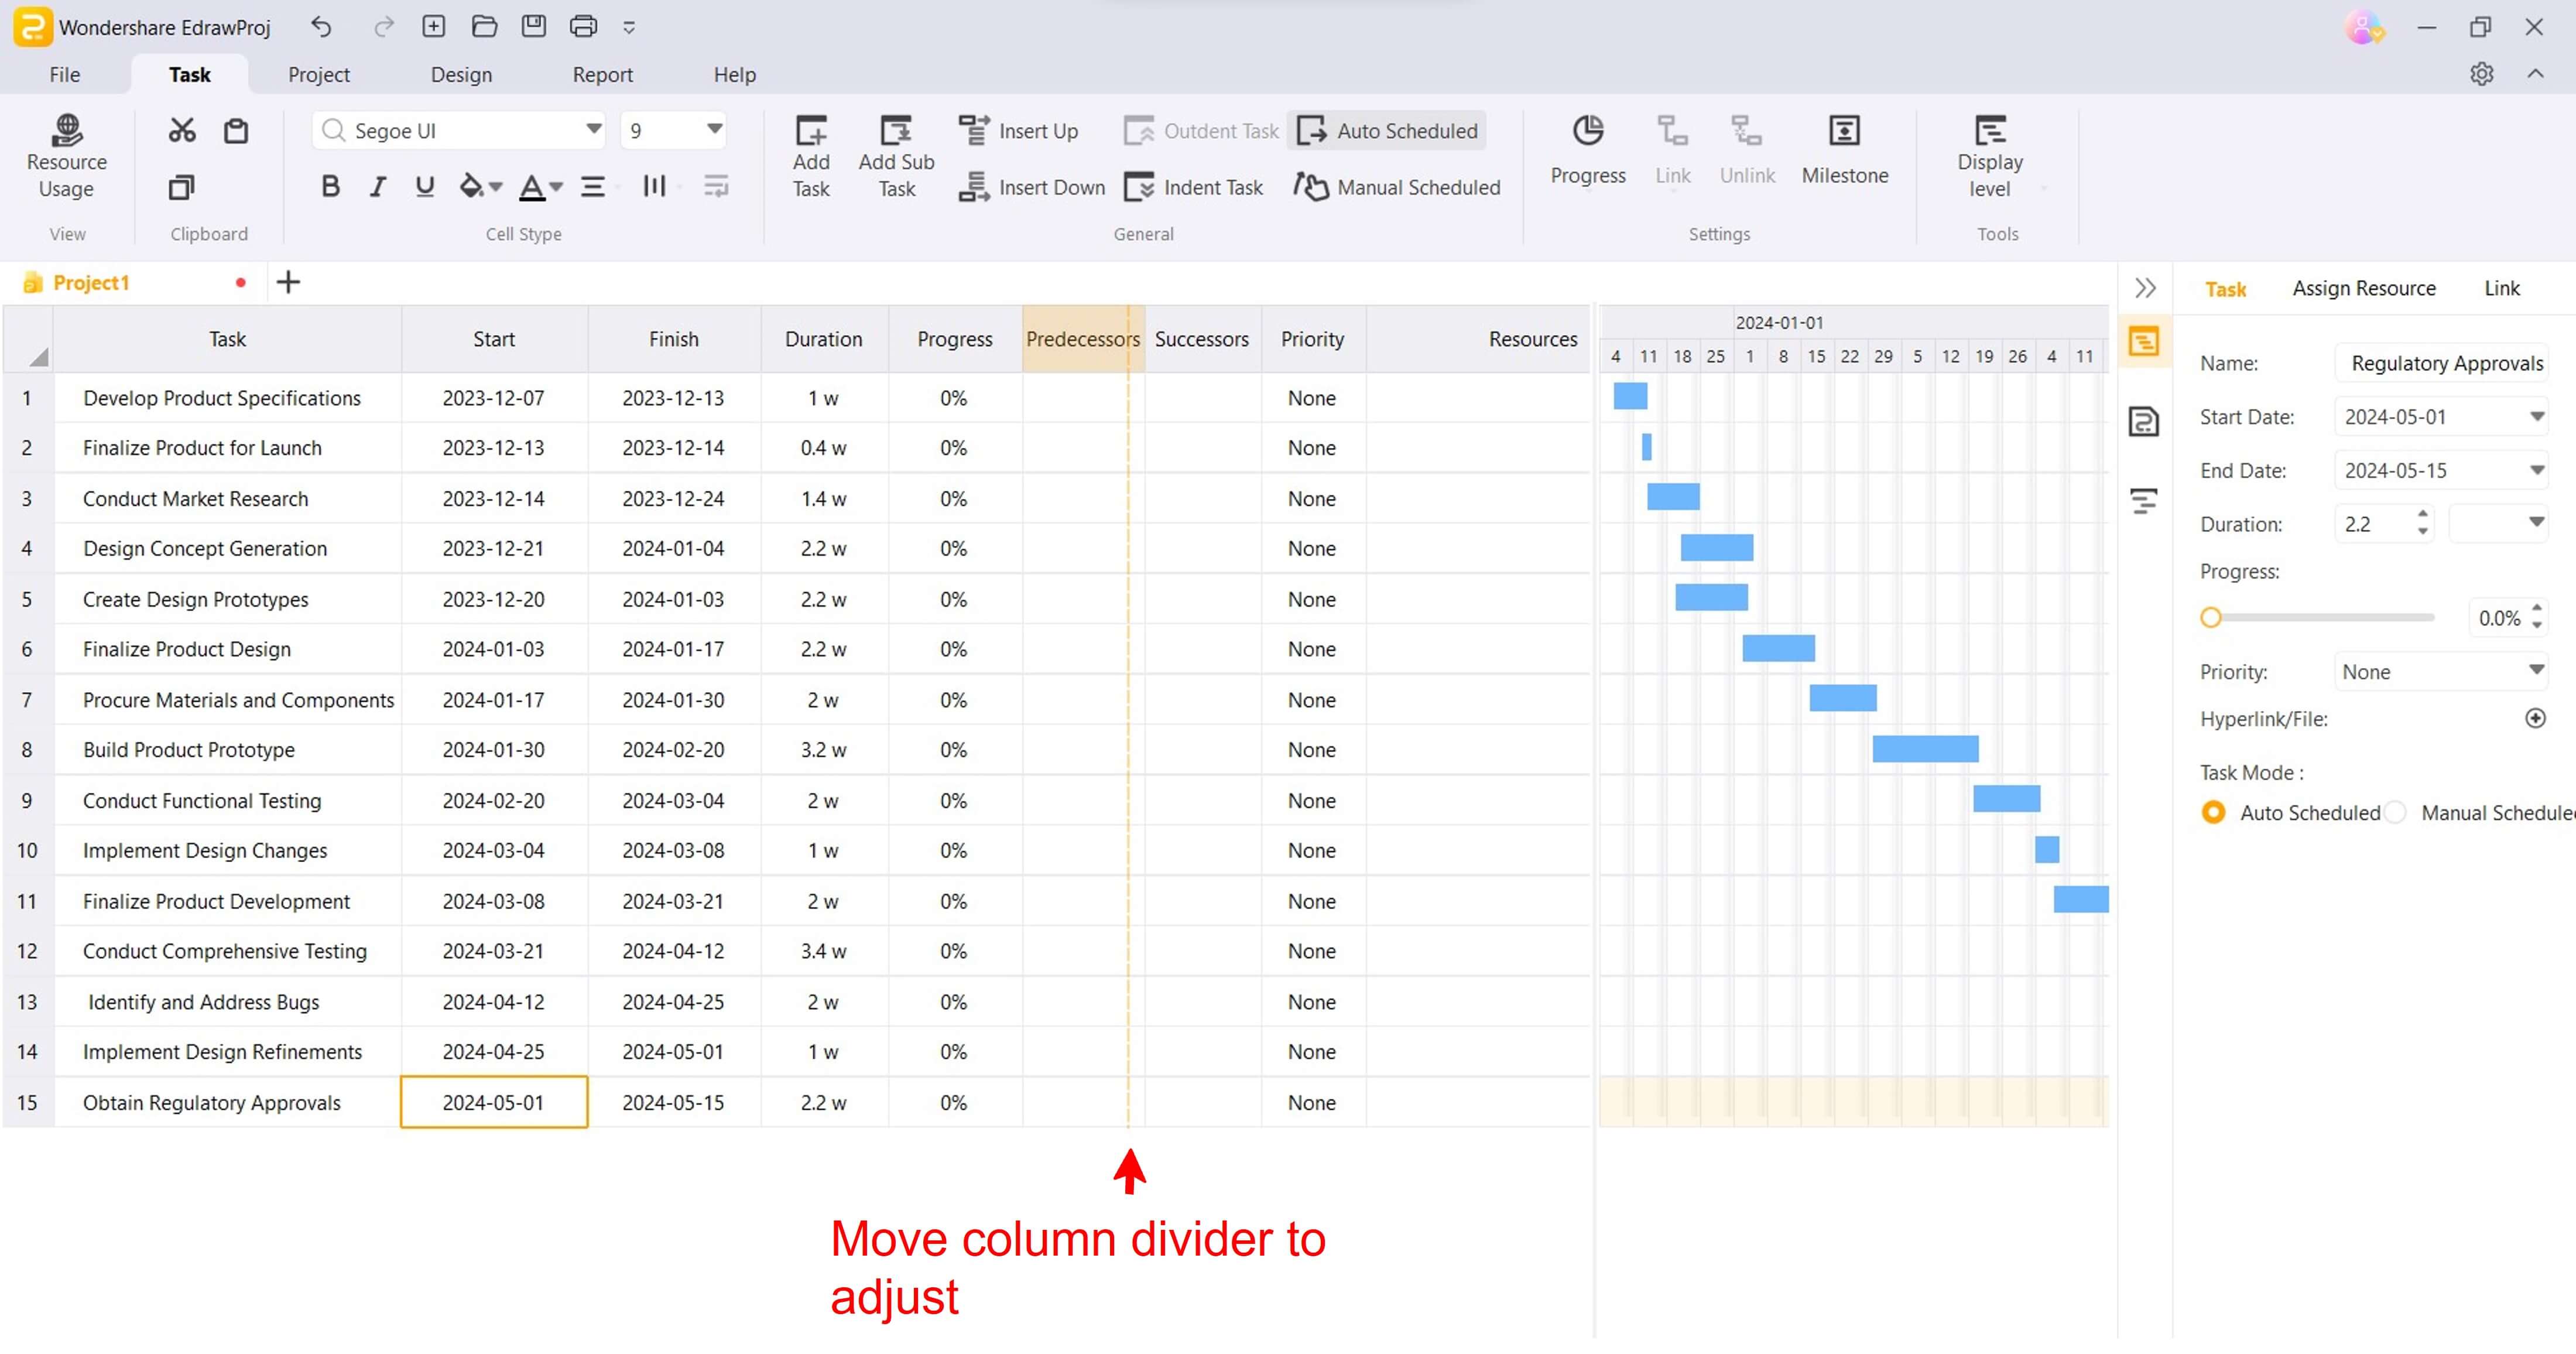
Step 2: From the Task tab in the upper navigation pane, click Add Task to insert project activities. Enter the project details in the designated columns, providing all relevant information.
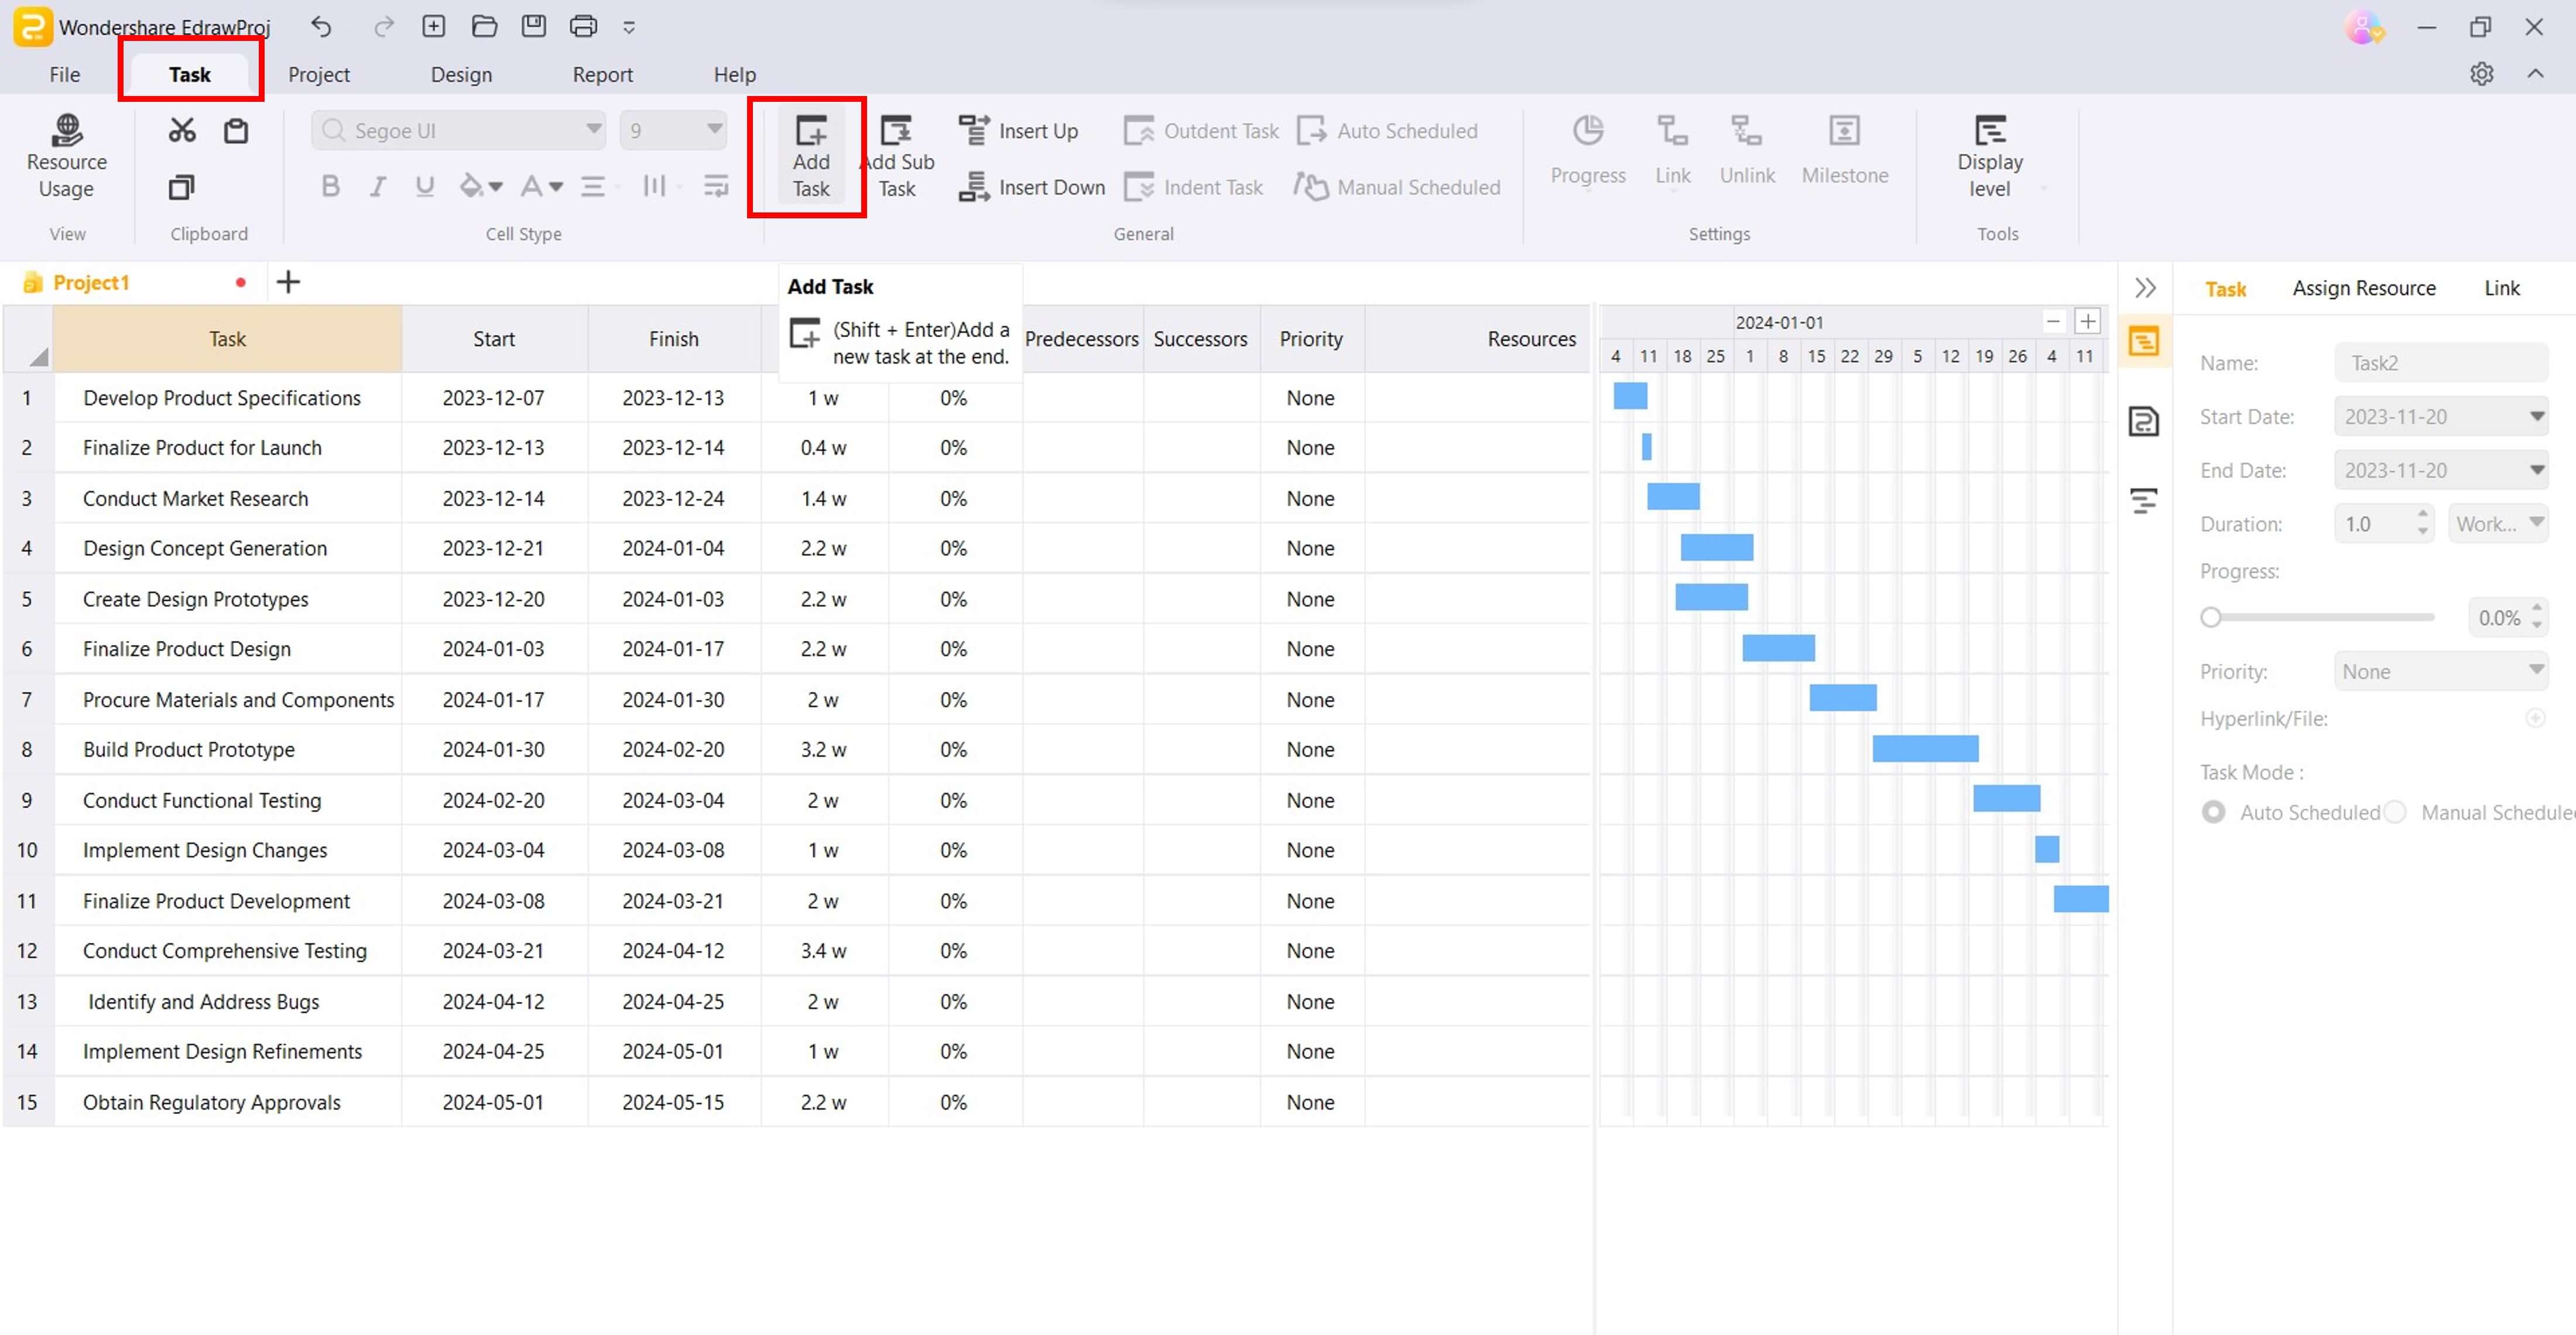
Tip: Click and drag the column divider in the Gantt chart to adjust the columns' width.
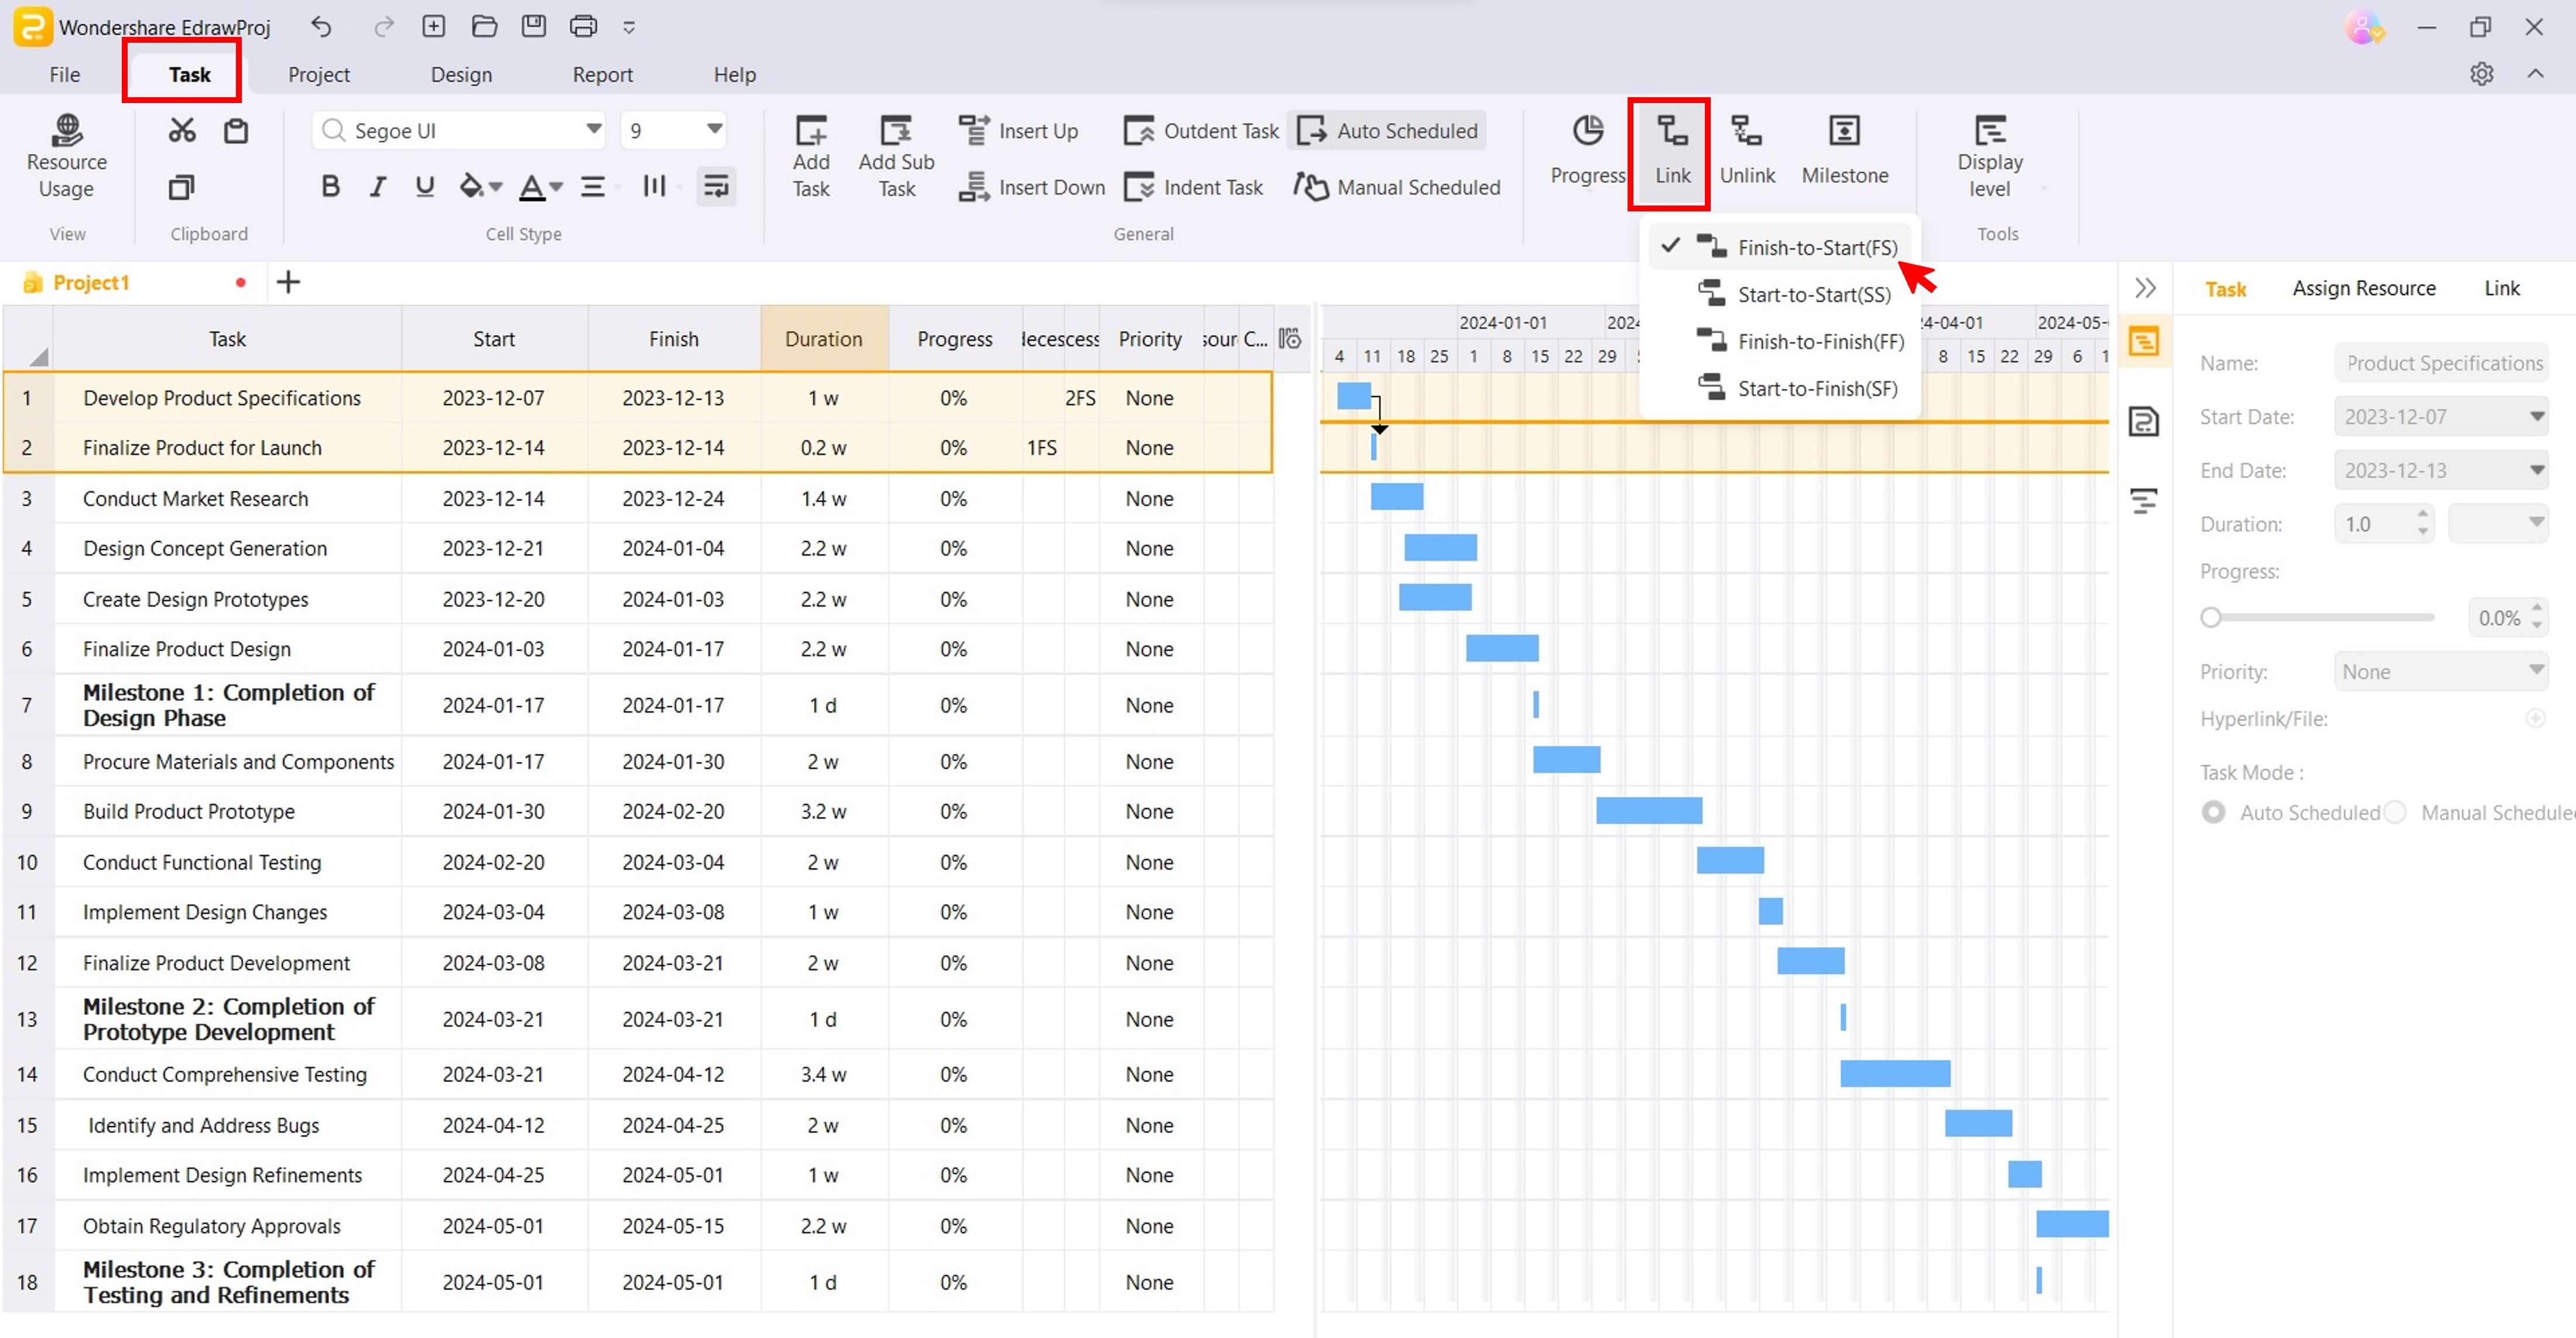
Step 3: Customize and update the Gantt chart from the Task tab in the upper navigation pane:
- Show Task Dependencies
Select at least two project tasks and choose one type of dependency from the Link drop-down menu. Links are represented by arrows that connect the tasks in the chart. For example, Finish-to-Start (FS): The successor task cannot start until the predecessor task is finished.
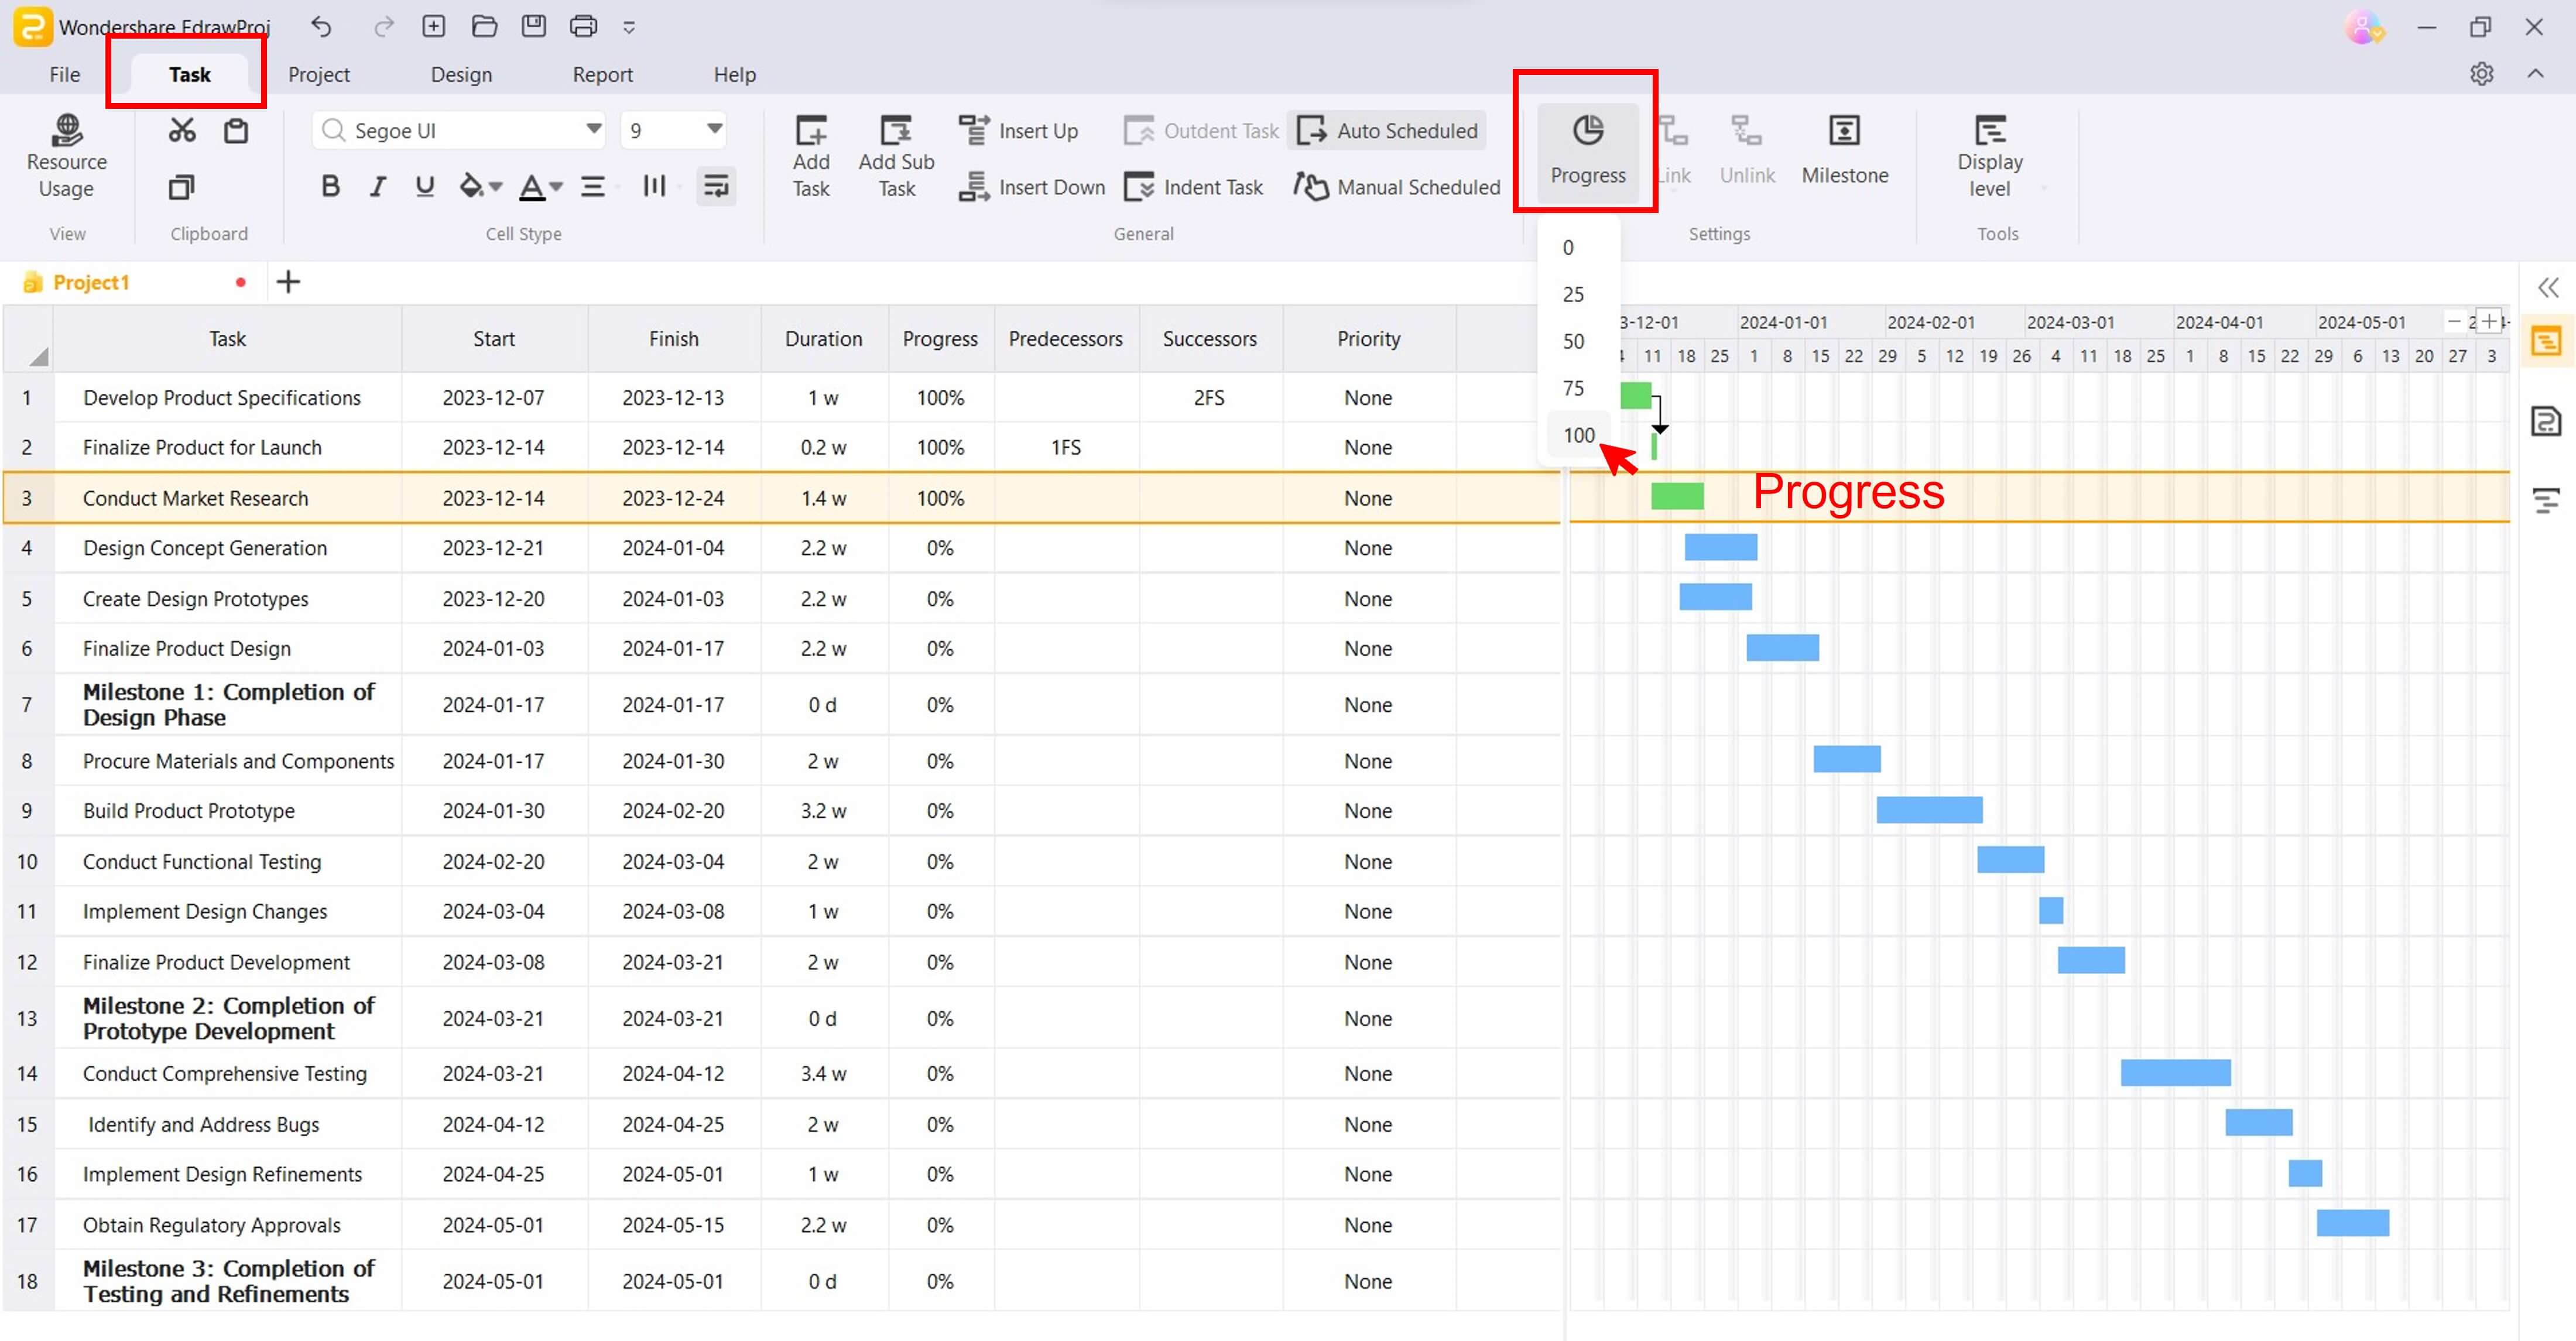
- Indicate Tasks Percentage Completion
Select a project task in the Gantt Chart and choose a percentage from the Progress drop-down menu.
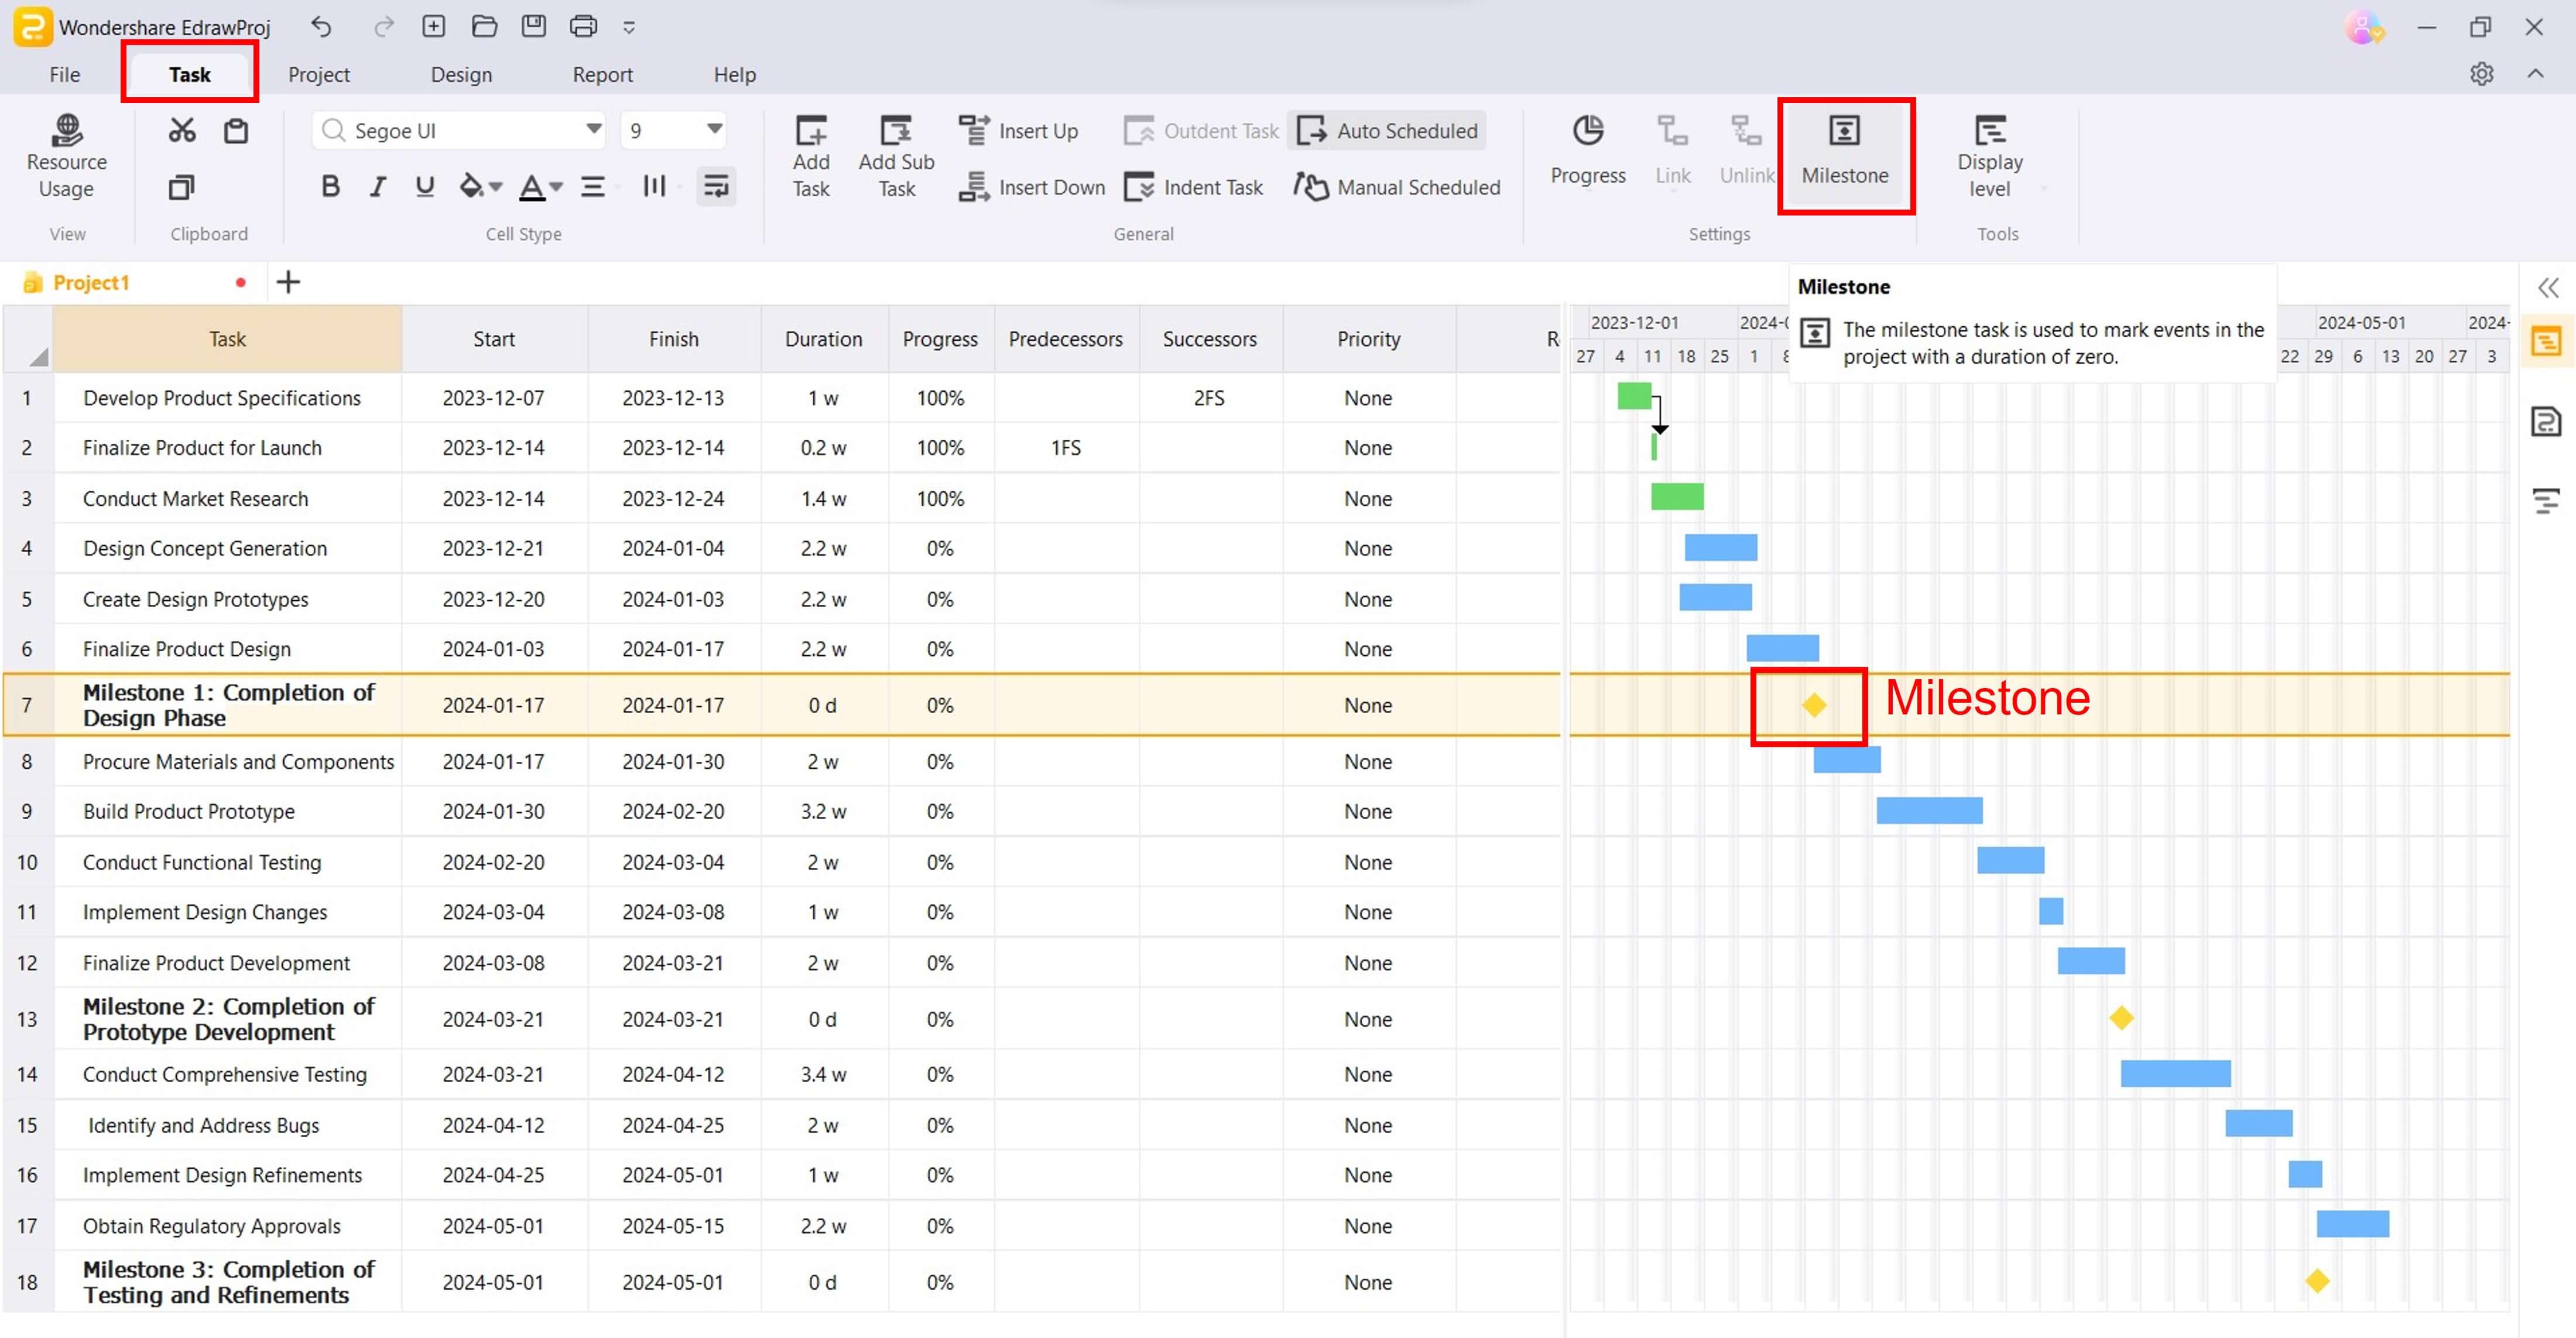
- Add Milestones
A milestone is an important event or achievement marking the completion of a major phase or the delivery of a key deliverable in a project. Diamond-shaped markers on the chart typically represent milestones that do not have a duration. To set it:
Select the phase in the Gantt chart and click Milestone.
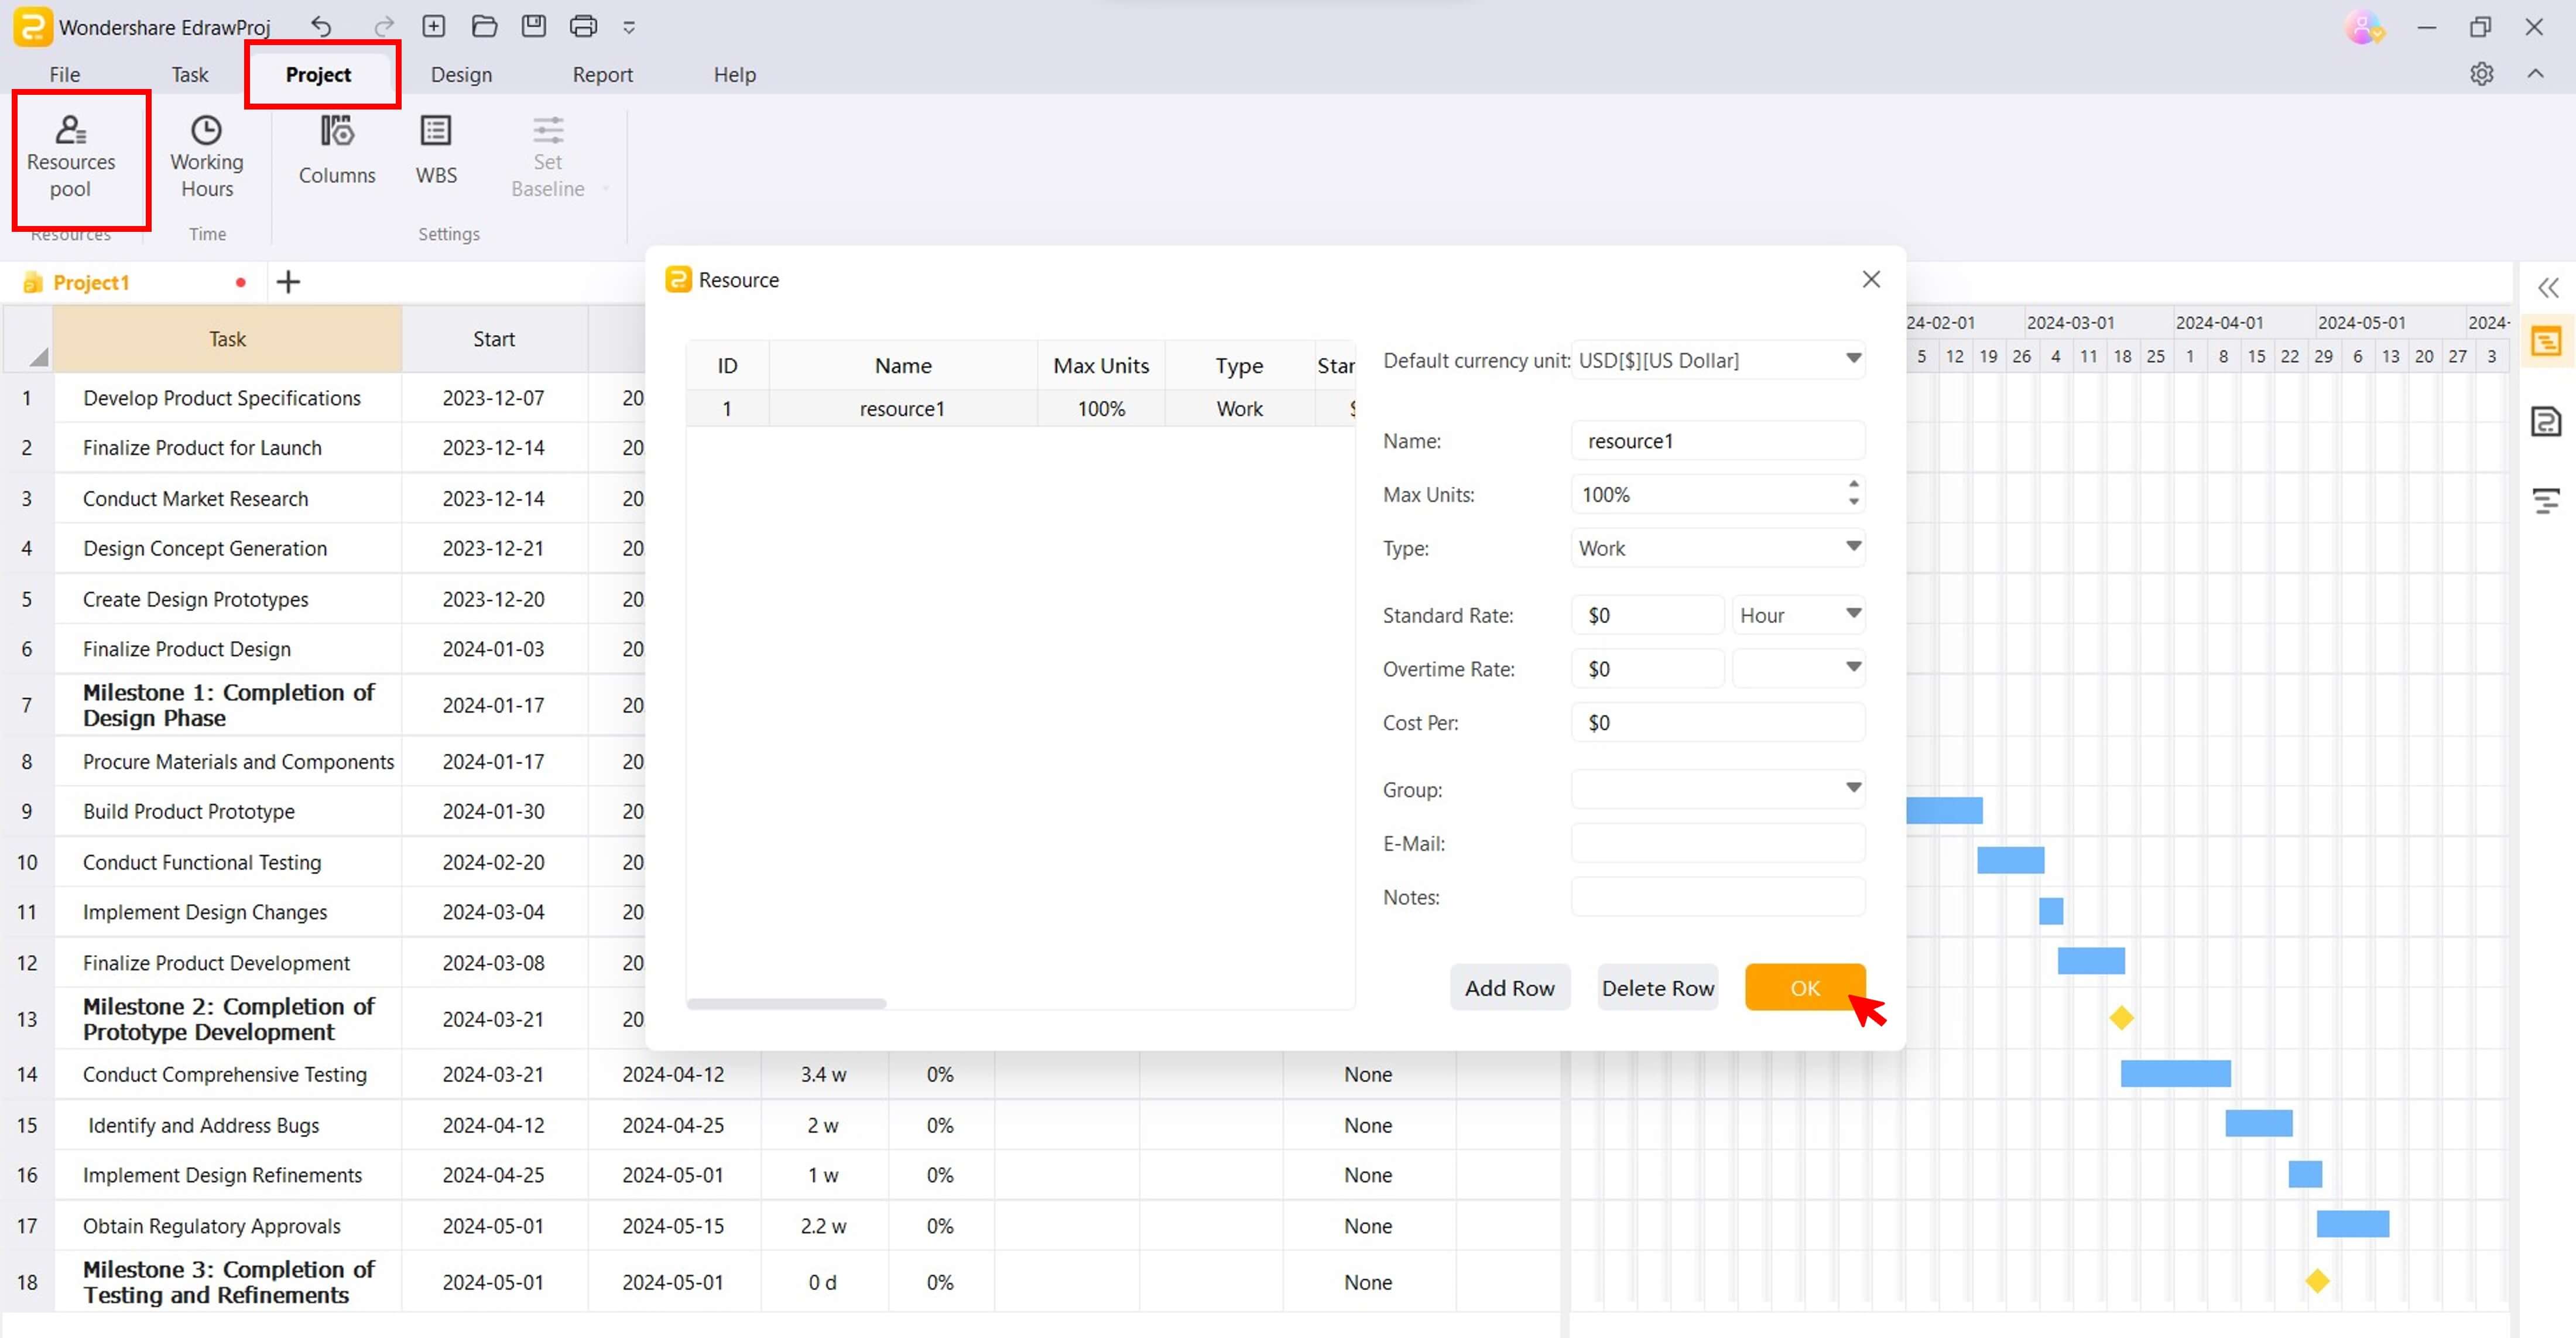
Step 4: Allocate resources for the project, such as work, material, cost, equipment, and company.
Go to the Project tab in the upper navigation pane, then click Resources pool.
Next, from the Resource pop-up window, click Add Row, and from here, you can allocate the project resources, such as the Default currency unit, Max Units, Type, and Standard Rate. Once done with the resource budget, click OK to save your changes.
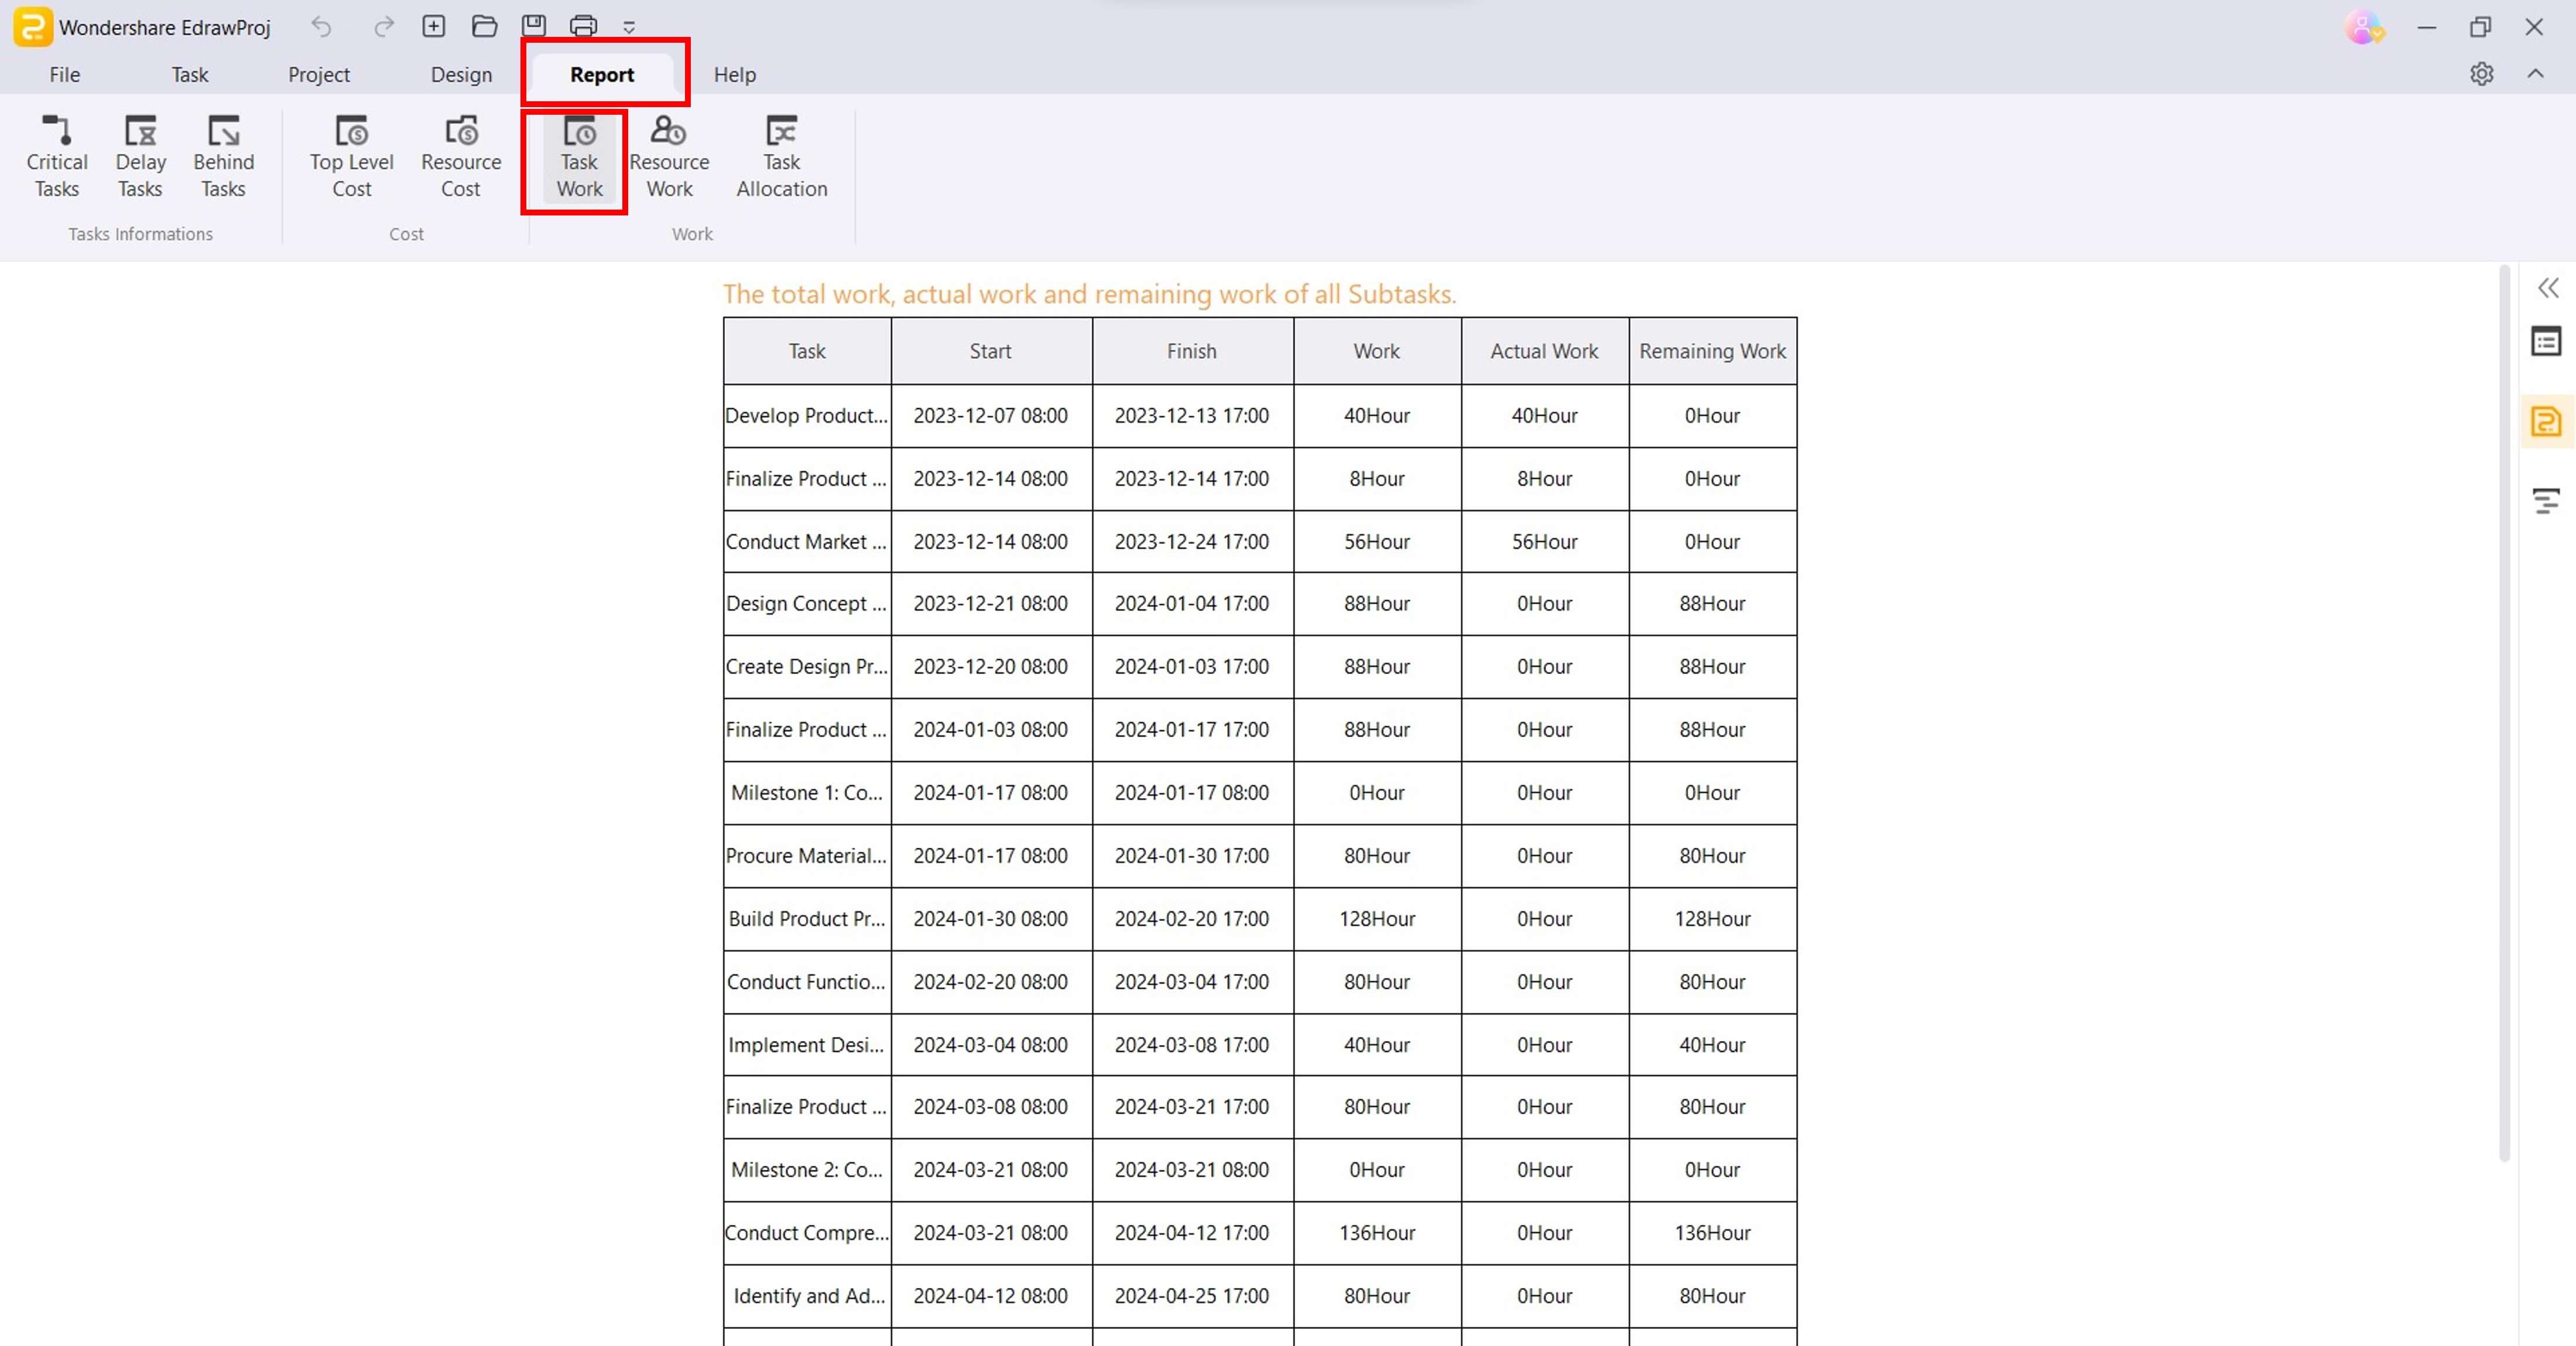
Step 5: Gain insights into project task details, costs, and remaining work hours from the Report tab in the upper navigation pane. Select the report you want to explore, including Critical Tasks, Resource Costs, or Task Work. To resume editing the Gantt chart, click Gantt Chart in the Task tab.
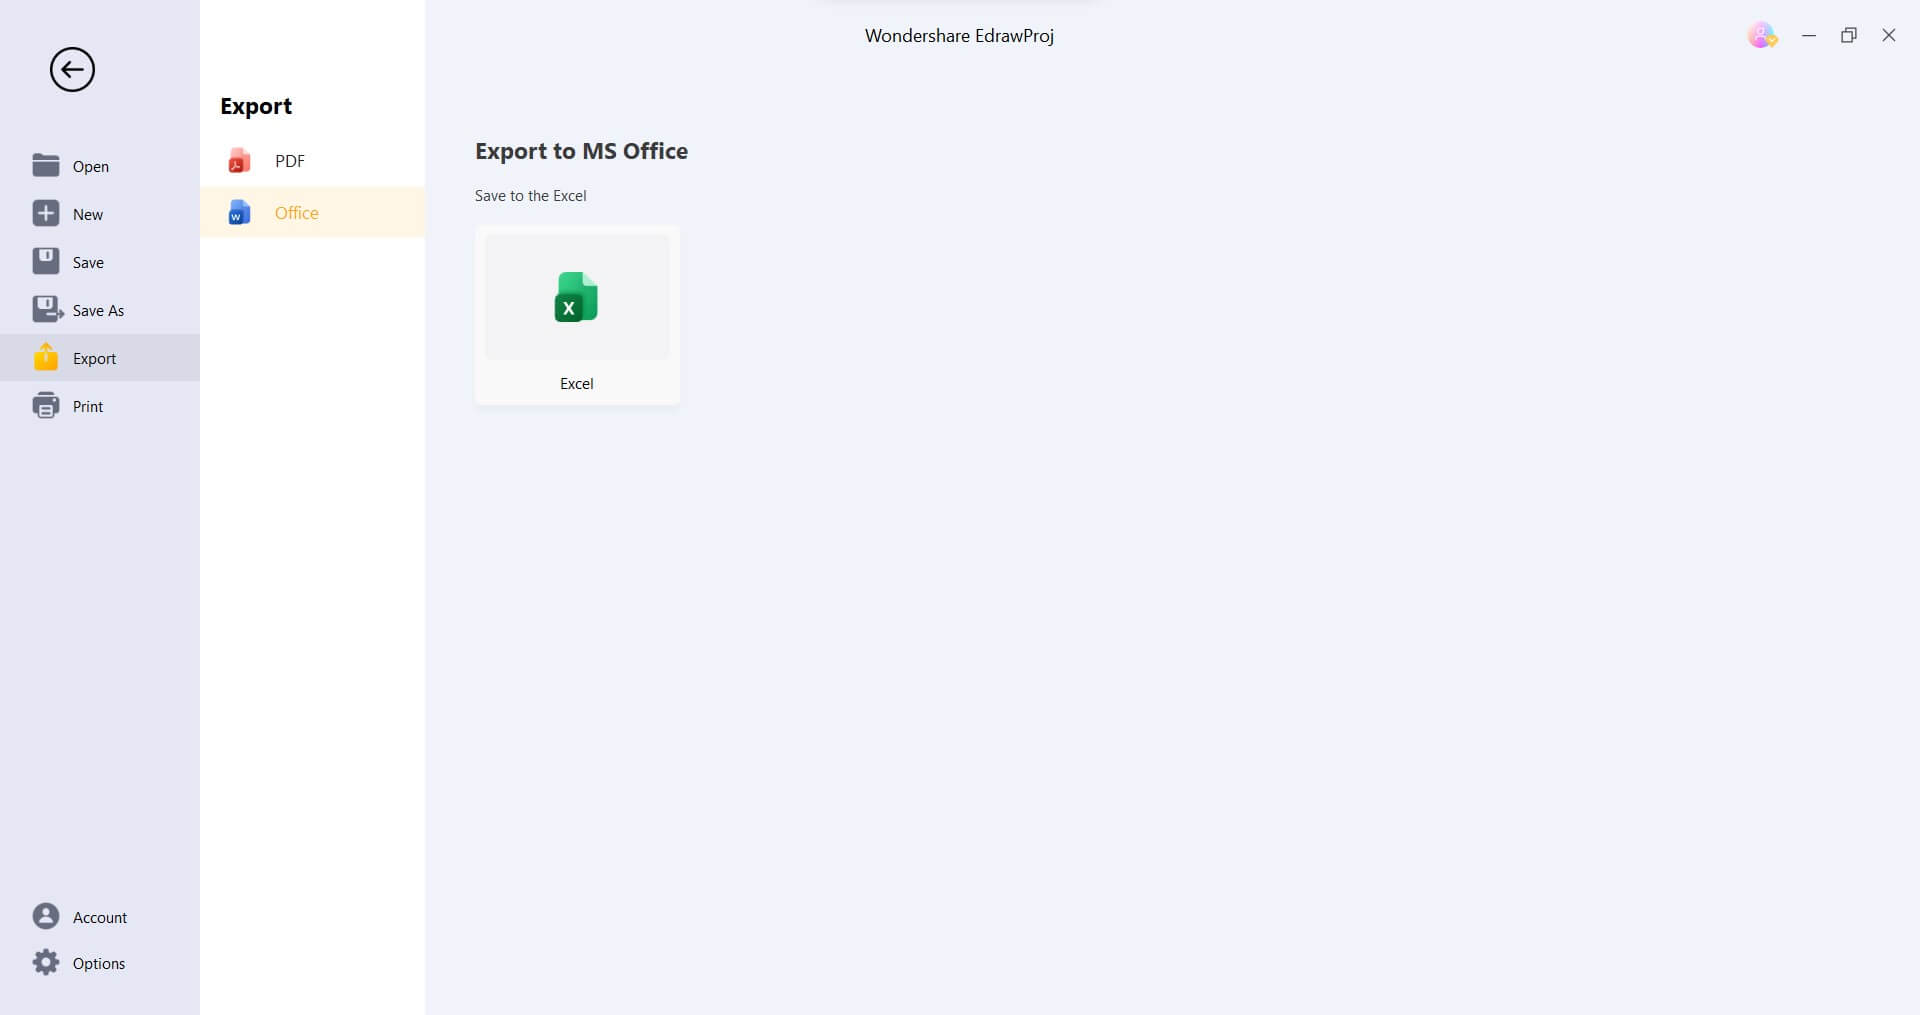
Step 6: Go to File > Export from the upper navigation pane. Export the Gantt chart as a PDF or Excel file.
What Is EdrawProj?
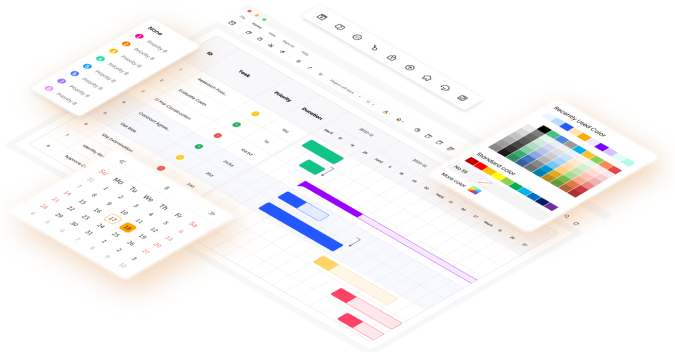
Effective planning, progress tracking, and timely delivery are crucial for success in project management. EdrawProj, a powerful and user-friendly Gantt chart maker, empowers project managers, team leaders, and project members to easily navigate complex projects and achieve their goals.
Designed specifically for projects with large and intricate tasks, multiple personnel, long timelines, and regular plans, EdrawProj simplifies project management. Its intuitive interface and drag-and-drop functionality make creating Gantt charts effortless, even for novice users.
Elevate Your Project Management With EdrawProj Key Features
You can color-code your Gantt chart in Google Sheets to easily identify different project activities. But EdrawProj goes beyond basic Gantt chart creation. It offers a suite of powerful features that elevate your project management capabilities:
- Task Dependencies
Link project tasks in different ways to visualize dependencies and identify potential bottlenecks.
- Milestones
Set and track crucial project milestones to maintain focus and keep the project on schedule.
- Progress Management
Update task progress status, identify delayed tasks, and compare progress against baselines for effective project monitoring.
- Project Reports
Identify areas for improvements to make projects more efficient and cost-effective. Generate reports on critical and delayed tasks to identify potential risks and take corrective actions.
- Resource Pool
Optimize your project budgeting with flexible cost tracking. Set standard and overtime rates for each task, track expenses seamlessly, and ensure your project stays within budget.
EdrawProj: The Versatile Gantt Chart Solution for Every Industry
No matter what industry you're in - electronics, hardware, engineering, automotive, or retail - EdrawProj is a great option for you. It is an affordable and more beginner-friendly alternative to other Gantt chart makers. Not only that, but it also works on Windows, macOS, and Linux, making it an ideal choice for teams of all sizes.
Get started with EdrawProj today and see how it can help you manage your projects more effectively.
Conclusion
Ultimately, the choice of Gantt chart maker depends on your project needs and preferences. Creating a Gantt chart in Google Sheets may suffice if you require simple and basic project planning. However, if you manage complex projects with intricate dependencies and need a more robust tool, dedicated Gantt chart makers like EdrawProj offer a more comprehensive and user-friendly experience.
Effective project management demands juggling tasks, managing deadlines, and keeping everyone aligned. So, regardless of which tool you choose, Gantt charts can be a valuable tool for improving your project management skills.
A professional Gantt chart tool to plan, manage and track your projects, process and resources.

A Place for Project, Process, Resource Management