How to Create a Database Diagram

In this guide, we will talk about what a database diagram is and why it matters for the success of a business. You will also learn how to create a database diagram and the most popular tools for making these diagrams.
What is a Database Diagram?
A database diagram is a visual tool that helps you present a database using tables, columns, keys, and relationships.
Using a database diagram, you can visualize and design any database to which you are connected. These diagrams are the foundation of database design and development and it helps represent the basic structure of a database.
Moreover, with such diagrams, you can plan how information is stored, categorized, and managed within a database.
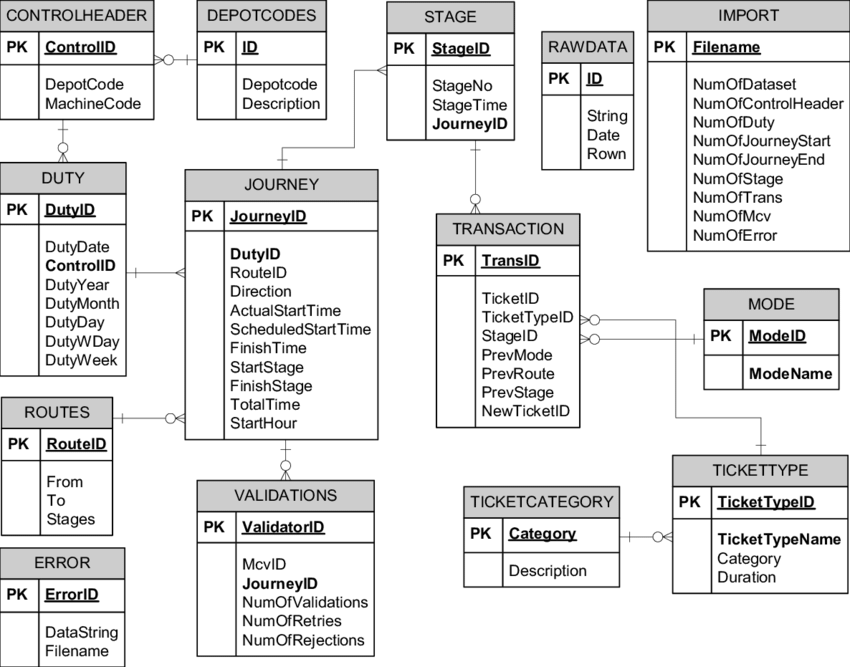
Image source: researchgate.net
Components:
A database diagram is composed of different parts, and 3 essential elements are:
1. Entity
An entity is a person, place, or event relevant to the given system.

Image source: beginnersbook.com
2. Weak Entity
The weak entity is the entity that depends on the existence of another entity. Each weak entity cannot exist and be identified on its own attributes without the support of main entities. Different foreign keys combine search entities to their attribute that forms a primary key.
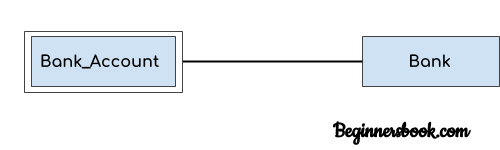
Image source: beginnersbook.com
3. Attribute
The attribute is a trait property or characteristic of an entity. While entities can have many attributes, the attribute itself cannot have their own specific attributes.
4. Relationship
The relationship describes how different entities interact and relate to each other.
5. Keys
The keys are a way to characterize attributes, and they link various tables in a database to each other in the most efficient way.
6. Tables
Tables in a database are composed of rows and columns, and they ensure that the database is organized, efficient, and fast.
Why Database Diagrams Matter?
Database diagrams are important because they avoid changing the data in the production phase of a database. They plan out the modifications carefully and help visualize design ideas. Using a diagram allows you to identify the mistakes and design floors before actually implementing the design. You can make corrections before design execution and implementation.
Moreover, such diagrams create a graphical representation to understand various entities' attributes and relationships better. This further helps clearly understand the data structure and how you can minimize redundancy and other problems.
How to Create a Database Diagram?
The right database design tool allows you to create a well-designed database that will give users access to important information. With the help of the principles mentioned here, you can create a database diagram that will perform efficiently and provide optimal results.
The designing process of a database includes the following phases.
1. Requirements Analysis – Identifying The Purpose of the Database
Identifying the purpose of a database will inform the choices throughout the design process. You can get there the relevant information through:
- Interviews
- Business forums like service invoices and timesheets
- Analyzing existing data systems
Once you get the relevant data and information, break it down into smaller useful pieces. Once you have analyzed where the data comes from and how it can be used, you can start planning out the actual database.
2. Database Structure – The Building Blocks of a Database
Now it's time to visually represent your database and understand how the relationships are structured.
The related data will be grouped into tables, consisting of rows (tuples or records) and columns. You will create a table for each type of entity like sales, customers, products, etc.
Each row or record will include information about each relevant entity. In contrast, the columns (also called fields or attributes) will contain a single type of information appearing in each record. For example, address age contact information, etc.
In the overview of a database, each table will appear as a separate box in the diagram, and the title of each box will describe what type of data the box contains.
Finally, you will choose the primary keys to identify a given entity.
3. Creating Relationships Between Entities
When your database tables are converted into boxes, you are ready to analyze the relationship between each table. Each entity can potentially have one of these three types of relationships with another entity:
i. One-To-One Relationships
This relationship occurs when only one instance of an entity is for every instance of the other entity.

Image source: beginnersbook.com
ii. One-To-Many Relationships
This relationship occurs when a record in one table is connected with multiple entities in another.
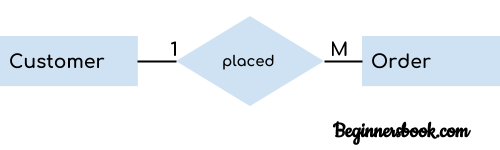
Image source: beginnersbook.com
iii. Many-To-Many Relationships
This relationship occurs when many different entities from a table can be associated with multiple entities and another table.

Image source: beginnersbook.com
4. Database Normalization & Standardization
Once you have the initial design for your database you can apply normalization and standardization rules to make sure that the tables are structured properly.
Image source: guru99.com
Let's take a look at different normal forms:
i. First Normal Form (1NF)
The first normal form indicates that each cell in the table will have only one value.
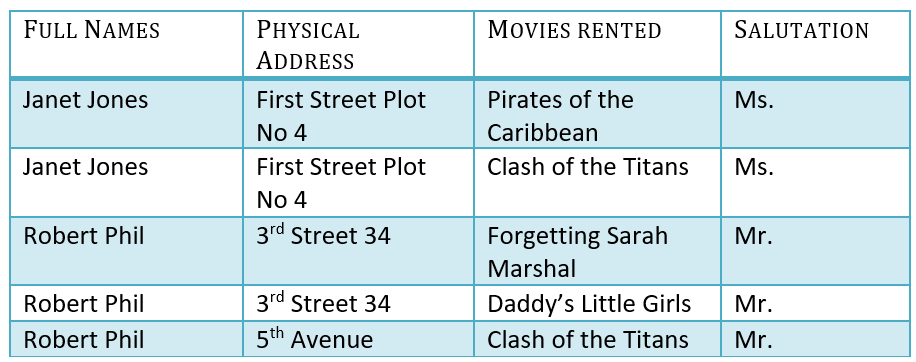
Image source: guru99.com
ii. Second Normal Form (2NF)
The second normal form indicates that each attribute should be entirely dependent on the entire primary key. This means that every attribute will depend directly on the primary key rather than indirectly through some other attribute.
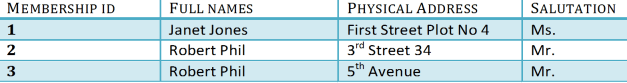
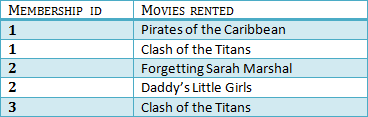
Image source: guru99.com
iii. Third Normal Form (3NF)
The third normal form requires that every non-key column will be independent of every other column. For example, changing a value in one non-key column will not cause another value to change another column.
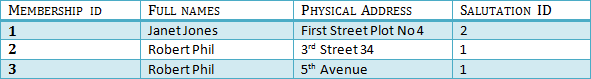
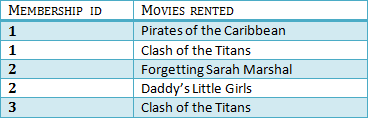
Image source: guru99.com
Apart from these, other normal forms have also been proposed, including the Fourth Through Sixth normal form, the Boyce-Codd normal form, and the Domain Key normal form.
Now that you know the different normal forms, it is also important to understand that the degree of normalization depends on different aspects of a database like multidimensional data that integrity rules indexing SQL and UML.
Popular Database Diagram Design Tools
Different kinds of tools are used for making database diagrams. These tools allow you to create, edit automatically, and import database diagrams and offer popular database symbol keys, connectors, and pointers to visualize the important information.
Some of the most popular database diagram designing tools available in the market are:
- EdrawMax
- Lucidchart
- Draw.io
- Dbdiagram.io
- SqlDBM
- Visual Paradigm
- Toad World

