How to Use Fault Tree Analysis
Part 1: What is Fault Tree Analysis?
Fault tree analyses are conducted in safety engineering and reliability engineering to determine and explore the causes of failures, using "events" and "logic gates". By conducting this analysis in the risk assessment before kicking off a project, you can mitigate risks before they occur.
A fault tree is useful for allowing team members to identify potential risks by illustrating the relationships between events and causes that lead to them. This allows you to prioritise resources to fixing those issues before they occur. They are especially useful in the fields of quality testing and maintenance.
Part 2: How to Make a Fault Tree Analysis Effortlessly?
Step 1: Start EdrawMax.
Step 2: Navigate to [New]>[Management]>[Fault Tree Analysis]
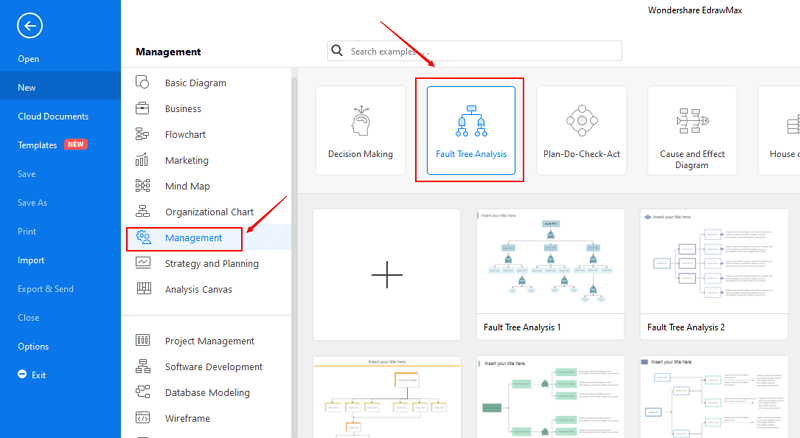
Step 3: Select one fault tree analysis template to edit on it or click the [+] sign to start from scratch.
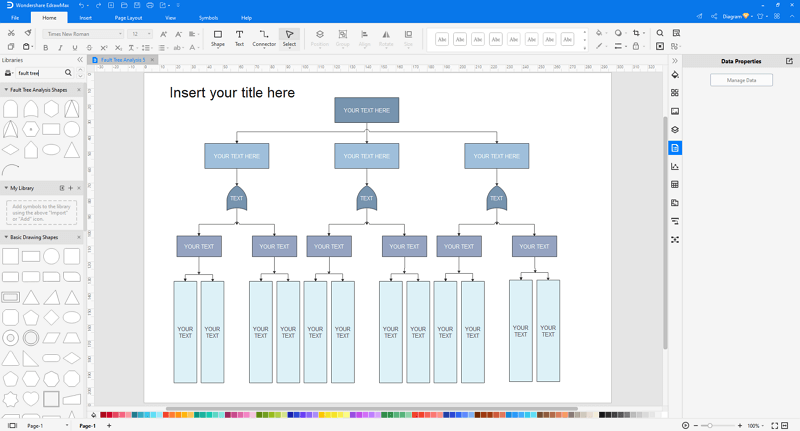
Note: Here are some tips for you about how to make a fault tree analysis with EdrawMax.
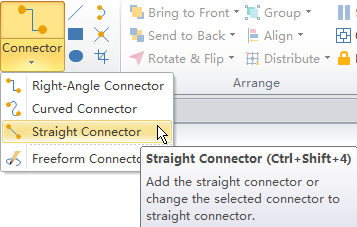
Step 4: You can export the file to Graphics, PDF, editable MS Office file, SVG and Visio vsdx file.

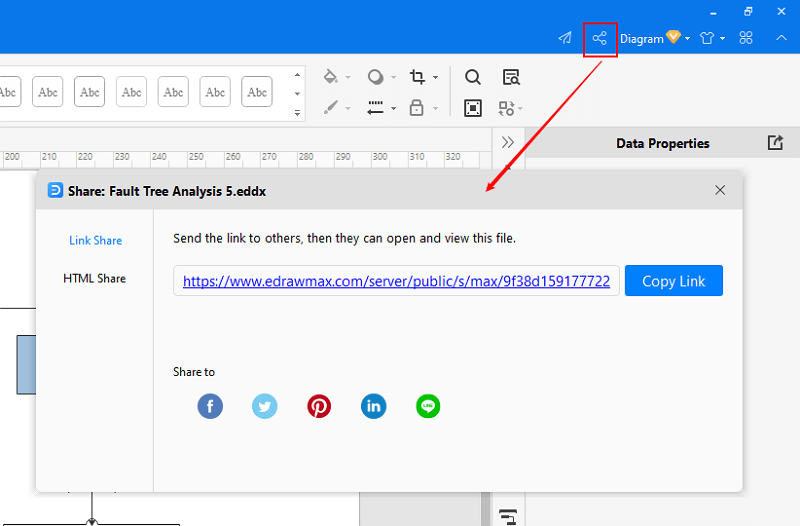
Step 5: And you can share your diagram with others via social media and online website page.
Part 3: Fault Tree Analysis Examples
Fault Tree Analysis Example 1
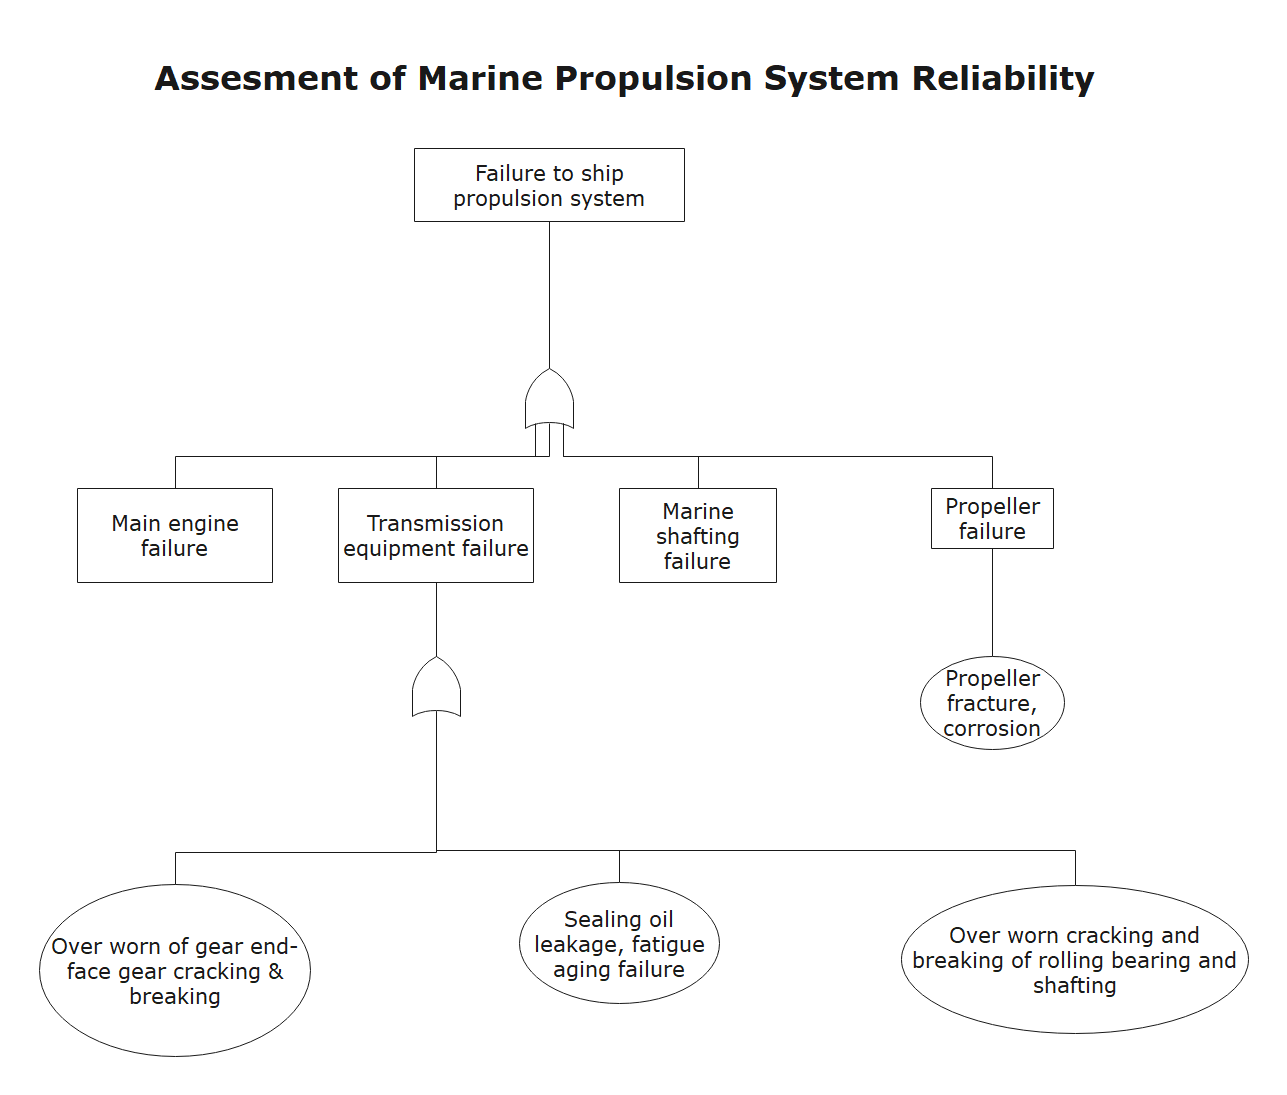
A Fault Tree Analysis is a top-down, deductive failure analysis in which an undesired state of a system is analyzed using Boolean logic to combine a series of lower-level events. A marine propulsion system’s breakdown can be analyzed using an FTA method by going in-depth about the marine shaft and the propeller.
Fault Tree Analysis Example 2
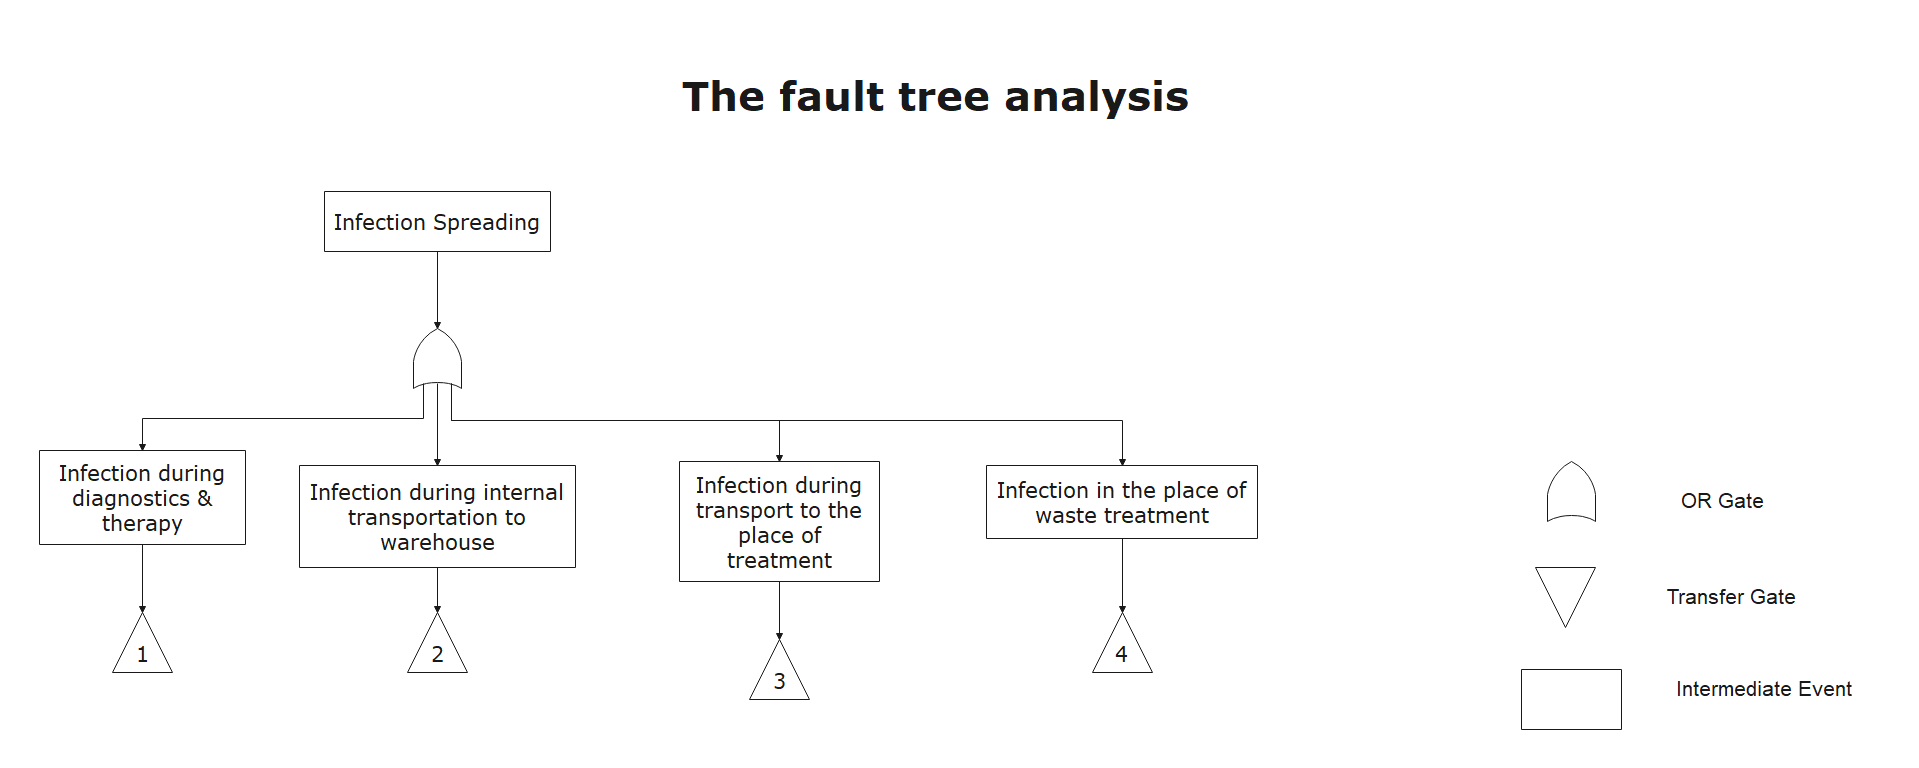
Fault Tree Analysis follows the concept of Boolean logic that permits the creation of a series of statements based on True or False. When linked in a chain, these statements form a logic diagram of failure that makes sure that nothing unfortunate happens within the system. The FTA method can be used to understand the medical waste management system by learning more about the functional, qualitative, and quantitative approaches.
Part 4: Conclusion
According to this article, there are mainly three parts to illustrate what is fault tree analysis, to tell you how to make a fault tree analysis easily, and to show you some fault tree analysis examples.
EdrawMax is an easiest all-in-one diagramming tool, you can create fault tree analyses and any other type diagrams with ease! With ready-made timeline symbols and cliparts, making fault tree analyses could be as simple as possible. Also, it supports to export your work in multiple formats and share your work with others. Get started to create your fault tree analyses now!
Related Articles
Element of Fault Tree Analysis Diagrams


