Creating Gantt Chart From Data
Discover why Edraw is the perfect tool to create a Gantt chart: Try it FREE.
Before you can use the data to create a Gantt chart, you
need to know the file format required by the Gantt Chart wizard. Conveniently,
the Gantt Chart Wizard has an export option so you can use it, along with the
generic Gantt chart you created above, to generate an Excel file. You can then
delete the data from the Excel file and replace it with your own.
Step 1: Create a New Gantt Chart Document
With Edraw running, use the appropriate selection from File
menu:
File>New>Project Management>Gantt Chart
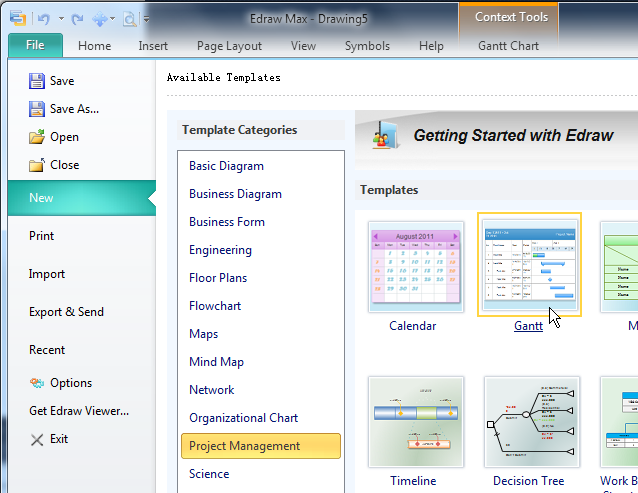
When the new Gantt Chart document opens, you can drag a Gantt chart template
from the library panel. The Gantt Chart Options dialog show below.
Click OK to accept the default parameters and create a Gantt Chart that looks like this:
To create an export file, select Export Data... from Gantt Chart menu. The resulting file will look something like this (there are many more columns to the right):
Step 2: Manually Create a Gantt Chart from an Excel File
Select Import Data... from the Gantt Chart menu. Step through the sequence of dialogs shown below..
Locate your Excel file, then click Next.
After you click Finish in the final dialog, the wizard will
create a new page and insert a Gantt chart in it.
Step 3: Customize Gantt Chart
For advanced customizations, on Gantt Chart tab, you will find different groups for setting up the tasks and manage data.
Add More Tasks to the Gantt Chart
Select the Gantt chart then click the Insert New Task button in the menu.
Edit Task Name
Double click the text in the Gantt chart, then type the text.
Add Milestones to the Gantt Chart
You can change a task into a milestone by setting its duration to 0. Similarly, you can change a milestone into a task by setting the duration to a positive number.
Create Dependencies Between Tasks in the Gantt Chart
First, click to select the task bar or milestone you want to link from, and drag the mouse to the dependent task or milestone.
Or press Ctrl and click to select the dependent task or milestone (Click the white region in the row). Right-click one of the shapes, and then click Link Tasks.
Adjust the Task Bar
You can also change a duration by selecting the task bar, and then dragging the selection handle on the right end of the task bar until it aligns with a new end date on the timescale.
More Information:


