A Gantt chart is a bar chart that contains more information about the project than a regular bar chart. It is a tool that helps the project managers know what is happening in the project. The Gantt chart lets the project or product managers track the project's progress and how much work has been done on a project.
The Gantt chart tells the resources and tools utilized on a project and helps the project team do the whole project in a task. In a Gantt chart, the tasks derived from the main project are listed on the left side of the chart, and then the resources and dependencies take the lead. And then, on the central part, the task's progress is listed, telling how much work is completed. The time duration is also mentioned on the above chart against which the milestones are set with the tasks.
In this article
Overview of Microsoft Planner
The Microsoft Planner is a to-do planner application that runs on the Microsoft 365 platform. The application can be used in many ways for file sharing, project management, team collaboration, and team management, etc.
The team collaborates using Microsoft planner and manages work using the kanban method. The application can be downloaded on mobiles using the Google Play Store and on desktops too.
The Microsoft Planner is a handy tool that makes project and team management easy. Plus, you can also collaborate with other colleagues, plan and assemble your projects in an efficient way. The application allows you to track the project progress, and that makes the application super cool.
Who uses the Microsoft Planner a lot?
Professional persons like the project managers who are working with the team on a particular project use the Microsoft Planner a lot. The ordinary office workers can also collaborate with other colleagues to manage, assemble, and plan their tasks.
The Microsoft planner makes it easy for you to collaborate with your organization efficiently as it is specifically made for planning and collaborating purposes. So, the application is broadly used by professional people rather than students or other persons.
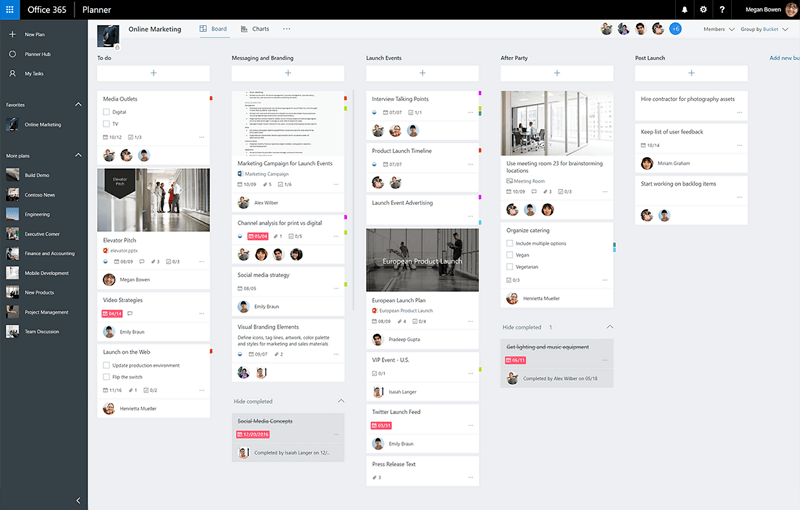
Gantt Chart on Microsoft Planner
As mentioned above, the Gantt chart is the planning tool that lets the project managers and the team efficiently track the project’s progress made explicitly. The Microsoft Planner is also a project handling and a great collaboration tool, so the Gantt Chart can also be made in the Microsoft Planner.
Plus, the application provides many features and tools to organize your data efficiently. But, there is also the other side of the coin, and so the Microsoft Planner also lacks many features like there is no time tracking in the application that is the central part in the Gantt chart as we compare tasks progress against the time duration.
How to Make a Gantt Chart in Microsoft Planner
Making a Gantt chart on the Microsoft Planner is relatively easy in this section. We will see how to make a Gantt chart on the Microsoft Planner. Follow the below steps carefully.
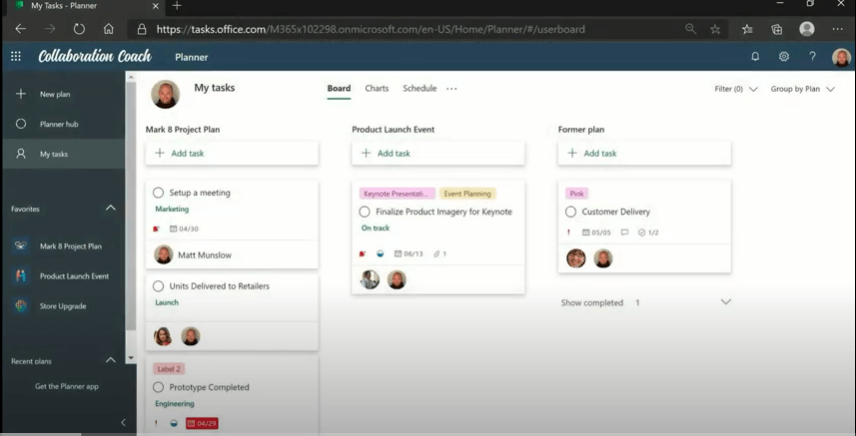
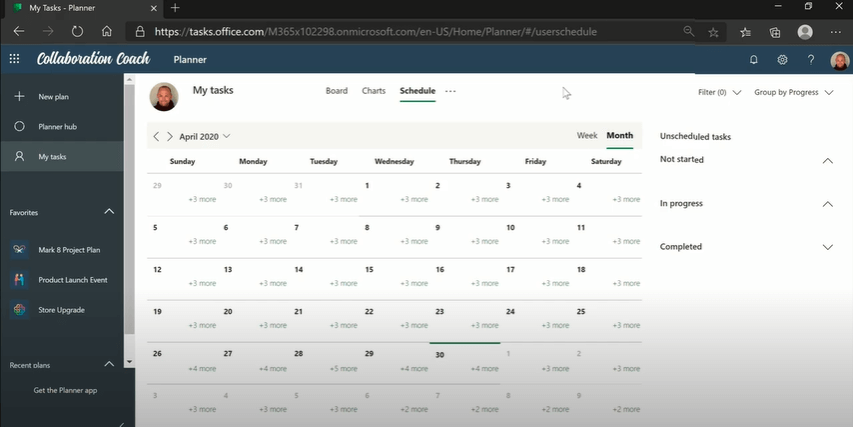
Recently, Microsoft has added a new feature on Planner called My Tasks that showcases your tasks and their progress in a systematic way.
- Open the Planner, open the My Tasks pinned on the left of the windows.
- You will see the overview and collaborators on the first page, but you have three options above the page: board, chart, and schedule.
- When you open the My Tasks then you will be directly taken to the Board view. You can switch from there by clicking the Chart view.
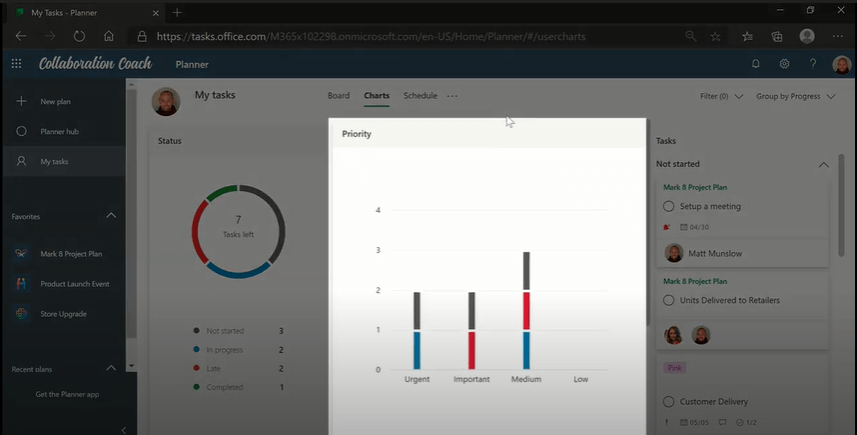
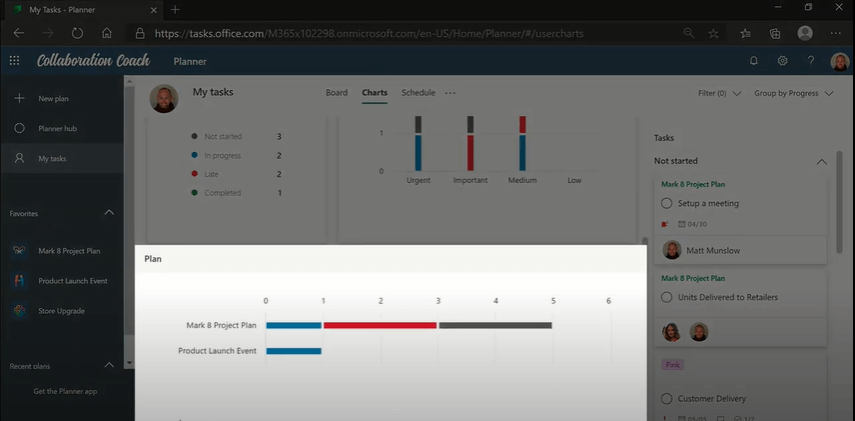
- When you open the Chart view, the first thing you will see will be the overall status that tells how much work has been done related to a particular task. And then, there is a priority chart that shows the most essential task marked with red color. At the bottom, you can see the tasks by plan also.
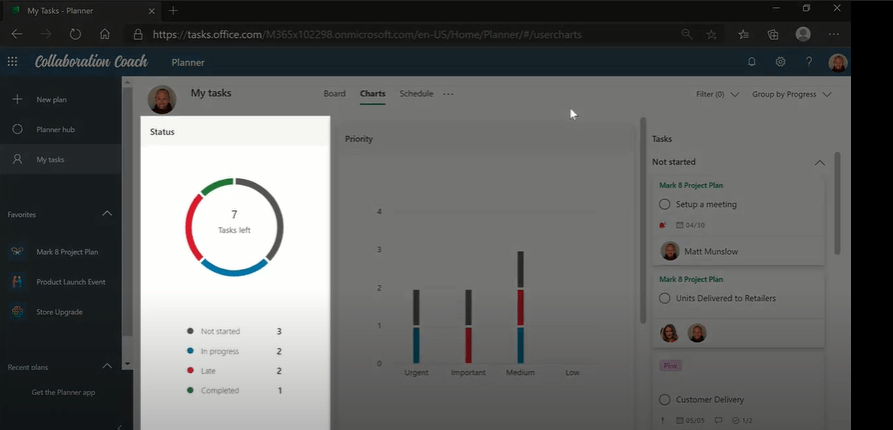
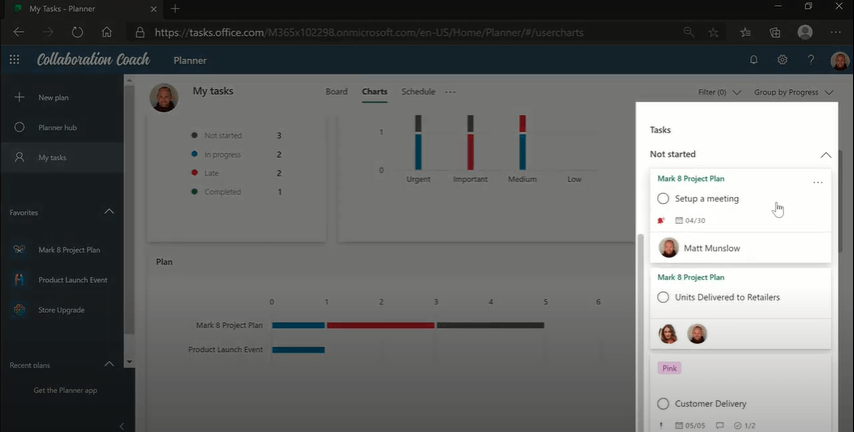
- On the right-hand side, you can view all your tasks easily.
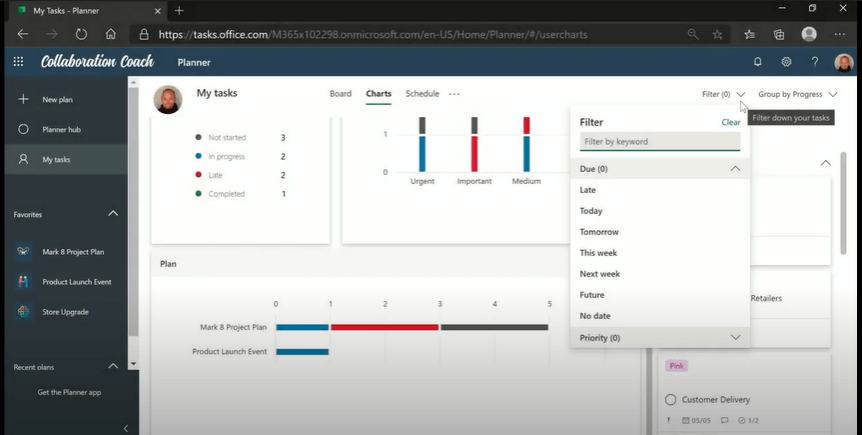
- The Filter option is also provided on the three views by which you can filter your chart in many ways.
- If you want to see your tasks on the calendar, you can switch to the schedule view, but for this, your tasks should also have due dates.
How to Make a Gantt Chart More Effectively
EdrawMax is a powerful, all-in-one, and yet easy-to-use diagramming tool that enables users to visualize the ideas effortlessly.
EdrawMax provides beginners and pros the cutting-edge functionalities to build professional-looking diagrams easier, faster, and cheaper! It allows you to create more than 280 types of diagrams and should be an excellent Visio alternative.
Step1Open a Gantt Chart Template
Install EdrawMax on your computer or visit EdrawMax Online. Navigate to [File] > [Project Management] > [Gantt Charts].
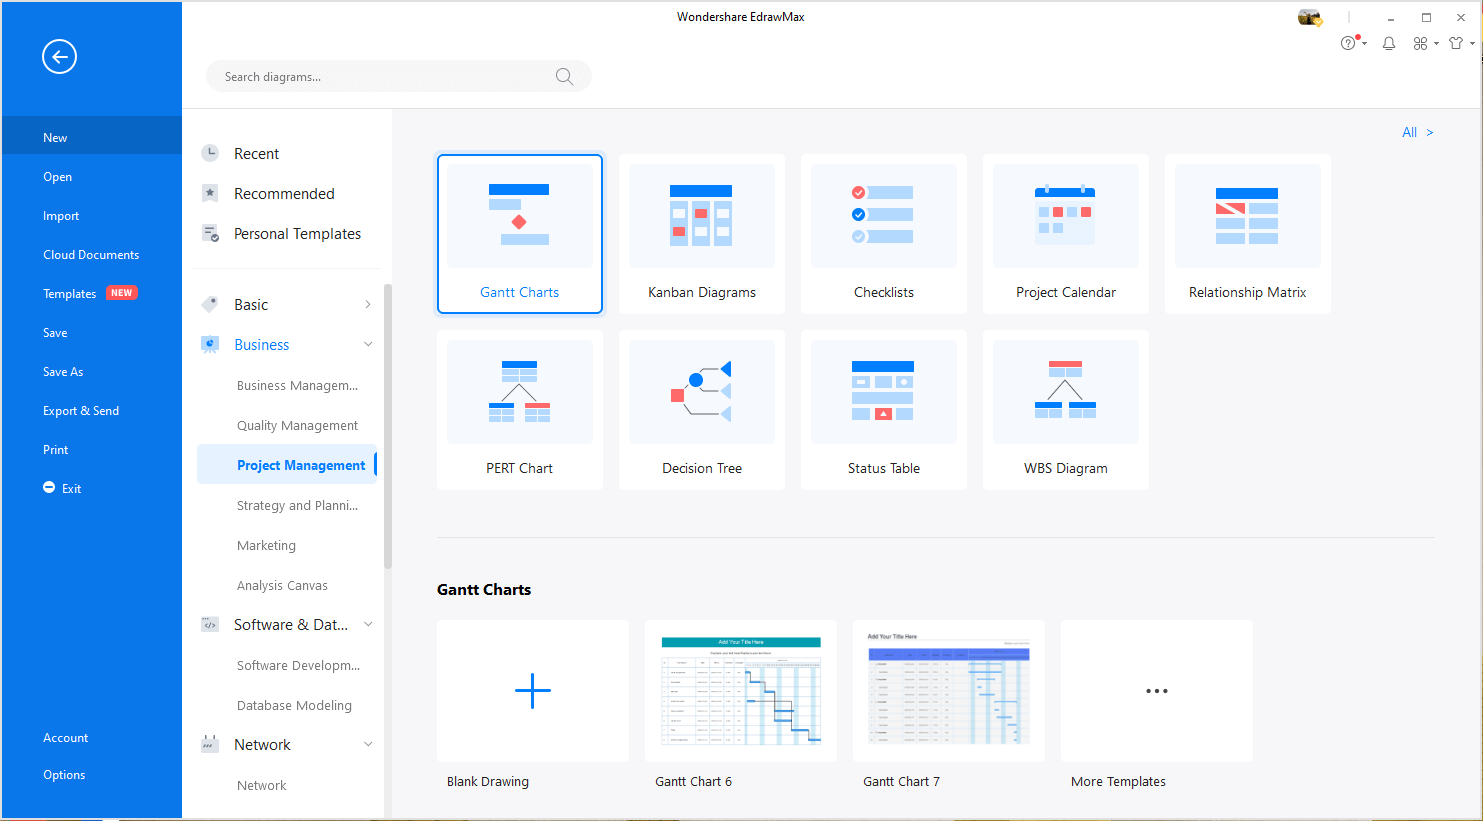
Double-click the icon of Gantt Chart. Or, you can choose to open a Gantt chart template to save your time of building the chart from scratch.
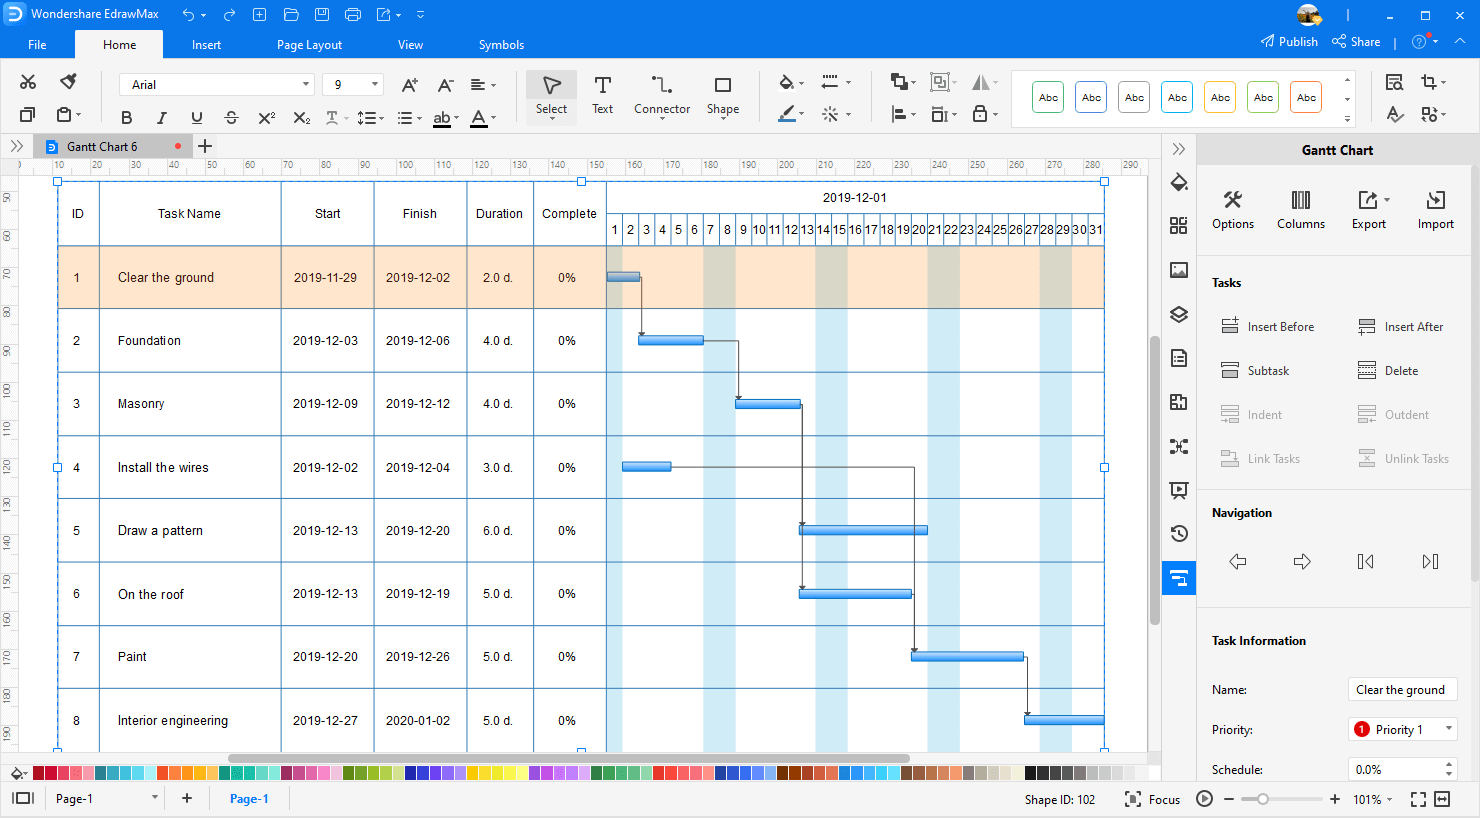
Step2Add Gantt Chart Data Options
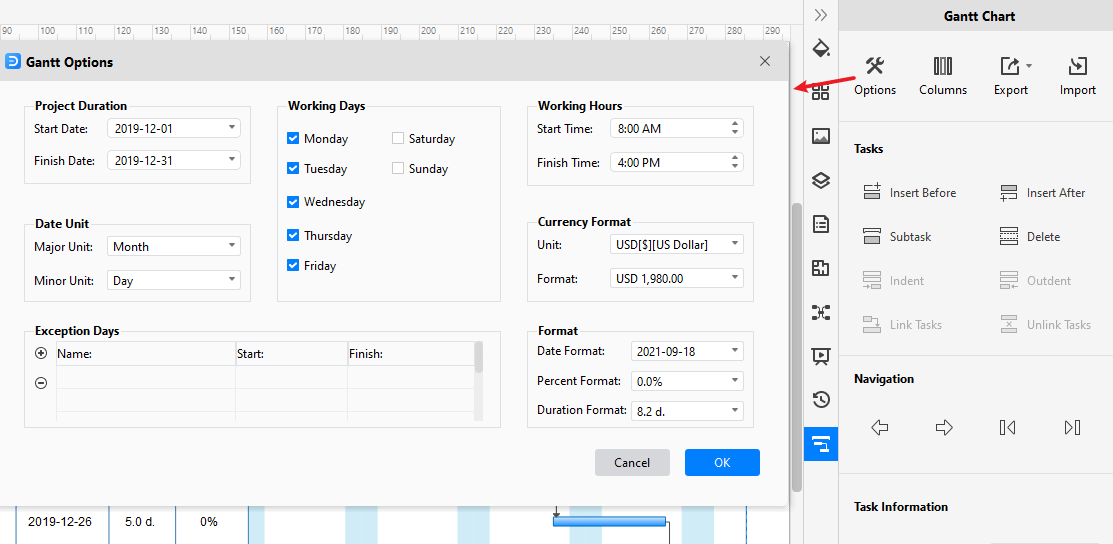
Select any task of the Gantt chart, you'll see the [Gantt Chart] pane on the right side of the canvas. Click on [Options], then a dialogue box pops up. You can set Gantt chart data in this dialogue box, including date format, start and finish date.
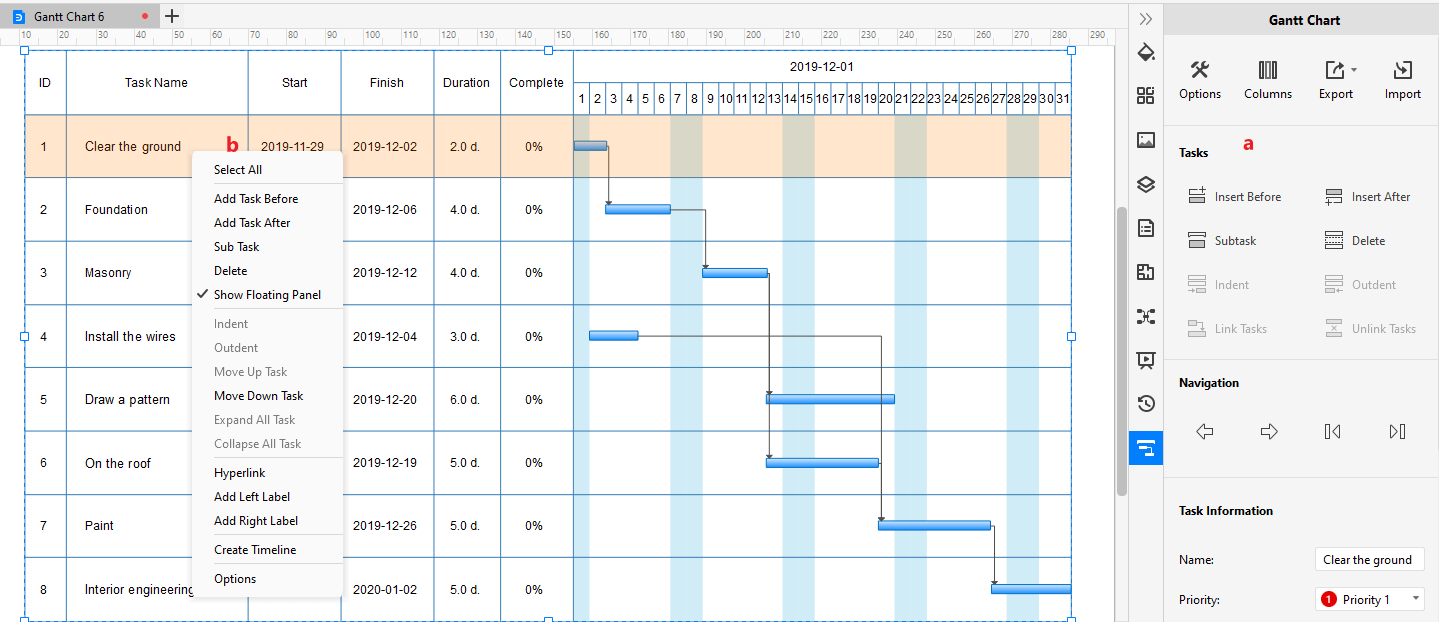
Step3Edit the Gantt Chart
Right-click on the task or just select the task, you will see many options for editing the Gantt chart on the menu and the pane. You can add/delete tasks, nagivate the whole chart and add task information for individual tasks.
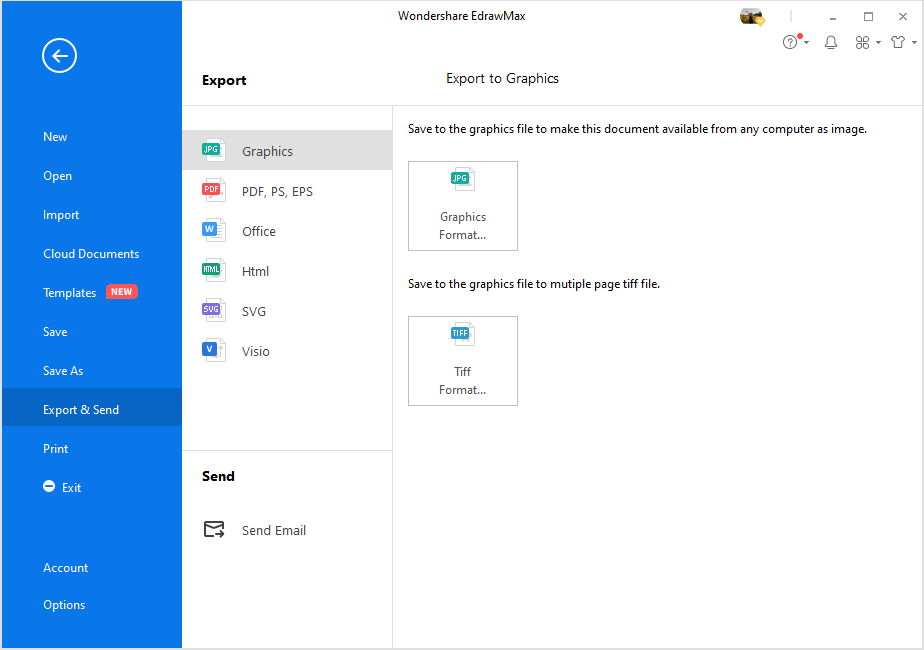
Step4Save and Export the Gantt Chart
After creating the Gantt chart, you can save and export the Gantt chart in a number of file types, including PDF, PNG, JPEG, PDF, DOCX, XLSX, PPTX, and VSDX for Visio. Thus, even non-Edraw users can read and edit your Gantt charts.
In fact, EdrawMax also supports our users to import the project data that is stored in Excel files and generate their own Gantt charts in minutes. You can watch the video below and learn more details!
Use EdrawMax for Gantt Chart Creation
The Gantt chart is an important project management tool. Without this, the project managers and team cannot see any way to make the project complete. It is vital to make a Gantt chart with efficient tools. Always select the tool that contains all the bits and bytes necessary to make a perfect Gantt chart and that's why we have given you the overview of EdrawMax above.
You can use EdrawMax for Gantt chart creation. The software is a web-based and desktop-based application that is well-known in diagram-making. Edrawmax contains all the tools and functionalities that are necessary to make a perfect Gantt chart. It allows you to use their dozens of pre-generated templates that were specifically made to make out work faster. The software also allows you to import your project to make customizations on it.
According to the developers, they have pinned five thousand plus diagram-making symbols that will suffice you in your diagram-making. The software makes you make diagrams by the drag-and-drop methodology. You can take help from the software's pre-made libraries.
EdrawMax is the versatile diagram software that integrates 100% functionality and libraries of all other drawing products.