How to Make an Infographic in Minutes?
Part 1: What is Infographic?
Infographics are used to visually represent information or data in a graphic manner. Text can be used, but is generally kept to a minimum. A popular form of visual communication, they are commonly used in social media to quickly draw attention to a piece of information.

By using attractive imagery and visuals, infographics are the perfect way to quickly convey information. Unique infographics often help people to retain information better. Thus, those on social media often use this for branding purposes, or to raise awareness about a certain issue. They can also be used in business and education to summarise complex ideas.
Part 2: How to Make an Infographic Effortlessly?
This section will tell you how to make infographics perfect and complete in just seven steps. These seven steps below look simple, but they are important to make your infographic stand out under the hood.
Know your audience
The first and most major step of making an infographic is knowing your audience to deliver your points in this chart. Knowing the audience is an important aspect of having successful and productive communication.
The identity to whom you will deliver this infographic is the audience resides inside the premises or belongs to an external world. If the audience is inside the organization, you know your firm's culture already, but if the audience is outside the firm, you have to do a lot of hard work to know them.
You would broadcast your infographic on the internet. You have to set your tone and infographic according to the protocols of social media users.
Identify your goals
The second step in making a perfect infographic is to identify your goals. You have to know what you want to achieve through this infographic. Do you want to teach or guide, or do you want to entertain, or do you want to show the survey statistics?

These things help you in planning how you will make your infographic. You will easily select the template, fonts, graphics, message tone, etc.
For example, if you want to spread awareness, you will make your infographic according to it. You will show the causes, damages, predictions, etc., related to the subject you want to spread awareness about.
Gather the data and information
The very important step to fill your purpose is to gather all the information and data you want to deliver. Always ensure that your data or information is correct and not falsely propagated.
Take the information from the most reliable sources, go through the books that are stamped good by others, go through the social media or internet sites that are very popular in their true messages.
Your data and information should be similar to your title. Always take your data for your infographics from those sources whose obligation is equivalent to the topic of your infographics.
For example, for the topic of climate change infographics, you will take data from satellites, weather forecasting sites, etc.
Identify the type of infographic you want to make
Now, identify the type of infographic you are going to make. Then, according to the type of infographic, make your infographic. There are hundreds of types of infographic topics. Some of them are listed below.
- Process infographics
- Comparison infographics
- Timeline infographics
- Informational infographics
- List infographics
There are more, but you have to identify your area from all those. If you want to show how something is made industrially, then your topic is process infographics, and you will select the tone and visuals according to it. If you need to compare something, you will identify your infographics in comparison or timeline and work according to it.
Insert data in the infographics
After gathering the data, insert it on your infographic by making the Copywrite and creating a textual outline. The best practice while making an infographic is to write small and concise paragraphs rather than large ones.

Modify the infographic template
Now comes the modification and grooming part. In this part, you have to set the theme of your template relevant to the topic of your infographics. You can take templates from any internet site.
For example, if you make an infographic to raise awareness about sea pollution, your template and other colors will be blue with marine life as its background.
Add more graphics as you can, try to elaborate the points in graphs, numbers, and figures as humans get them quickly. If your data is related, then insert your data in the hierarchical order.
Download, share, and embed infographics
After completing your infographics, review them again to remove the leftover and ignored mistakes. After the revision, you can share it or download it in any picture format.
You can also share your infographics on multiple social media sites like Facebook, Instagram, LinkedIn, etc.
You can also embed infographics in your website by going to "share," then ticking the box to make your infographic public and clicking "view embed code." This mechanism makes you paste a piece of code on the website.

An all-in-one platform for 210+ diagrams.
・ Simple alternative to Visio
・ 26k+ symbols
・ 10K+ free templates
・ 10+ AI diagram generators


Part 2: How to Make an Infographic Effortlessly?
How to make an infographic easily? Using EdrawMax to create your own infographic.
Step 1: Open EdrawMax desktop software or EdrawMax web-based application.
Step 2: Navigate to [Design]>[Infographic]
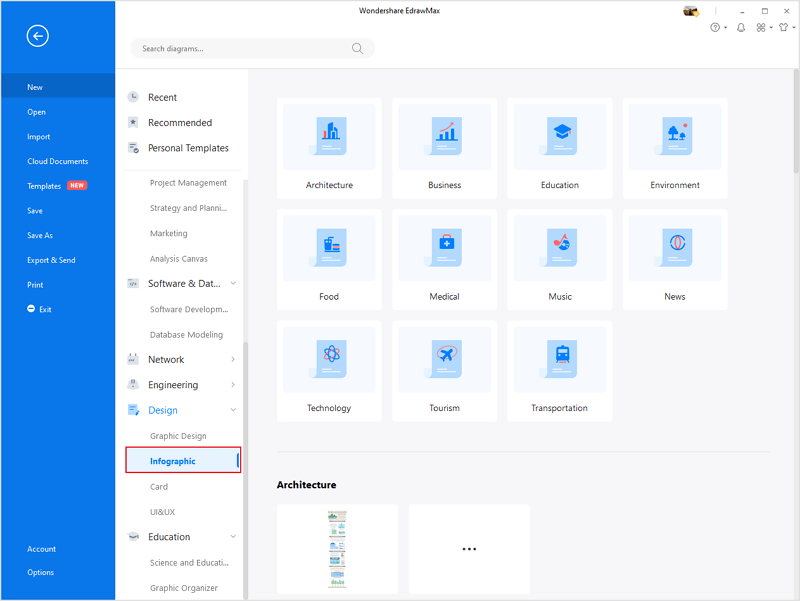
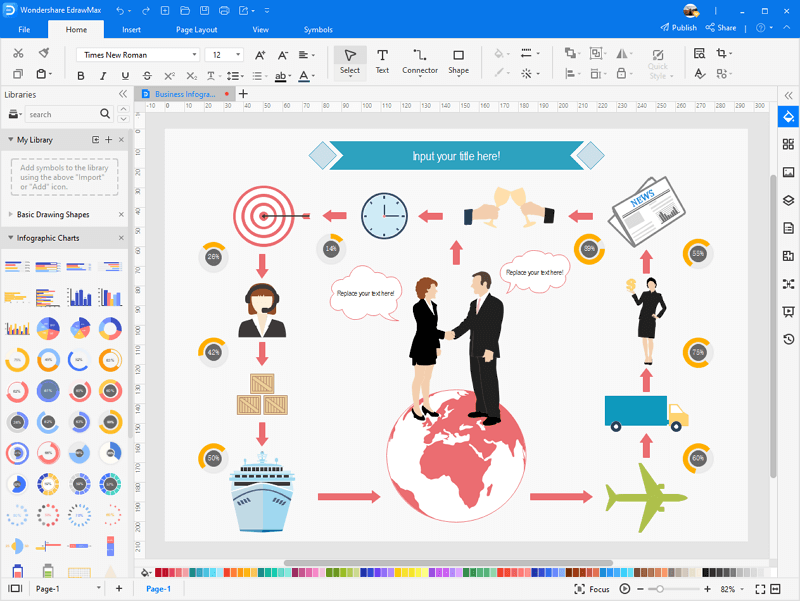
Step 3: Select one infographic template to edit on it or click the [+] sign to start from scratch. Also, you can use massive infographic symbols and elements from libraries in left menu to customize your infographic.
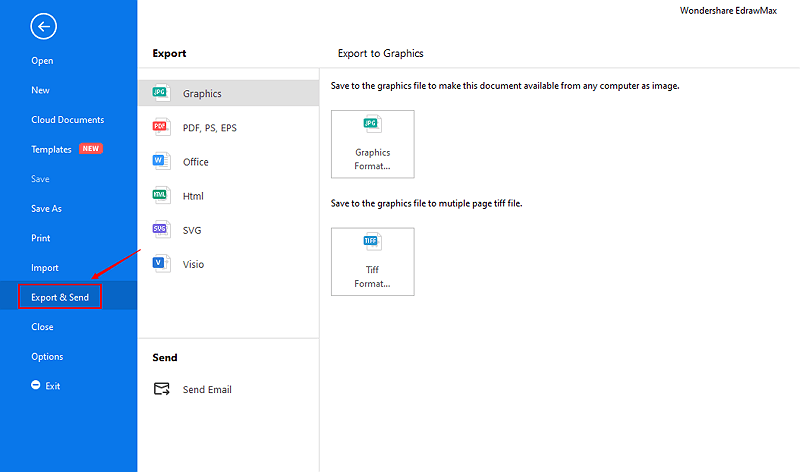
Step 4: Once finished your creation, you can export the file in multiple formats, including Graphics, PDF, editable MS Office file, SVG and Visio vsdx file.
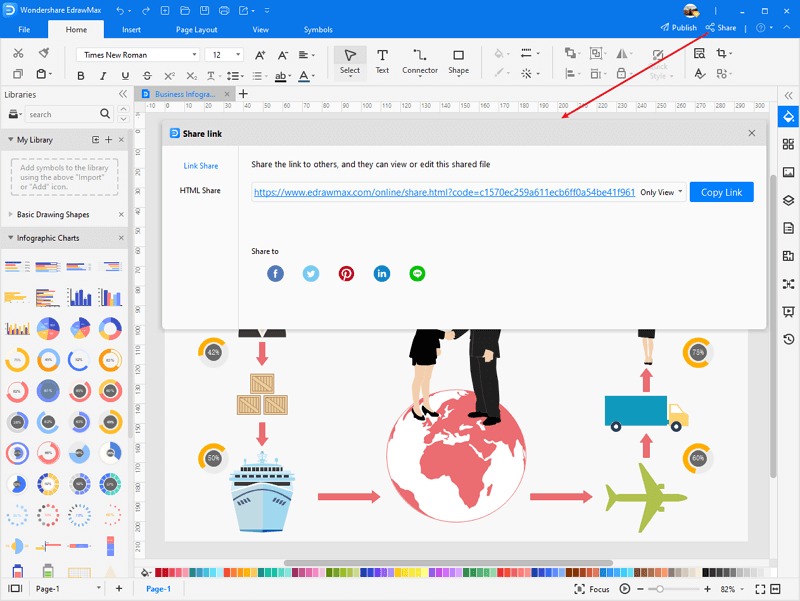
Step 5: Besides, you can share your diagram with others via social media and web page. Or publish your diagram in EdrawMax template gallery to show your work with others.
Part 3: Free Infographic Examples
All the below examples are free and editable within EdrawMax. Use these free infographics examples to get started quickly for creating various projects.
Example 1: Green Flowchart Infographic
Example 2: No Late Nights Infographic

Visit Infographic Template Gallery >>
Part 4: Key Takeaways
Let's go through the steps again for making a perfect infographic.
- Start by knowing your audience and setting your goals.
- Then get the data and information from reliable sources and insert them into your infographics.
- Modify and beautify your infographic template, and structure your data.
- And then, you can download and publish it.
According to this article, there are mainly three parts to illustrate what is infographic, to tell you how to create infographics and to show you some infographic examples. Generally speaking, an infographic gives an easy-to-understand overview of a topic with pictures, charts, and words.
For all of the above highly professional tasks, you can use a well-known application called EdrawMax. EdrawMax is an easiest all-in-one diagramming tool for creating 280+ types of diagrams. You can create infographics and any other type diagrams with ease! With substantial infographic symbols and cliparts, making infographics could be as simple as possible. Also, it supports to export your work in multiple formats and share your work with others. Get started to create your infographics now!

