Edraw Support Center
Get quick answers and step-by-step instructions in our support center.
Create a Gantt Chart in Edraw
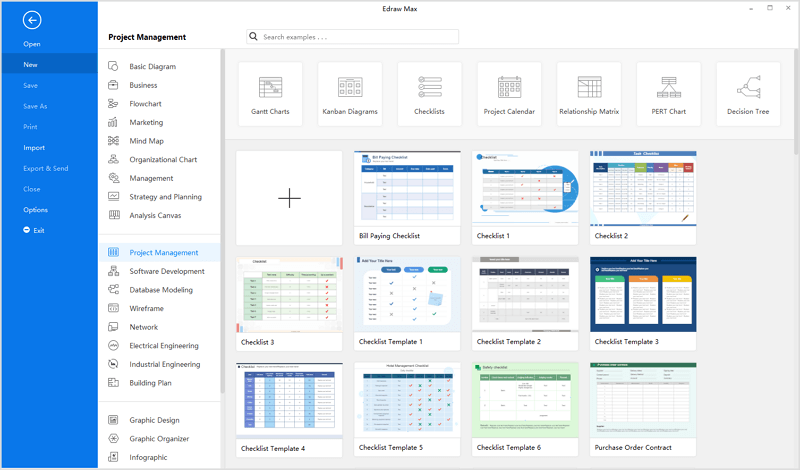
Open Edraw Max and find the pre-designed Gantt chart templates in the template gallery. Choose a template that you like, click on its thumbnail to preview the template in the workspace.
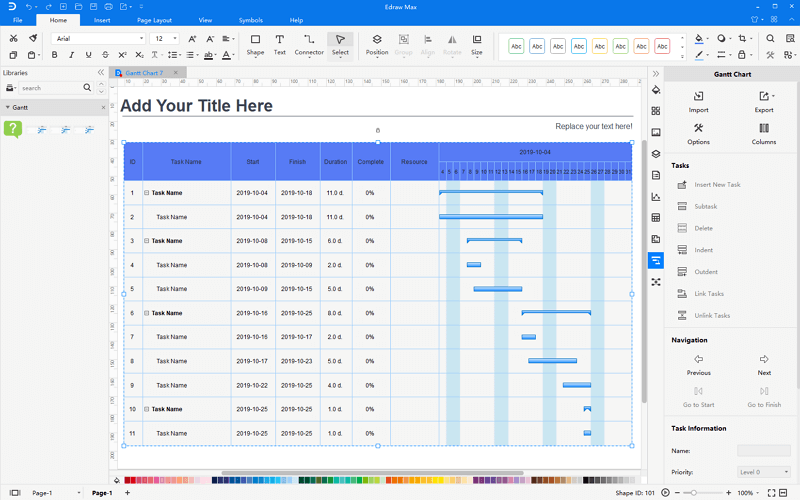
After the selected template is open in Edraw, you can use intuitive editing tools to make your own Gantt chart.
Alternatively, you can build a Gantt chart with the built-in Gantt shape. Open a document of Edraw, find the library of Gantt Chart, drag a Gantt chart from the library, and the Gantt Options window pops up. You can set various data formats for your Gantt chart.
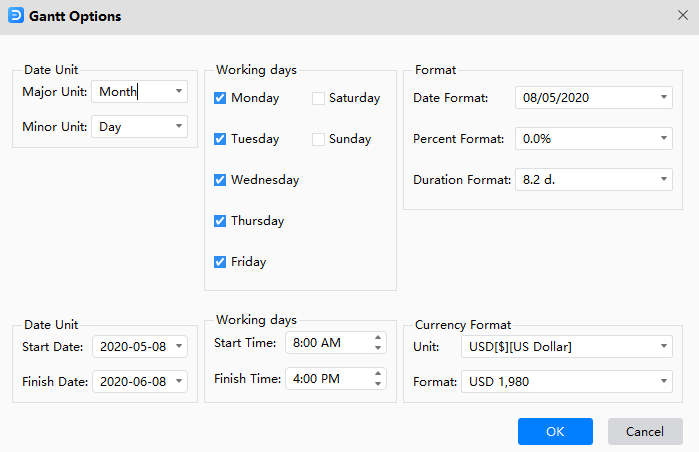
Note: Major Unit is the longer unit of time you want to use in the Gantt chart, and Minor Unit is the smaller unit of time, e.g. month/day.
When the basic Gantt chart appears on the canvas, select a task on the Gantt chart, and you will see that most of the options are available on the right Gantt Chart pane. Then you can start to add or adjust tasks in the Gantt chart.
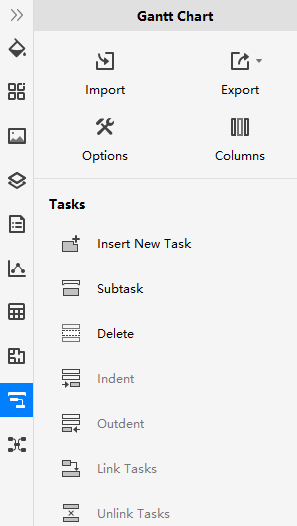
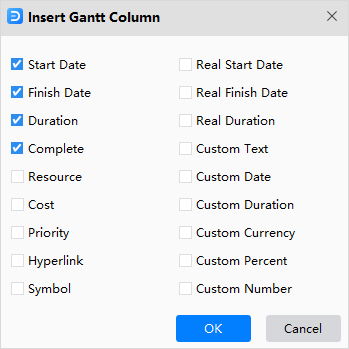
If you need to add new columns into the Gantt chart, you can right-click on an existing column and choose Insert Column on the context menu; or, select the column and click Columns on Gantt Chart pane.
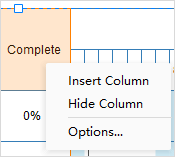
Then the Insert Gantt Column window pops up, you can choose to add any unchecked columns into the Gantt chart and all the new columns will be put on the right of the selected column.