EdrawProj User Guide
Create a Gantt Chart in 5 Steps
EdrawProj is a powerful project management tool with a user-friendly interface that allows users to create Gantt charts with simply mouse clicking. The software enables project managers to make schedules, allocate resources, track progress, manage budgets and analyze resource status and allocation for ongoing projects.
EdrawProj helps users schedule and manage projects. It gives an overall picture of project hierarchy and task reporting relationships so that managers could get insight for budget planning and resources allocation. The Reports options of Edraw Project allows users to generate a variety of reports from specific perspectives to analyze the project or share with others.
With EdrawProj, you can master the current progress through the timeline and multi-angle reports so that you can give appropriate solutions to different problems more quickly.
Configuration & Help of EdrawProj
System Requirements
- Windows 2000, XP, Vista, Windows 7, Windows 8 and Windows 10
- Mac OS X 10 and later
- Linux (Debian, Ubuntu, Fedora, CentOS, OpenSUSE, Mint, Knoppix, RedHat, Gentoo and More)
- At least 1 GB RAM
- At least 400 MB free disk space
User Installation
You can download MindMaster installation package from our Download Center.
User Activation
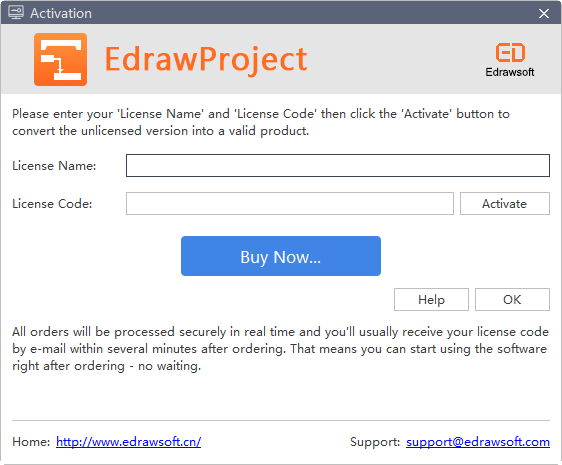
Once successfully installed, you can register the software with your license code to activate it. If you do not have a license code, you can click Buy Now to place an order.
- Run EdrawProj software with computer administrator privilege.
- Click the Help tab of the ribbon.
- Click Activation under the Help tab.
- Input your License Name (can be any name) and License Code.
- Click Activate to run the Activation Wizard.
User Deactivation
Deactivation is necessary if you wish to format computer, re-install computer operating system or move EdrawProj from one computer to the other. Please note that deactivation can only be done once every 30 days. The steps to deactivate a license are:
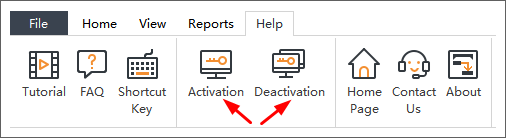
- Simply go to the Help tab, and click Deactivation.
- Once you have clicked Deactivation, EdrawProj software on your current computer will turn to unlicensed version, so you can activate the software on another device.
Check for Updates
You can click the About button in the Help tab to get the information about the current version.
For Assistance
If you have further problems, please contact support@edrawsoft.com.
Toolbar/Ribbon
The interface shows the initial and overall window where you can create Gantt Charts. Here you can see the Quick Access Toolbar, Tabs, Ribbon and Right Side Panel.
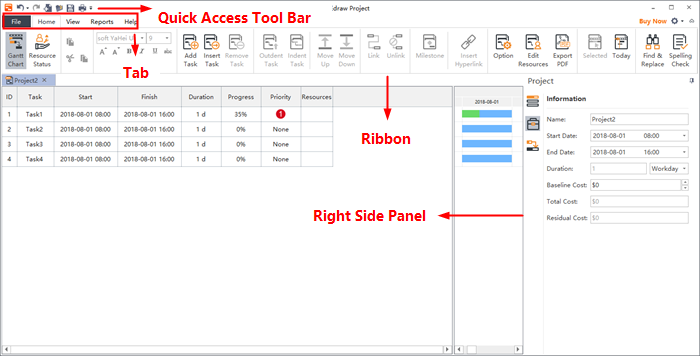
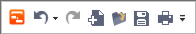
Quick Access Toolbar
From the Quick Access Toolbar you can find quick tools for Undo/Redo, Create a New Gantt Chart, Open Files, Save, and Print. You can hide or add any of these buttons by clicking the mini Down Arrow on the right. You can also choose to place the Quick Access Toolbar below or above the Ribbon.
Ribbons
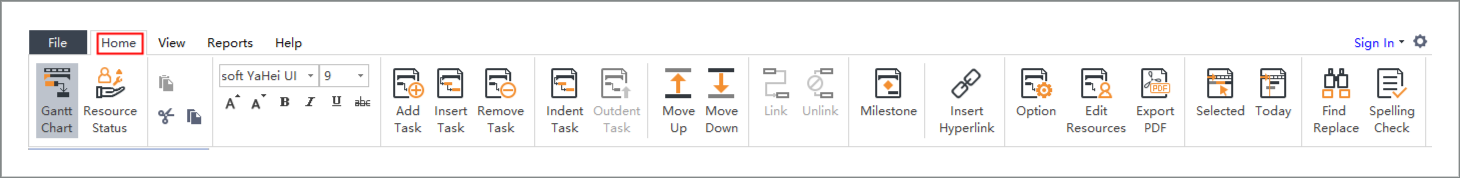
- Home Tab
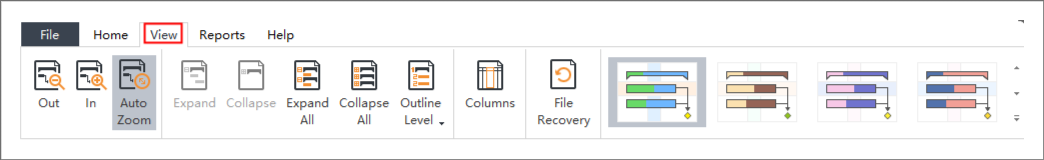
- View
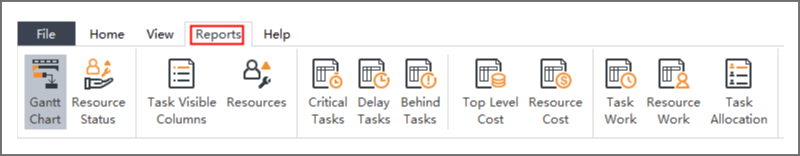
- Reports
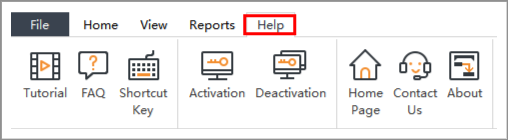
- Help
In the Home tab, you can add, insert, remove, indent, outdent, move up and down tasks; set milestones; link and unlink selected tasks; insert hyperlinks and set overall Gantt Chart options.
The View tab shows different view options for Gantt charts. You can apply a theme, zoom in or out the chart, expand or collapse subordinate tasks.
EdrawProj comes with a set of predefined reports. You'll find all of these on the Reports tab, including Resource Status, Critical Tasks, Resource Cost, Resource Work and Task Allocation, etc. However, these reports are not customizable.
From the Help tab you can easily find related guides for reference, including Tutorial, FAQ, Shortcut Key, Contact Us, Activation and Deactivation.
Right Side Panel
The Right Side Panel consists of three tabs in total: Task , Project
 and Link
 .
.
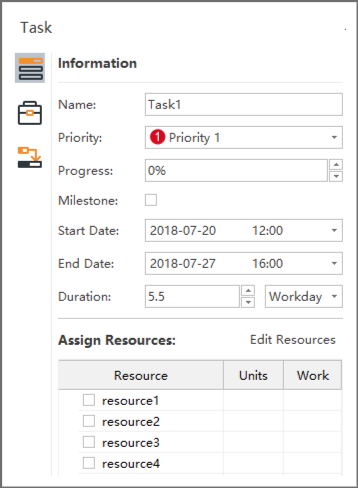
- Task
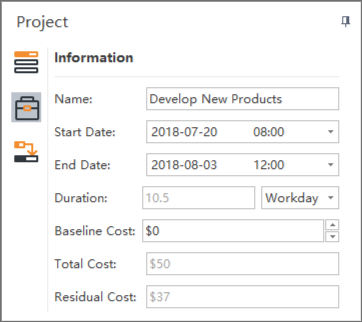
- Project
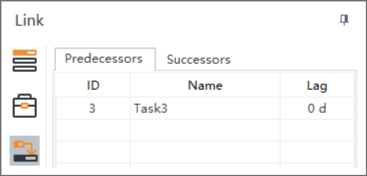
- Link
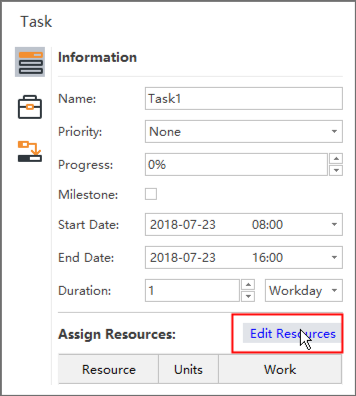
In the Task Information section, you can view and adjust the overall information of a selected task such as task name, priority, progress, start and end date etc.
In the Assign Resources section, you can edit resources information and assign resources to a selected task.
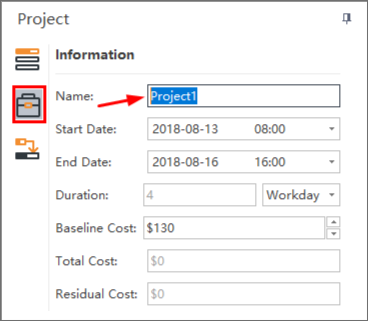
In Project Information section, you can quickly go through the basic information of your current project, including the project name, start and end date, duration, baseline cost, total cost and residual cost.
In the Link section, you can create relationships between tasks. The "relationship" is also called "dependency", that is "the start of a task is dependent upon the compeytion of a prior task". For example, only when Task 1 is finished can you start Task 2. In this case, Task 1 is a Predecessor of Task 2, and Task 2 is a Successor of Task 1.
Work with EdrawProj
Start a Project
You have two options to start a Gantt chart:
Option A: Click the button of File tab, and then click New to start from a blank chart.
Option B: Click the New icon in the Quick Access Tool Bar to start your project.
Project Setup
Once new project is created, the priority is to set the project options, such as the start and end date, date format, working days, etc.
- Click the Working Time button
 on the Home tab to open the below window.
 - Define the following project options on the dialog to schedule your project.
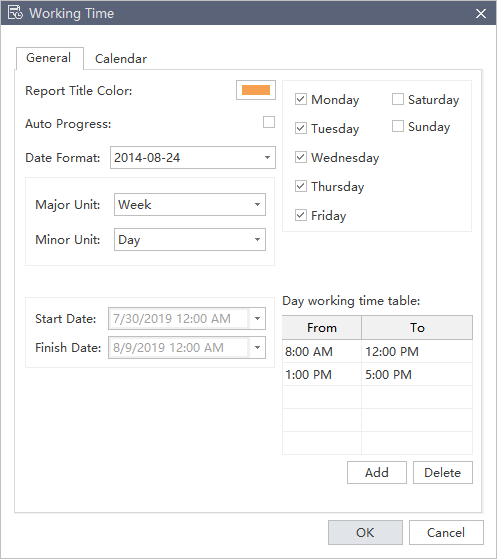
- Report Title Color
- Auto Progress
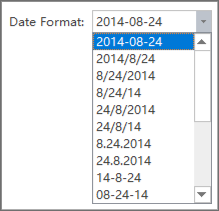
- Date Format
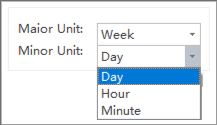
- Major / Minor Unit
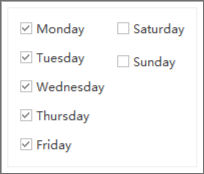
- Set Workday
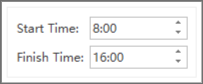
- Set Workday Start / Finish Time
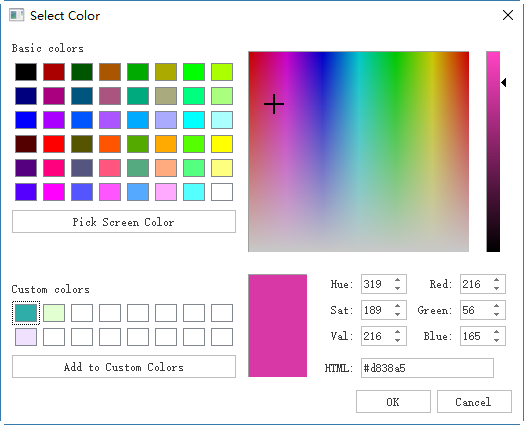
It refers to the color of a report title that displayed on the Reports tab. The predefined color is orange.
You can customize the color in the Select Color window.
After a task begins, you can track the task progress with a progress bar showing the completion percentage upon the task bar. Usually you can record the completion percentage manually by using the mouse. If the Auto Progress option is checked, the progress bar will be updated automatically each day.
This option determines the format of date in your project.
Click the small triangle button and drag the scroll bar to select the date format you prefer.
It refers to the major and minor time units displayed in the right pane. The predefined Major Unit is Week, and Minor Unit is Day.
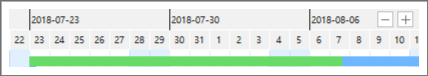
Click the small triangle button and drag the scroll bar to select the format you prefer for Major Unit and Minor Unit.
Check the corresponding square to set workdays, and the unchecked ones are non-work days.
Type the certain time or click the up & down triangle buttons to adjust the start and finish time of a workday. The default Start Time of a workday is 8:00, and the Finish Time is 16:00.
Name a Project
To name a project, you can go to the right sidebar and click Project button, and enter a project name in the Name option.
Add/Insert/Name/Remove a Task
Add a Task
(Enter)
The newly added task is in the same level as the last one and will be placed at the end of the current task list.
There are three ways to add a task:
- Press Enter key on the keyboard.
- Click the Add Task button
 on the Home tab.
 - Right click on any place of the Gantt chart and choose Add Task in the context menu.
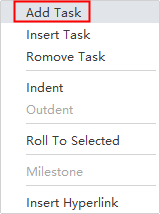
Insert a Task
(Enter)
The newly inserted task is in the same level as the selected task and will be placed above it.
There are 3 ways to insert a task.
- Select a task, then press Insert key on the keyboard.
- Select a task, then click the Insert Task button
 on the Home tab.
 - Select a task, then right click on any place of the Gantt chart and choose Insert Task in the context menu.
Name a Task
(Enter)
An explicit and concise task name is necessary for others to understand at a glance. You can use short verb phrases to name a task.
Click the task cell directly to name the task.
Remove a Task
To remove a selected task, you can:
- Select a task, then press Delete on the keyboard.
- Select a box, then click the Remove Task button
 on Home tab.
 - Select a task, then right click on any place of the Gantt chart and choose Remove Task in the context menu.
Notes:
If no tasks are selected, the task at the end of the tasks list will be removed.
Indent & Outdent Tasks
Tasks are usually grouped into larger phases. Use the Indent button  to subordinate a task, thereby making the dominant item into a phase with subordinate tasks. To indent a task means to turn a task to a sub task of the above task. To outdent a task means to turn a sub task to a summary task.
Indent a Task
(Tab; Ctrl + Right Arrow)
If you want to indent a task, there are three ways:
- Select a task, then press Tab or Ctrl + Right Arrow on the keyboard.
- Select a task, then click the Indent Task button
 on Home tab.
 - Select a task, then right click and choose Indent Task in the context menu.
Outdent a Task
(Shift + Tab; Ctrl + Left Arrow)
If you want to outdent a task, there are three ways:
- Select a task, then press Shift + Tab or Ctrl + Left Arrow on the keyboard.
- Select a task, then click the Outdent Task button
 on the Home tab.
 - Select a task, then right click and choose Outdent Task in the context menu.
Notes: Top level tasks cannot be outdented. When a top level task is selected, the Outdent Task option turns gray and unselectable.
Move Up & Down a Task
If you need to change the display order of tasks in the tasks list, you can click the Move Up or Move Down button
 on the Home Tab.
Link & Unlink Tasks
Links are also known as dependencies. It means one task relies on one or more tasks to be performed before it can be done. For example, Task 1 must be completed before Task 2 can begin. In this case, Task 1 is called a Predecessor as it precedes tasks that depend on it. The following task, Task 2, is called a Successor as it succeeds or follows tasks on which it is dependent.
To build such a relationship, you have 2 options:
- Use Mouse Click
- Use the Link Buttons on the Home Tab
- Select two or more tasks on the list of the Gantt chart.
- Click the Link button
 on the Home tab.
 - To unlink the sequence or relationship between tasks, click the Unlink button
 on the Home tab.
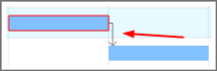
Click on a task bar (The Predecessor), then hold the mouse and drag it to another task bar (The Successor) to build a relationship.
To check whether a task has Predecessors or Successors, you can:
- Go to the Right Side Panel, click Link icon
 to open Link panel.
 - Switch between Predecessors and Successors sheets to view, add or remove corresponding links.
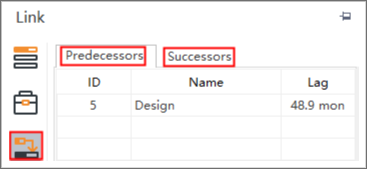
Notes:
- Editing the duration of linked tasks will automatically adjust their position on the timeline of the Gantt chart.
- Any task can be a predecessor for one or more successor tasks. Likewise, any task can be a successor to one or more predecessor tasks.
Milestone
In project management, milestones are specific reference points that mark major events in a project timeline. To achieve project success and meet stakeholders' expectation, milestones are used as major progress points. A Milestone task does not have a duration in the timeline, and it can be placed where there is a logical conclusion of the phase of work, or at the deadline imposed by the project plan.
There are two options to set a task as a Milestone:
- Click to select the task which you want to set as a Milestone.
- Do one of the following:
- Click Milestone button
 on the Home tab.
 - Go the Right Side Panel and check Milestone in Information section of Task panel.
- Click Milestone button
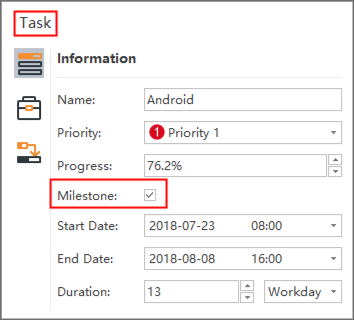
Note: After you’ve set a task as a Milestone, you can see the Milestone appear as a small rhombus on the timeline in the Gantt Chart View.
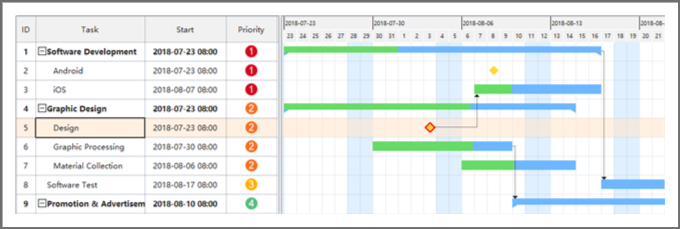
Modify Task Info in Gantt Chart View
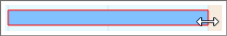
Each task is presented as a taskbar in timeline of the Gantt Chart. You can move or drag a taskbar to change its start and end date. You can also build task dependency in the Gantt Chart view.
- Rename a Task
- Change Task Start and End Date
- Change Task Complete %
- Build a Task Dependency
- Change the Date Unit
Click the box in the Task Name column to rename the task.
Drag the right border of the bar to change the bar length. You can also select and move the whole bar to change its position on the calendar.
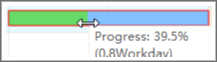
Put the cursor on the left border of the taskbar, then hold the mouse and drag to the right direction until a green area has shown up. The green area indicates how much the task has been completed.
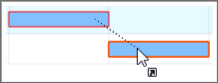
Click on a taskbar, then hold the mouse and drag it to another taskbar to build a relationship.
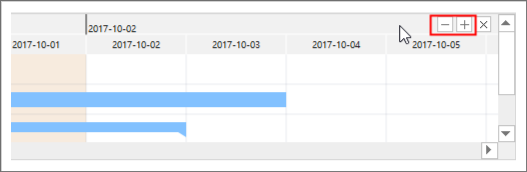
Click the and
and button in the top right corner to change the date unit.
Insert a Hyperlink to a Task
(Ctrl + K)
Hyperlinks are convenient for users to view other documents, files or websites in Gantt Charts, including current documents, files, applications, internet addresses, and folders.
The hyperlinks can link to any of the following:
- Another task in the current document
- A file or application
- A folder
- A Web URL
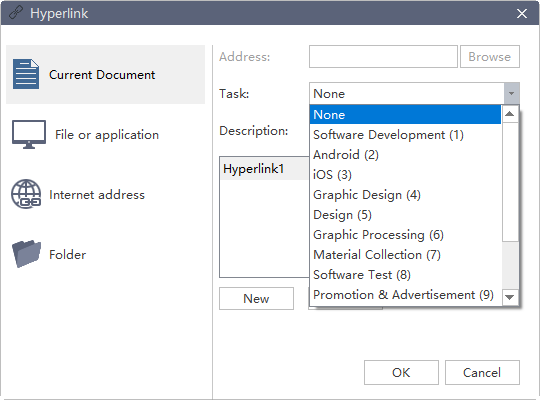
Add a Hyperlink to a Task in Current Document
- Select a task you want to add hyperlink to.
- Click Insert Hyperlink button
 on the Home tab, or Right-click the task and choose Insert Hyperlink option.
 - Select Current Document.
- To link to a specific task, you can choose the task ID from the task list.
- Click New to add more hyperlinks.
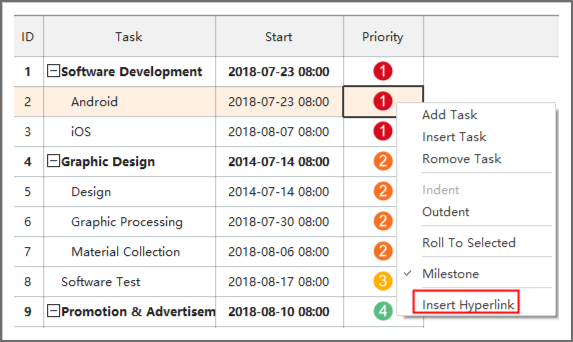
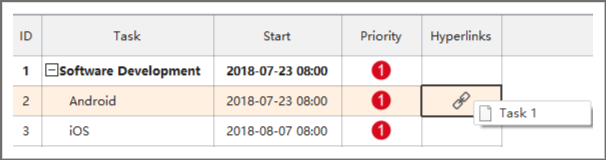
Note: If a hyperlink is added to a task, the Hyperlinks column will appear automatically. The hyperlink description will also appear if you hover the mouse on the hyperlink icon.
Add a Hyperlink to a Web URL
- In the Type list, choose Internet Address.
- In the Address box, type the address of a Website, FTP site, or e-mail address (beginning with http://, ftp://, or mailto: respectively).
- In the Description box, type a name for the link. This text will appear on the hyperlink icon.
- Click New to add another hyperlink.
- Click OK
Add a Hyperlink to File or Application
- In the Type list, choose the File or Application.
- Click Browse and navigate to a file.
- In the Description box, type a name for the link. This text will appear on the hyperlink icon.
- Click OK.
Change or Delete a Hyperlink
- Select the task to change or delete a hyperlink of a task.
- Click Hyperlink.
- To change a hyperlink, select the hyperlink in the hyperlink list, make the changes that you want, and then click OK.
- To delete a hyperlink, select the hyperlink that you want to delete
- Click Hyperlink icon on the Home tab, select the hyperlink in the hyperlink list, click Delete in the Hyperlink dialog.
- Press Delete in the keyboard.
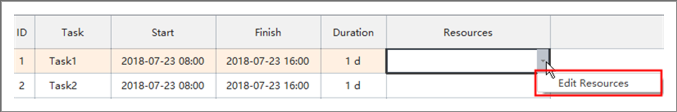
Open Resource Window
You have 3 ways to enter into the Resource window where you can set up and edit resources.
- Click Edit Resources icon
 on the Home tab.
 - Select any element in the task list. Go to Right Side Panel>Task>Assign Resources section, and click Edit Resources.
- In the Gantt Chart view, select a box in Resources column and click the small triangle button. The Edit Resources option will appear and then you click it.
Edit Resources
The Resource window is where you can set up and edit resources. You can adjust the width of each box by dragging the right border of it.
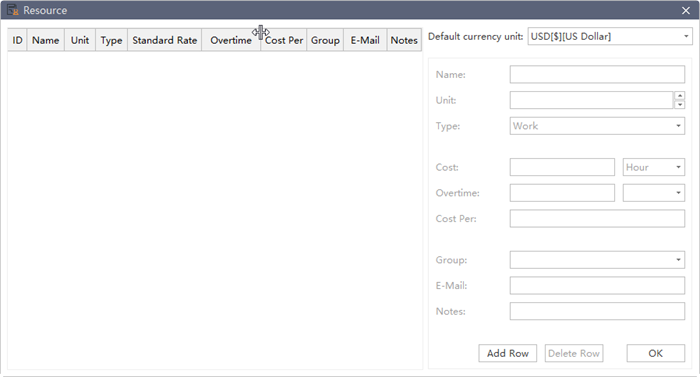
To add a new resource, you can:
- Click Add Row button.
- Press Enter on the keyboard.
After a resource is added, you need to define the following information of a resource in the Resource window.
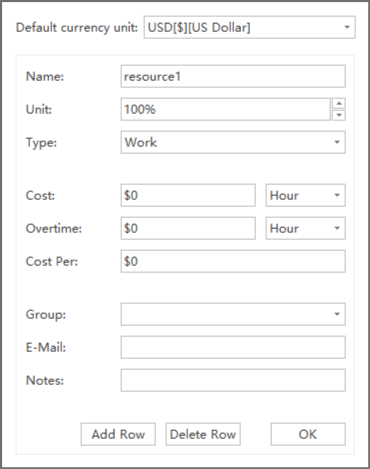
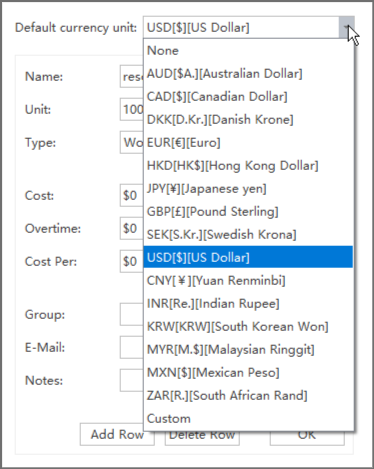
Default Currency Unit
The default currency unit is USD. To change or customize Currency Unit type, you can click the small triangle button and choose the target Currency Unit.
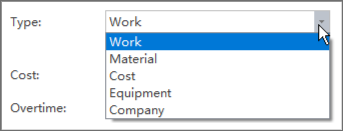
Resource Types
There are 5 types of Resources and they can be divided into two catalogue.
Work Resources: People to complete the tasks, usually with a cost over time.
Non-work Resources: Resources that have a fixed cost per unit, including:
- Material: Consumables materials used in project processes like papers which are used to print leaflets.
- Cost: Financial cost associated with a task, such as travel expenses, food expenses, etc.
- Equipment: Such as a printer.
- Company: Company as a unit to complete the tasks.
Resource Name
You can change resource names according to different categories.
| Resource | Example of Resource Name |
|---|---|
| Work resource as an identified person. | Cindy, Gwen |
| Work resource as a job function or group | Doctor, Engineer, Teacher |
| Work resource as an equipment | Truck, Water Pipe |
Resource Unit
Only when the resource type is Work Resource can you set the Resource Unit, including Max Unit and Unit.
Unit represents the maximum capacity of a work resource to work on assigned tasks. 100% means that the resource is available full-time on each workday. The work time is set in Project Options before you start adding tasks.
If the resource gets allocated to tasks that would require more than his work hours, then the resource is over allocated and EdrawProj will indicate this in red formatting in the Resource Status report.
If a resource is more capable and has higher efficiency than an average level resource whose Unit is 100%, you can enter larger Unit to represent his competence. A 200% Max Unit indicates that the resource does double work in the same working time.
By default, the Max Unit field is set to 100%.
Resource Cost
You can set Standard Rate and Cost Per Use for work and non-work resources. You can also enter Overtime Rate for work resources.
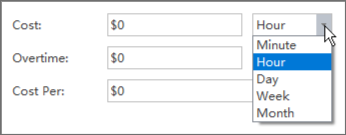
- Standard Rate: Calculated on time unit basis, such as per day, per hour, per week and per month.
- Cost Per Use: The cost that accrues every time when a resource is used. It will be added when a work resource unit is assigned to a task and does not vary with the amount of time you use the resource.
- Overtime Rate: The pay rate for the overtime work of a resource.
EdrawProj calculates the cost of a project by adding up the cost of resources allocated in all tasks.
Note: Cost Per of non-work resources is calculated only once.
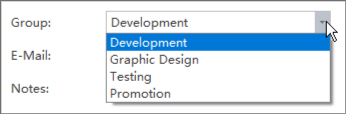
Divide Resources into Groups
Grouping enables you to view rolled-up summary information of resources allocated to a task. Once you have entered a new group, the group name will appear in the drop down menu.
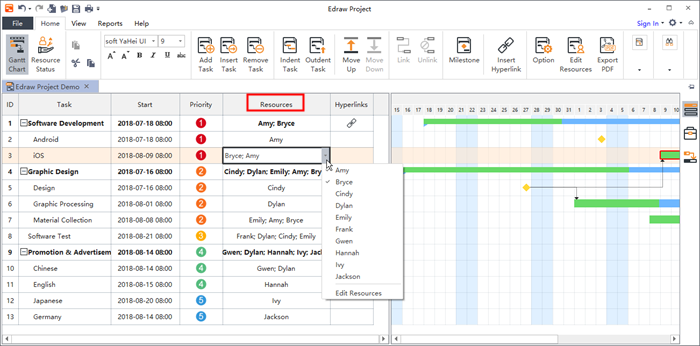
Assign Resources to Task
Once the tasks list and resources are complete, resources need to be assigned to tasks in order to carry out the tasks. EdrawProj supports to track task progress, resource status and task costs.
There are 2 ways to assign resources to a task.
You can assign resources to a task one by one:
- In Gantt Chart view, go to the Resources column.
- Click the box below the Resources column for the task you need the resource to be assigned.
- From the drop-down menu, choose the name of the resource you need.
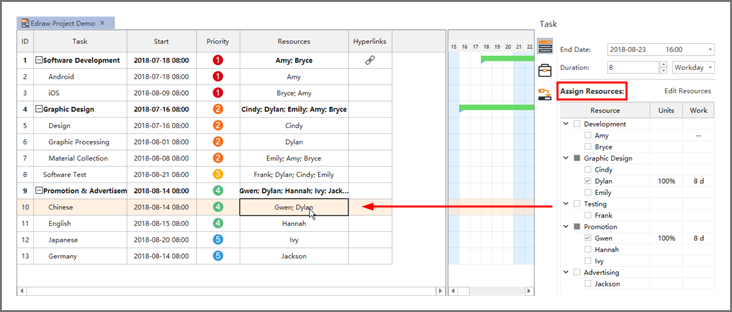
If you need to allocate multiple work resources to a task, you can:
- Select the task.
- Go to the Assign Resources section on right ride panel.
- Click the group name to allocate all resources in a group to the selected task.
Note: You can select multiple resources to work on a single task. A work resource can be assigned to multiple tasks.
Zoom & Apply a Theme
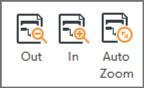
The zoom options are placed on the View tab. The zoom options allow you to change the project timescale. Use Zoom Out button to show larger time units, and Zoom In to show smaller time units. If you press the Auto Zoom button, it will present the optimal view (timescale) automatically for you.
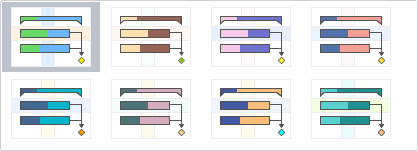
Apply a Theme
EdrawProj provides a variety of design themes to coordinate the colors of the taskbar and table. Using pre-designed themes makes it easy for you to change the overall look of your chart quickly.
Choose your preferred theme from the View tab of the ribbon.
Expand & Collapse & Columns
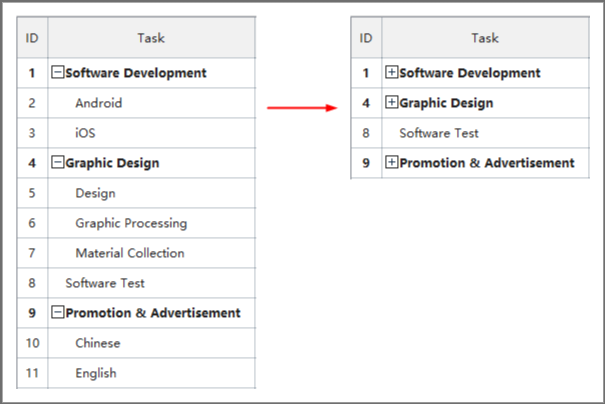
Expand and Collapse
The Expand and Collapse options are placed on the View tab.
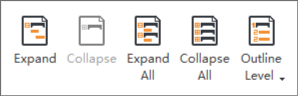
A project usually comprises multiple tasks that may be divided into several subordinates.
You can collapse and expand individual tasks that has subordinates (child tasks) interactively by using the and
and  icons that appear on the right of each task that has child tasks. This helps viewers focus on only mother tasks without being distracted by the subordinates.
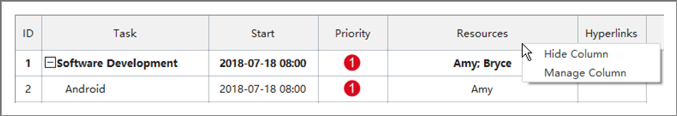
Columns
In the Manage Column window, you can choose to show or hide specific columns in the Gantt Chart. Check the columns you want to display, and the unchecked columns are hidden. You can adjust the display order by clicking Move Up and Move Down button on the right.
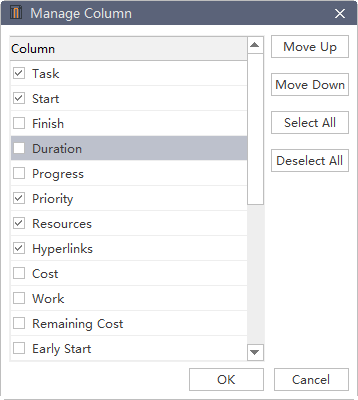
There are two approaches to open the Manage Column window:
- Click Columns button on the View tab.
- Right click the name box of the column you want to hide, and then click Manage Column on the context menu.
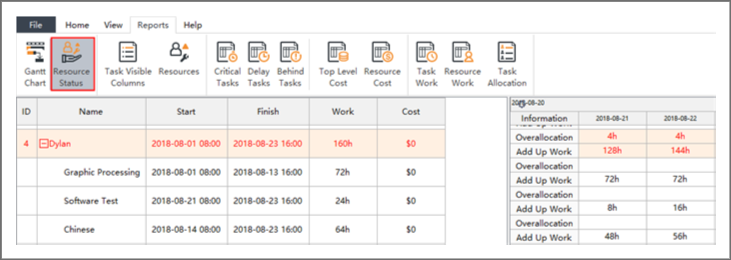
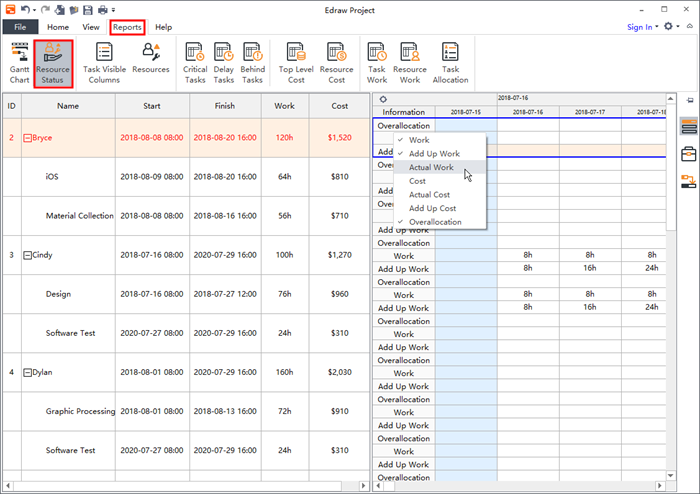
Resource Status
The Resource Status report displays resources and all tasks that are assigned to them under the resource names. The left side of the screen lists the Resources and Task names and the total information for the resource or assignment. The right side shows a time-phased view.
With the collapse button, you can also collapse the outline in the left-hand table to see total work of per resource over time.
Task Visible Columns/Resources
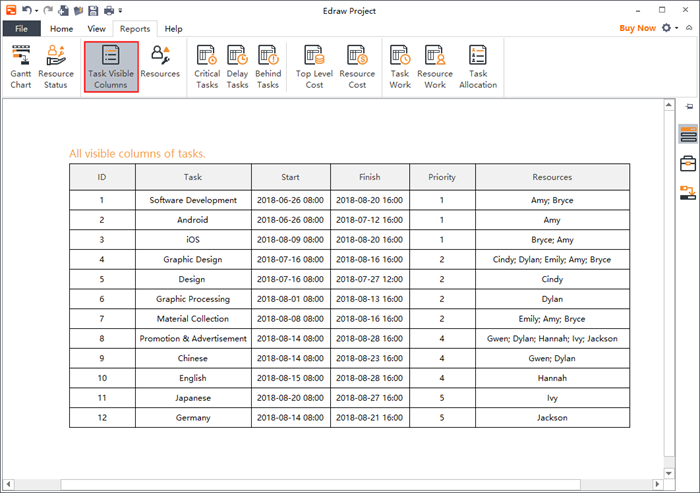
Task Visible Columns
The Task Visible Columns report displays all visible columns of tasks.
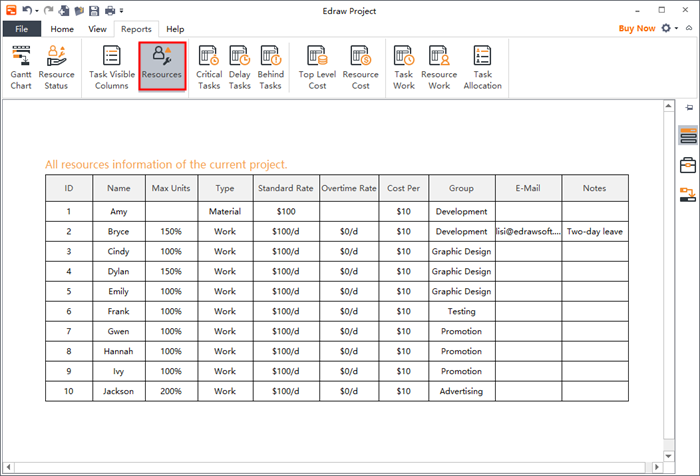
Resources
The Resources report displays detailed information of all resources filled in the Resource window for the current project.
Critical/Delay/Behind Tasks
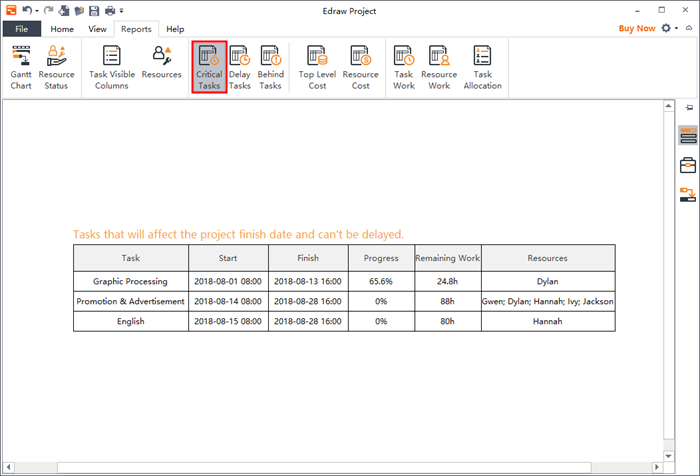
Critical Tasks
It has to be clear that the word "Critical" does not mean that the task is complex, important or need to be closed, monitored, but the focus is that the task will affect the project's finish date.
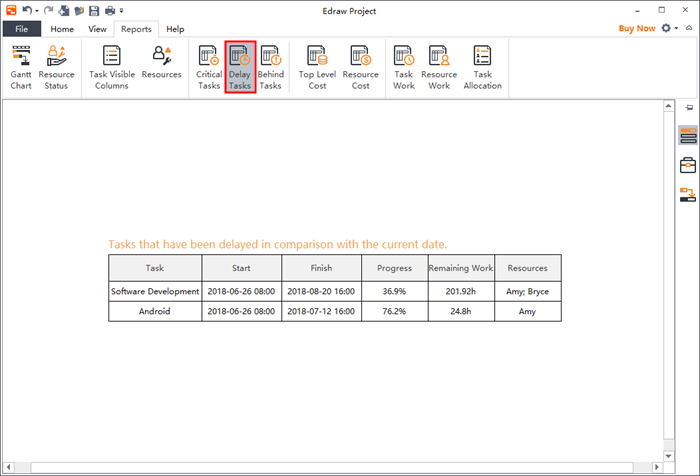
Delay Tasks
In the Delay Tasks report, tasks that have been delayed in comparison with the current date are displayed.
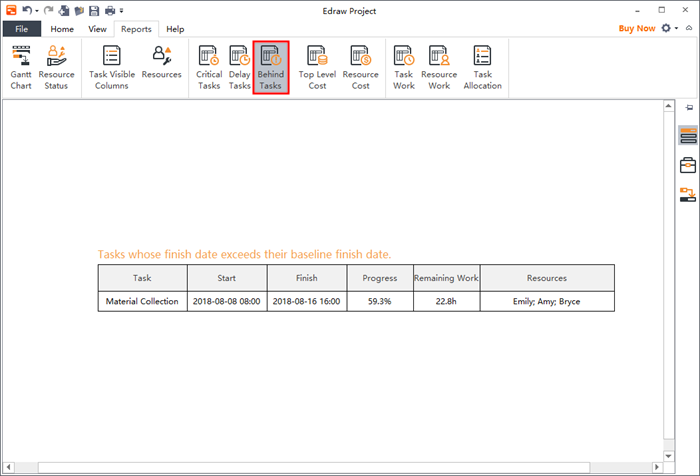
Behind Tasks
If a task’s completion date exceeds its baseline finish date, then it is a Behind Task.
Click the Behind Tasks button on the Reports tab to view the report of behind tasks in the project.
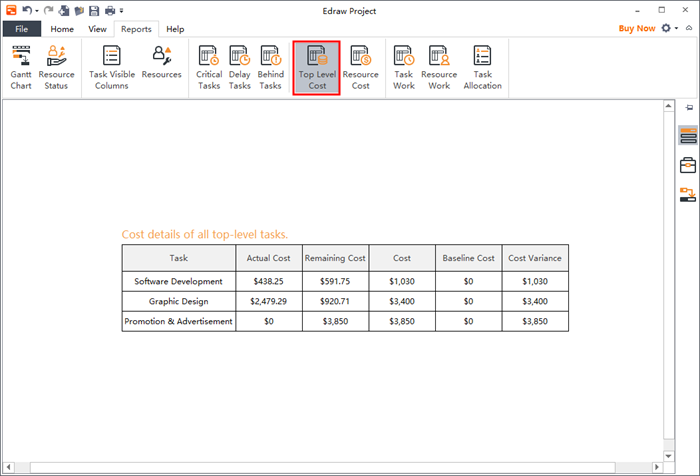
Top Level Cost
In the Top Level Cost report, types of cost in a project life cycle includes:
- Actual Cost: Costs that have been incurred for tasks, resources or assignments.
- Remaining Cost: Difference between baseline cost and actual cost.
- Cost: When the tasks are planned and the pay rates of resources in a project are settled, EdrawProj will calculate the scheduled cost of a task or a resource.
- Baseline Cost: Rough estimate cost proposed by the project manager.
- Cost Variance: Difference between the scheduled cost and baseline cost.
The following are formulas to calculate different types of cost:
- Actual Cost = (Cost - Cost Per Use) * Progress + Cost Per Use
- Remaining Cost = Cost - Actual Cost
- Actual Cost = Actual Work*Standard Rate*Cost Per Use
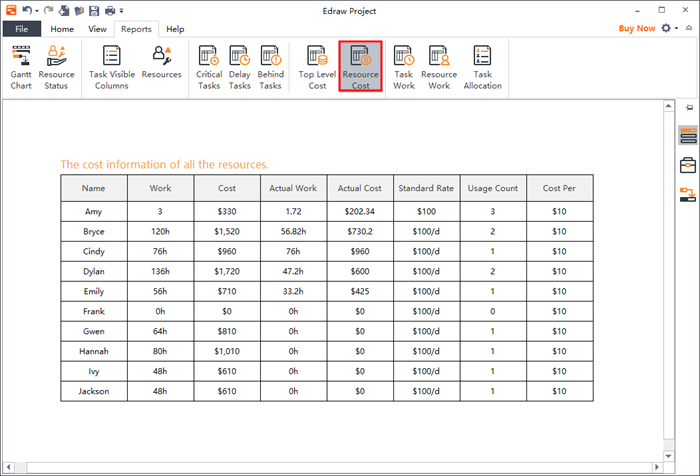
Resource Cost/Task Work
Resource Cost
For some organizations, resources costs are primary costs, and sometimes the only cost, so these need to be closely monitored.
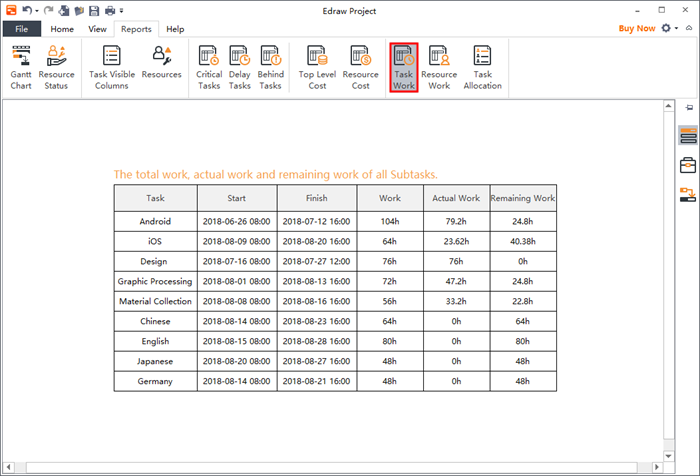
Task Work
In the Task Work report, the time amount of total work, actual work, and remaining works are displayed for all sub-tasks.
The following are formulas to calculate different types of cost:
- Actual Work = Progress*Work
- Remaining Work = (1 - Progress) * Work
Resource Work/Task Allocation
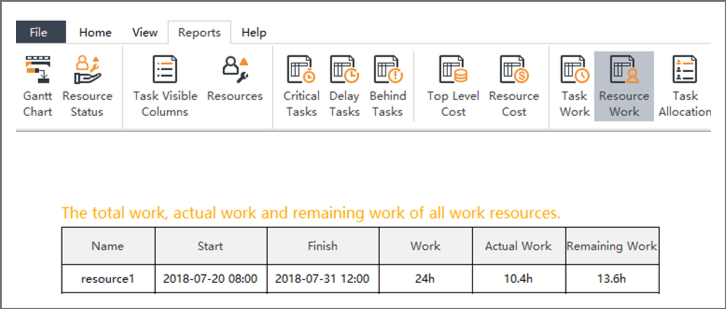
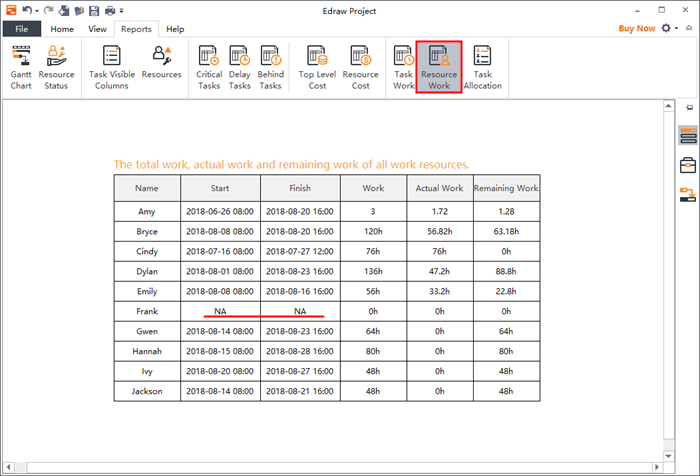
Resource Work
In the Resource Work report, the start date and finish date, the time amount of total work, actual work and remaining work are displayed for all resources. If a resource is not assigned to the project, NA appears in the corresponding Start and Finish box.
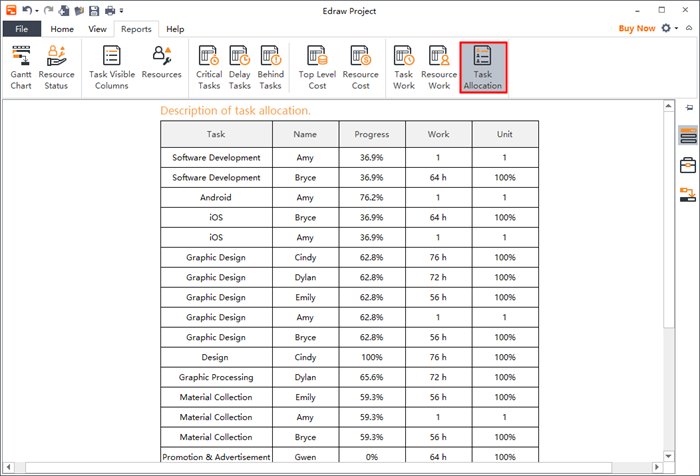
Task Allocation
The Task Allocation report lists the details of each task, including its resources, the progress, work time and the unit.
Find and Replace
(Ctrl + F)
The Find & Replace command helps you check the specific word within the whole Gantt chart, including employee names, titles, notes, comments, departments, salaries, etc.
- Go to the Home tab and click the Find & Replacement icon
 . A pop-up dialogue will show up.
 - Type content you intend to find in the find column, and click Find Previous or Find Next.
- Type content you intend to replace in the replace column, and click Replace or Replace All.
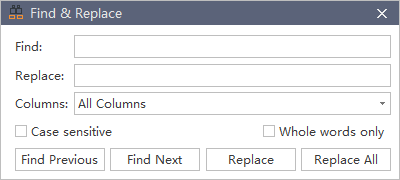
Tips:
- If you want to filter capital words only, you can click Case sensitive for precision.
- If you want to reduce the scope of finding, please click Whole words only.
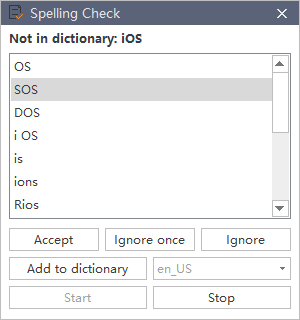
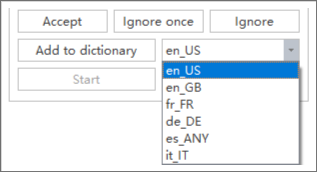
Spelling Check
(F7)
The Spelling Check function of EdrawProj helps you diagnose spelling mistakes and offer suggestions for correct spellings.
- Go to Home tab and click the Spelling Check button
 .
. - If there are mistakes in your file, the Spelling Check dialogue will show up. It will show all recommended spellings for you to choose.
- Choose one of the suggestions and click Accept, or Ignore if the word is not wrong.
- Once you click the Accept or Ignore, it will jump to the next spelling mistake, and repeat until there are no mistakes.
- For the word which is correct but not in the dictionary, you can click Add to Dictionary, so that it won’t be treated as a wrong word next time.
Undo and Redo
(Ctrl + Z / Ctrl + Y)
EdrawProj provides undo and redo actions for users.
Undo is used to reverse your last action. Click Undo button on the quick access toolbar, or press Ctrl + Z.
Redo is used to do any undo function again. Click Redo button on the quick access toolbar, or press Ctrl + Y.
Open and Save a Gantt Chart
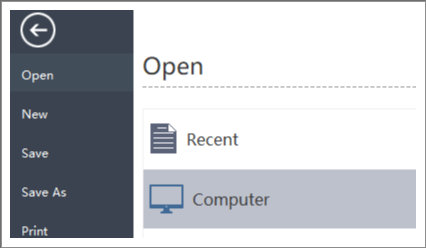
Open a Gantt Chart
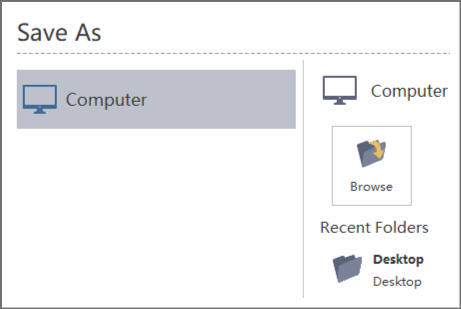
To open a Gantt chart made by EdrawProj, you can:
- Go to the File tab and click Open, then you can choose to open a Gantt Chart from Recent Documents or Computer.
- Drag a Gantt Chart and drop it on the top of the program.
Save a Gantt Chart
(Ctrl + S, Ctrl + Shift + S)
You can save your Gantt chart by using Save or Save As commands.
- Go to the File menu, click Save or Save As.
- Enter a name and choose a location to save your file.
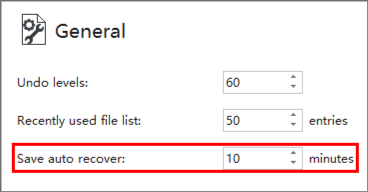
Find and Recover an Auto Saved File
EdrawProj creates an auto-saved temp file for users in case they didn't save the files due to unexpected computer shutdown or software crash. Users can set a time-frequency for each autosave. The default setting is to save in every 10 minutes.
Set Auto-Save Time Period
- Go to the File tab, click Options and then click General.
- From the Save auto recover option, input a time period.
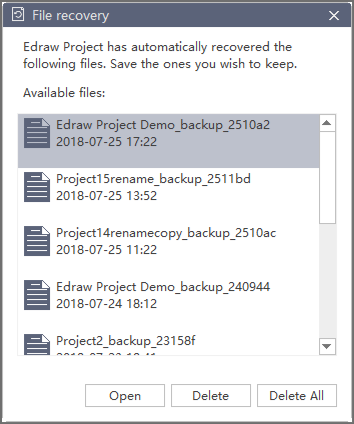
Find Auto Saved File
- Go to the View tab, click the File Recovery button.
- Find your auto saved files from the file recovery list.
Print and Export Gantt Chart
Print a Gantt Chart
Go to the File tab and click the Print button to print a chart; or click the Print button in the Quick Access Toolbar.
Orientation
Specify the paper orientation as portrait or landscape.
Paper Size
Shown in the list are the paper sizes supported by the current printer as well as industry standard sizes.
Print Setup
Click the File tab, click the Print, and then click the More Print Setup… to set the print options.
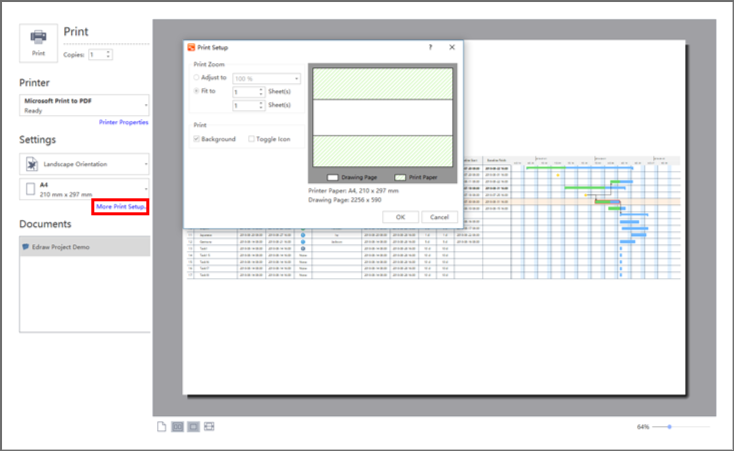
Adjust to
Reduces or enlarges the drawing page to a specified proportion of actual size for printing. If the drawing page is larger than the size of one piece of paper, the diagram will be printed onto multiple pieces of paper.
Fit to
Fits each drawing in the print job on the length and width of the specified number of sheets. The drawing will be enlarged or reduced according to the number of pages and the margins you specified. If the length and width of pages are not proportional to the drawing's dimensions, only those sheets that are needed to maintain the drawing's proportion will be used.
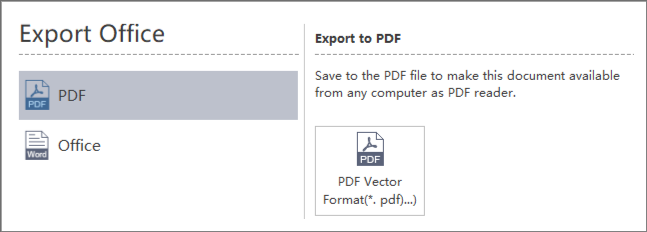
Export a Gantt Chart
You can export your charts to different formats including PDF and Microsoft Office Excel.
Keyboard Shortcuts
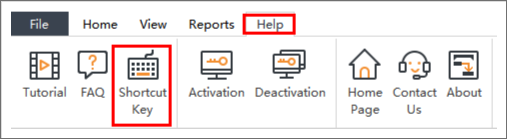
You can find the list of keyboard shortcuts for EdrawProj any time on Help tab by clicking the Shortcut Key icon.
| Function | Shortcuts |
|---|---|
| Documents | |
| Create a new chart | Ctrl + N |
| Open a chart | Ctrl + O |
| Save the current chart | Ctrl + S |
| Save all charts | Ctrl + Shift + S |
| Print the current chart | Ctrl + P |
| Interface | |
| Gantt Chart | Ctrl + G |
| Show / Hide Data | F8 |
| Show / Hide Search | Ctrl + Shift + F |
| Spelling check | F7 |
| Find | Ctrl + F |
| Preview | F11 |
| Basic Operations on Tasks | |
| Add Task | Enter; Return |
| Insert Task | Insert |
| Remove Task | Delete |
| Indent Task | Tab; Ctrl + Right |
| Add Hyperlink to a Task | Ctrl + K |
| Editing | |
| Undo the last action | Ctrl + Z / Alt + Backspace |
| Redo the last action | Ctrl + Y; Alt + Backspace; Ctrl + Shift + Z |
| Move Tasks | |
| Up one place | Ctrl + Up Arrow |
| Down one place | Ctrl + Down Arrow |
| Cut, Copy, Paste and Delete | |
| Cut | Ctrl + X |
| Copy to the clipboard | Ctrl + C |
| Paste | Ctrl + V |
| Delete current object | Delete |
| Commands in Box Text Edit Mode | |
| Move to beginning of box text | Home |
| Cancel editing box | ESC |
| Commands in Find Mode | |
| Find & Replace | Ctrl + F |
| Spelling check | F7 |
| View | |
| Zoom in | Ctrl + + (plus); Ctrl + = |
| Zoom out | Ctrl + - (minus) |
| Auto Zoom | Ctrl + Shift + A |
| Expand & Collapse | Ctrl + D |
| Expand All | Ctrl + Shift + E |
| Collapse All | Ctrl + Shift + C |
| Outline Level 1 - 9 | Alt + 1; ...; Alt + 9 |
| Show all levels | Alt + 0 |
| Using Help | |
| Show help | F1 |
| General Windows Commands | |
| Close a menu or dialogue box | Esc |
| Cancel an operation | Esc |
| Exit EdrawProj | Alt + F5 |

