OrgCharting User Guide
Create an Organizational Chart in 5 Steps
OrgCharting is a powerful organizational chart maker with a user-friendly interface that allows users to create org charts with simply mouse clicking. It has abundant ready-made templates and advanced color themes to help you make professional organizational charts in the fastest way.
OrgCharting works not only for company structure visualization but also for workforce planning and management. It gives an overall picture of the company hierarchy and personnel relationship, so that company managers could gain insight for decision making and strategic planning. Besides, org charts can be used as the employee database, through which you can find, manage and update employee information. The views options of OrgCharting allow users to choose or define a special perspective and display the relevant information.
With OrgCharting>, you can create highly-customized org charts, for example, with personalized color schemes, layout styles, backgrounds, or data fields. When you finish the chart, you can export your charts to different file formats such as PDF, JPG, Word, PPT, and it's easy for you to share the charts with others. You can also make awesome presentations by using the function of automatic slide deck generation.
Download and Install
System Requirements
- Windows 2000, XP, Vista, Windows 7, Windows 8 and Windows 10.
- Mac OS X 10 or later.
- At least 1 GB RAMMac OS X 10 or later.
- At least 850 MB free disk space.
Check for Updates
- Visit Download Center to update OrgCharting latest installation package.
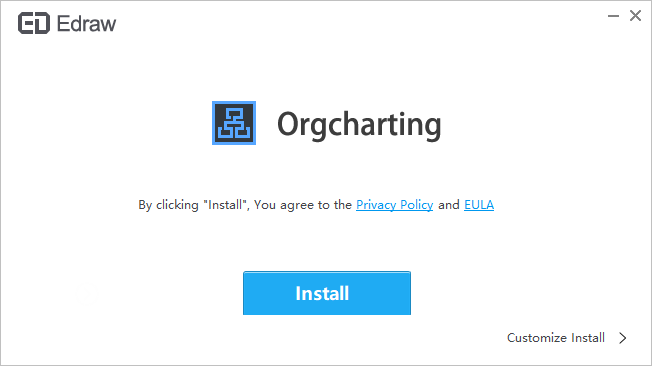
- Double click the executable installation file and follow the on-screen instructions to finish the installation.
For Assistance
If you have further problems, please contact support@edrawsoft.com.
Activation and Deactivation
User Activation
Once successfully installed, you can register and activate the software with your license code. If you do not have a license code, you can click Buy Now to place an order.
- Run OrgCharting software with computer administrator privilege.
- Click Activation in the Help tab.
- Click the Help tab on the ribbon.
- Input your License Name (can be any name) and License Code.
- Click Activation to run the Activation Wizard.
User Deactivation
Deactivation is necessary if you wish to move OrgCharting from one computer to the other. Please note that deactivation can only be done once every 30 days.
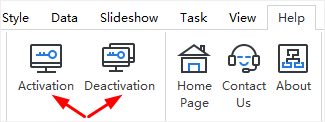
- Simply go to the Help Tab, and click Deactivation
- Once you have clicked Deactivation , the OrgCharting software on your current computer will turn to the unlicensed version, so you can activate it on another device.
Users Interface Overview
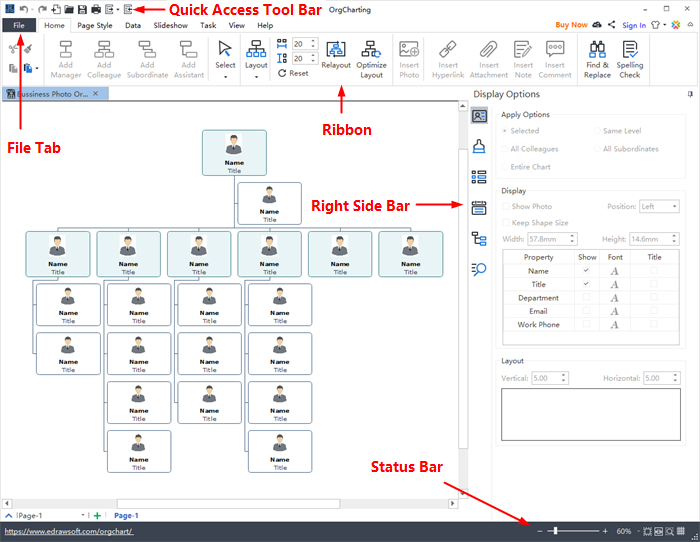
The interface shows the initial and overall window where you can create org charts. Here you can see File Tab, the Quick Access Toolbar, Ribbons, Right Sidebar and Status Bar at the bottom.
Quick Access Toolbar
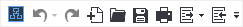
In the quick access toolbar, you can find quick tools such as Undo/Redo, Create a New Org Chart, Open Files, Save, Print, Export and Import. You can hide or add any of these buttons by clicking the mini Down Arrow on the right. You can also choose to place the quick access toolbar on the top or at the bottom of the Ribbon.
Ribbons
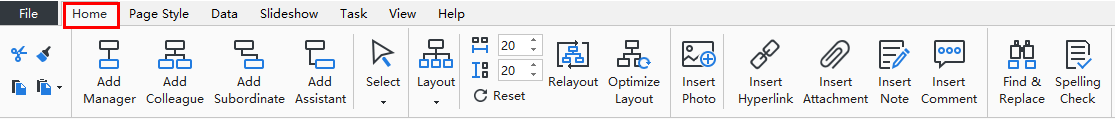
- Home Tab
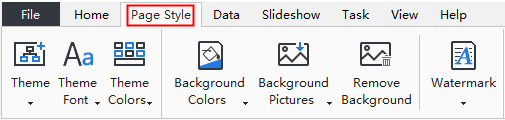
- Page Style
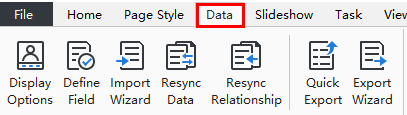
- Data
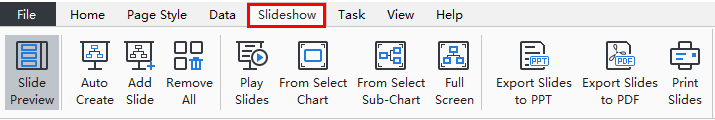
- Slideshow
- Task
- View
- Help
In the Home tab, there are plenty of helpful functions for creating org charts. You can add managers, colleagues, subordinates and assistants; change layout types; optimize layouts; insert photos, hyperlinks, attachments, notes and comments; adjust horizontal or vertical distances.
The Page Style tab is where you can format your org charts. You can select the theme styles, theme fonts and theme colors. You can also edit or remove the background of your org charts, or customize your own watermarks.
The Data tab is where you can set display options and quickly import/export your org chart data from your local files. More specifically, in the Data section, you can define fields, synchronize data, import/export data, and set text fonts, titles and more information for an individual employee.
In the Slideshow tab, you can add slides one by one, or auto-create your slides. Feel free to edit or remove any content in your slide pages. Once finished, you can preview your work in full screen, and then export or print the PPT.
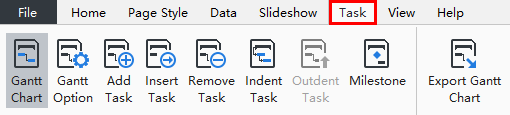
The Task tab allows you to add, set and export Gantt Charts. You can create a new task by right-clicking on the employee box and choosing Add Task in the context menu. Alternatively, you can insert new tasks by directly clicking the Add Task button on the Task tab. Besides, you can set milestones, define task periods, edit task names, update task progress and priority, and assign tasks to members.
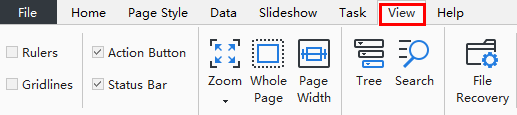
The View tab shows different view options. You can choose to zoom in or out your org charts or review it on the whole page. The Tree Panel allows you to edit data field content and it will synchronize with the org chart in the canvas.
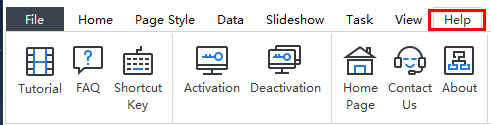
In the Help tab, you can easily find tutorials, FAQ, contact information, keyboard shortcuts, and buttons to activate or deactivate the software.
Right Sidebar
The Right Sidebar has 6 tabs in total: Display Option, Style, Views Options, Data, Tree, and Search.
- Display Options
- Style
- Views Options
- Data
- Tree
- Search
In the Display Options section, you can choose to show or hide your employees' photos, set the order, font, and position, etc. for displaying your employee details.
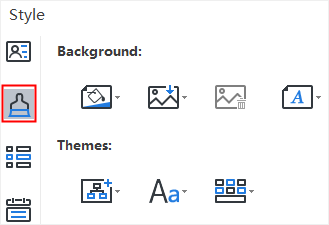
In the Style section, you can change the background colors, background images, watermarks, theme styles, theme colors, and the overall text fonts.
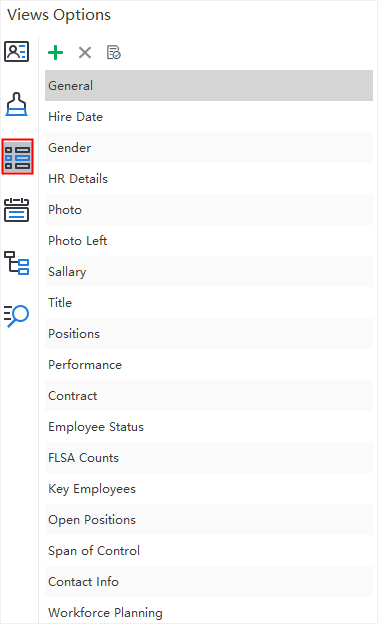
The Views Options section provides different choices of viewing org charts. Some chart elements and data which are excluded from your choice are hidden in this mode. Usually, the company organizational charts contain massive information on different categories. However, a person at a specific position may not always want to see all the data. For example, if you are an HR, you can click HR Details to view the information about human resources only.
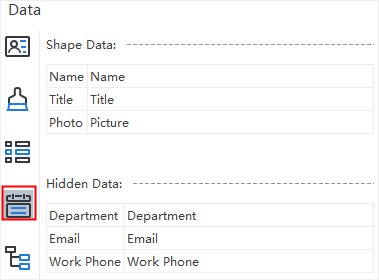
In the Data section, you can see the full details of an individual employee in your current org chart, including the name, title, photo, department, contact information.
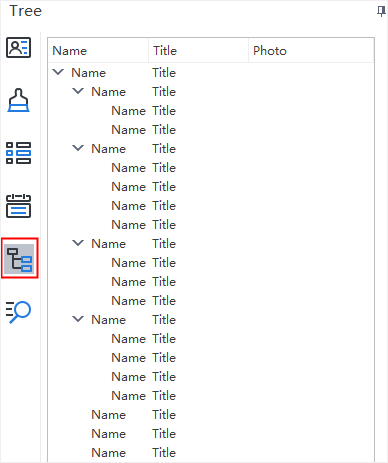
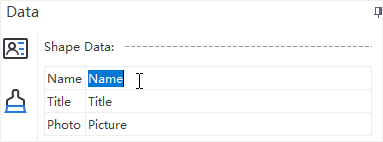
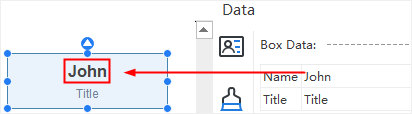
In the Tree section, you can quickly go through all the information in your current org chart. If you want to modify the information of certain employee, you can double click the name, title or photo to input the right details.
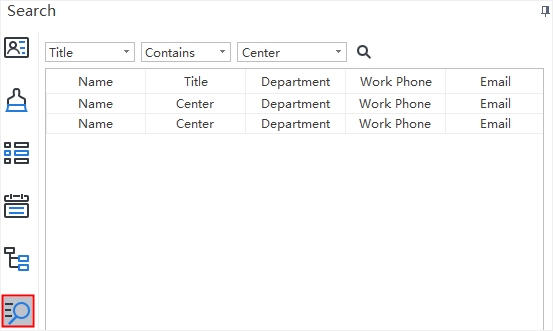
In the Search section, you can search any specific employee information in your org charts, such as the name, title, location, gender, department, etc. Furthermore, you can also search for numbers like salaries, work performance ratios, etc.
Start an Org Chart
You have 3 options to start an org chart:
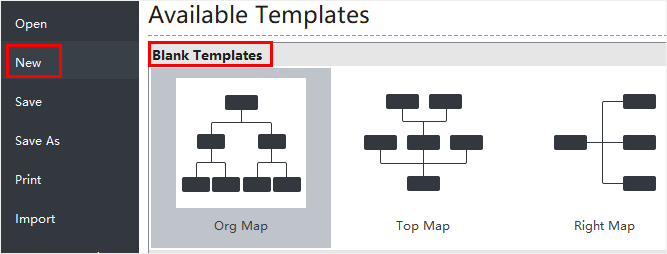
Option A: Double-click one of the org structure icons in File New Blank Templates. Your org chart will be created based on the selected type.
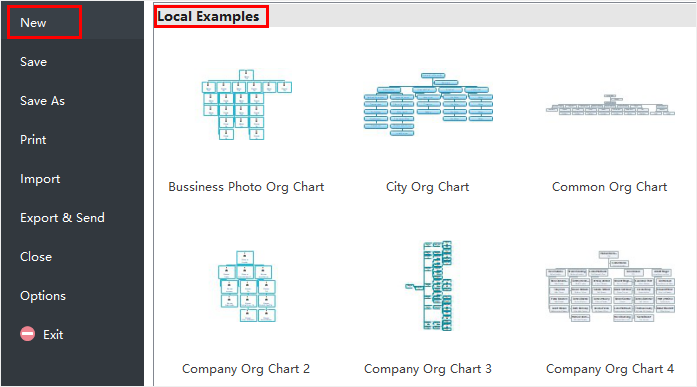
Option B: Double-click one of the org chart templates and examples in File New Local Examples. You can edit and personalize the selected org chart templates and examples.
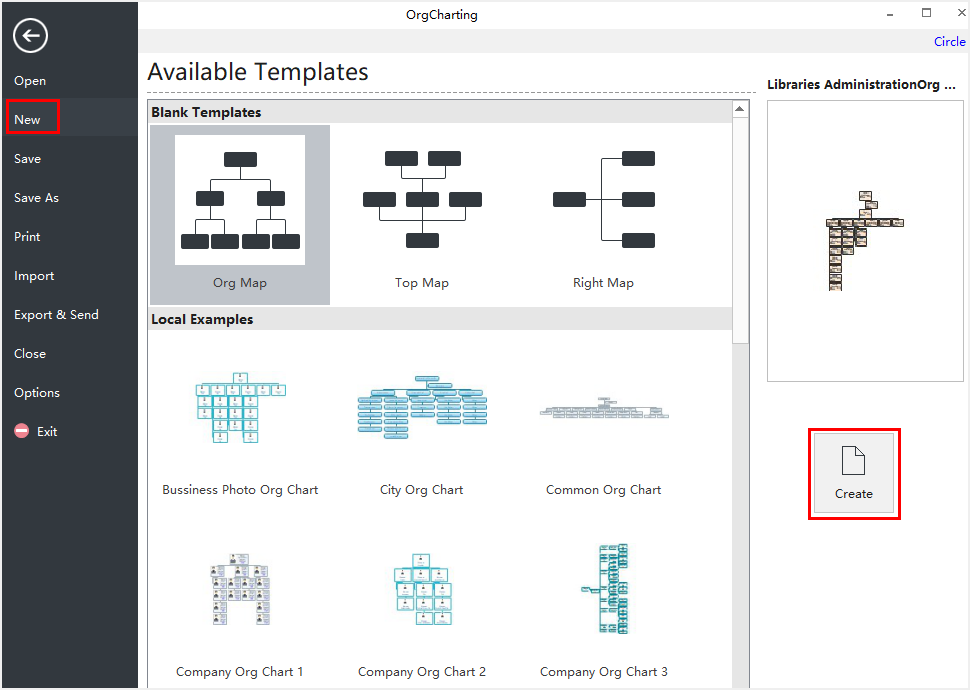
Option C: Left-click one of the org chart templates or examples in the File NewLocal Examples, and then click the Create button to start your org chart.
Sign Up Cloud Account
You can sign up an OrgCharting cloud account and sign in to use the cloud and share your charts.
Add Boxes
Keyboard Shortcuts to Add Boxes
| To Add | Shortcut(s) |
|---|---|
| Manager Box | Shift + Enter |
| Colleague Box | Enter |
| Subordinate Box | Insert / Ctrl + Enter |
| Assistant Box | Alt + Enter |
Add a Manager Box
(Shift + Enter)You can add a manager box in 3 ways:
- Press Shift + Enter on the keyboard.
- Click Add Manager button on the Home tab.
- 3. Move your mouse over a box, then click the floating button
 above the box.
Add a Colleague Box
(Enter)You have 3 options to add a colleague box:
- Select a box, then press the Enter key on the keyboard.
- Select a box, then click the Add Colleague Button on the Home tab.
- Move your mouse on a box, then click the floating button.
Add an Assistant Box
(Alt + Enter)If you want to add an assistant box, please use the 2 ways:
- Select a box, then press Alt + Enter on the keyboard.
- Select a box, then click the Add Assistant button on the Home tab.
Select, Move and Delete Boxes
Select Boxes
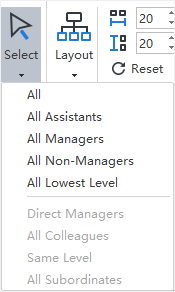
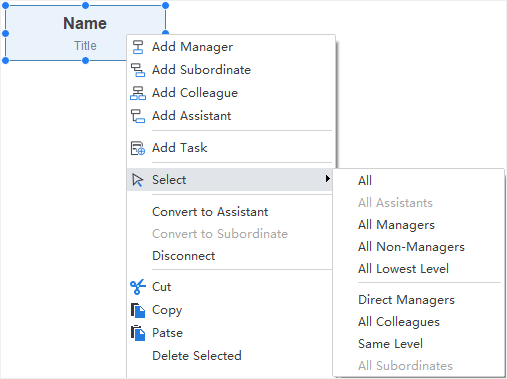
You can select boxes according to their types or levels. Click the Select button on the Home tab or right-click a box and go to the Select option to choose the one of the following types:
- All Boxes
- All Assistants
- All Managers
- All Non-Managers
- All Lowest Level
- Direct Managers
- All Colleagues
- Same Level
- All Subordinates
Move Boxes
You can move a targeted box to different directions, like moving it up, down, left or right between different levels.
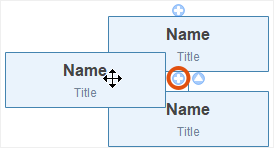
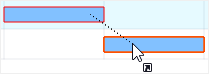
Drag and Drop to Move a Box
You can freely re-position any boxes on your org charts by simply dragging and dropping it to a new position. A visual sign will show you where a box will be moved to. Any of your boxes (except the very top one) can be rearranged and moved into different positions.
Delete Boxes
(Delete)Delete Selected Boxes
You can delete selected boxes while keeping all of its subordinate boxes.
- Select the target box, or boxes.
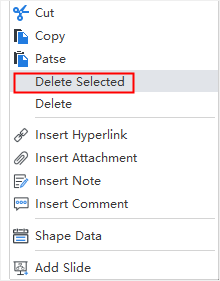
- Right-click and choose Delete Selected in the context menu.
- The selected box, or boxes, will be deleted.
- The remaining subordinate boxes will be raised to the higher level.
Delete a Selected Box and All of Its Subordinate Boxes
You can delete a box with all its subordinate boxes.
- Select a box.
- Right-click and then select the Delete Branches.
- The box and all of its subordinates will be deleted.
Cut, Copy and Paste Boxes
Use the Copy and Paste, you can quickly duplicate a selected box or branch, then paste it as a subordinate or colleague box to any of your existing boxes.
- Select the box or branch that you want to copy.
- Go to Home tab and click the Copy button (or press Ctrl + C).
- Select a box, or click anywhere on the blank area and click the Paste button (or press Ctrl + V).
Insert Photos, Attachments and Hyperlinks into Boxes
Insert Photos
(Ctrl + Shift + P)Org Charting allows you to insert a photo into a box in many formats like GIF, JPG, PNG, ICO, BMP, and TIF etc.
- Select a box.
- Click the Insert Photo button
 in the Home tab, or press Ctrl + Shift + P to insert.
 - Select a photo from your PC.
- Press the Open.
- Drag the selection handle to adjust the size of your photo.
- Your photo will be automatically adjusted to fit the size of the box
- The default position of the photo is the left side of the box. You can change the position of the photo in the Position option which is on the Display Options panel.
Insert Attachments
(Ctrl + H)OrgCharting allows users to insert attachments without quantity limitation. Attachments can be saved automatically in the org chart.
- Select a box.
- Click Insert Attachment on the Home tab or right click the topic and choose Insert Attachment option.
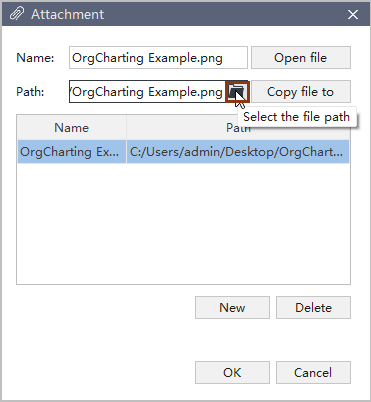
- Click Path to select a file
- Change the name for the attachment if necessary.
- Click New to add more attachments.
- Click Delete to remove an attachment.
- Click New to add more attachments.
- Click Delete to remove an attachment.
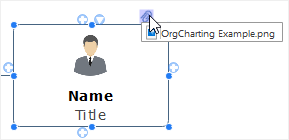
The Attachment icon is in the top right corner of the topic. Hover the mouse cursor on the icon, you can see the name of the attachment and click the attachment name to open it.
Insert Hyperlinks
(Ctrl + K)Hyperlinks are convenient for users to view other documents, files or websites in org charts, including current documents, files, applications, internet addresses, and folders. The hyperlinks can link to any of the following:
- Another page or shape in the current document.
- A file or application
- A folder
- A Web URL
Add a Hyperlink to an Existing Shape or Page
- Select a box you want to add hyperlink to.
- Click Insert Hyperlink on the Home tab, or Right-click the box and choose Insert Hyperlink option.
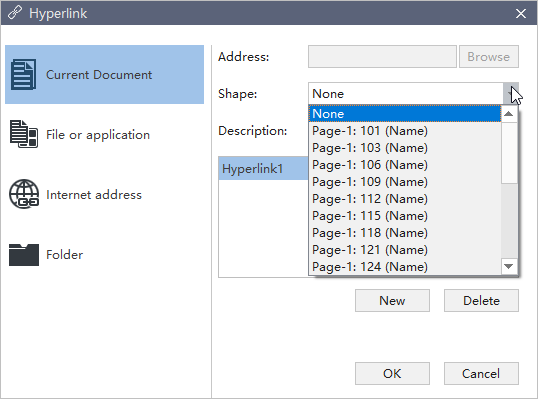
- Select Current Document
- To link to a specific shape, you can choose a shape ID from the shape list.
- Click New to add more hyperlinks.
Add a Hyperlink to a Web URL
- In the Type list, choose Internet Address.
- In the Address box, type the address of a Website, FTP site, or e-mail address (beginning with http://, ftp://, or mailto: respectively).
- In the Description box, type a name for the link. This text will appear on the hyperlink icon.
- Click New to add another hyperlink.
- Click OK.
Add a Hyperlink with a Folder
- Choose the Folder in the Type list.
- Click Browse and navigate to the folder.
- In the Description box, input a name for the link. This text will appear on the hyperlink icon.
- Click OK.
Change or Delete a Hyperlink
- Select the box.
- Click Insert Hyperlink or the hyperlink icon on the box.
- To delete a hyperlink, select the hyperlink in the hyperlink list, click Delete.
The hyperlink icon is in the top right corner of the topics. If you move the pointer to the icon, you will see it.
Add Comments and Notes
Add Comments
(Ctrl + Shift + T)Commenting on the specific topic or subtopic in a collaborative team is a highlight in OrgCharting. You can receive praises and suggestions from your colleagues and supervisor directly with the base of Cloud.
- Click the box that you need to comment.
- Click Insert Comment on the toolbar or right-click the topic and choose Insert Comment option.
- Type comments in the dialog box.
- Click Send.
- Click Modify in the bottom of the dialog box to edit the current comment.
- Click Delete to remove a comment.
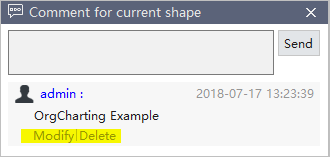
When a comment is added, there will be a green chatting icon showing in the top right corner of the box. If you move the cursor to the icon, you will see your name, date, and comment.
- Before commenting, make sure you have signed in OrgCharting cloud account. If not, the commentor's name will be the computer user's name.
- You can add more comments at the same box.
Add Notes
(Ctrl + T)As org charts are always concise, many details could not be put into the main body. Notes can solve the problems of inadequate information. You can add notes in the format of texts, pictures, and tables to enrich your org charts.
- Select the targeted boxes.
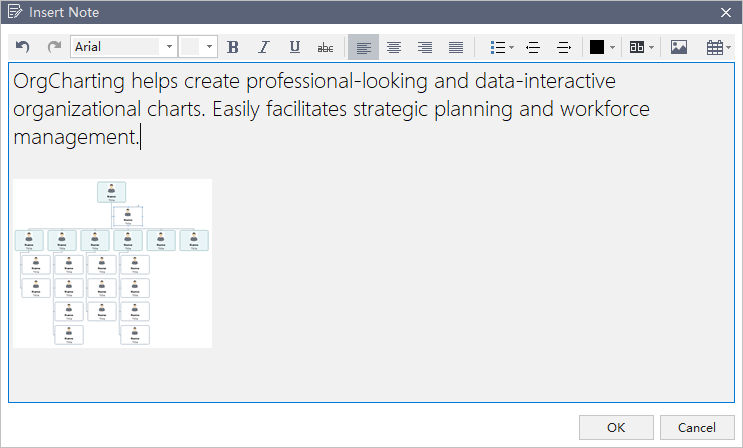
- Click Insert Note on the Home tab, or right-click the box and select Insert Note option.
- Type your note in the pop-up Note window.
- Click Picture icon to add pictures.
- Click Calendar icon to insert date.
- Edit text formats with text formatting options on the toolbar.
- To check your notes, hover the cursor over the Note icon.
Layout Options
The arrangement of shapes in an org chart is controlled by the chart's general layout options. With the layout options, you can change the arrangement and directions of the chart.
Change Overall Chart Layout
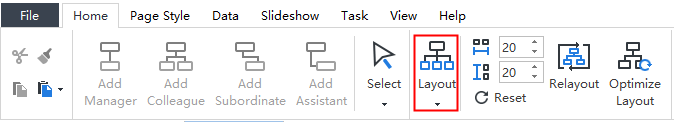
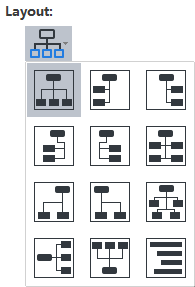
- Select the top box.
- Go to the Home Tab and click the Layout button. Or go to the Right-Side Panel, and click the Layout button under the Style option.
- Select the layout style of the overall org chart.
Optimize Layout
The Optimize Layout button in the Home tab allows OrgCharting to apply the best style for your org chart which suits the width of the screen.
Horizontal and Vertical Distance
The distance between shapes is defaulted both horizontally and vertically. The unit of the distance is millimeter and the default value is 20 in both horizontal and vertical direction.
To adjust the default distance value, you can:
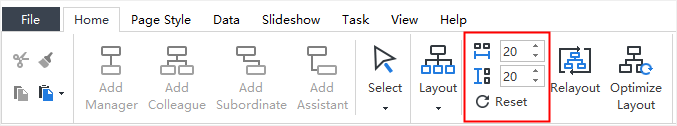
- Go to Home tab, click the up or down arrow to increase or decrease the distance.
- Press Enter to apply the adjustment to your chart.
- Alternatively, you can input the number in the option boxes directly and press Enter.
- The maximum value is 200 for both horizontal and vertical distance, and the minimum is 20.
- This function can only adjust the distance between all shapes on the whole.
Apply and Change Theme
Apply a Theme
The default appearance of an org chart is determined by its underlying chart Theme. A chart theme is a collection of the default format settings used for the various types of elements in your chart, including a set of theme colors, theme fonts (both heading and body text fonts), and theme effects (both lines and filling effects).
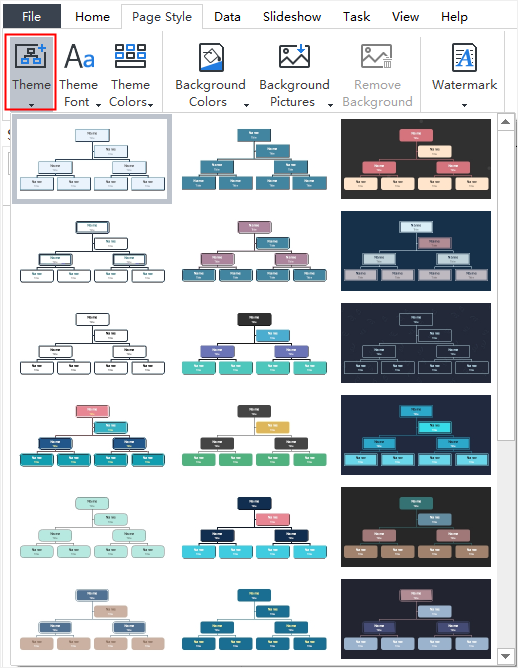
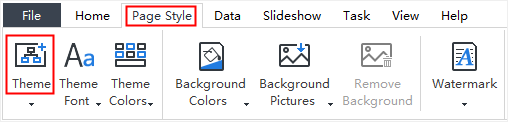
Click the Theme button in the Page Style tab of the ribbon or the Style option of the right side panel. Drag the scroll bar to choose your desired theme.
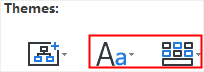
Change Theme Font and Theme Color
The default format for all the shapes and objects on the chart is determined by the theme of the chart. After selecting a theme, you can still change the theme font and theme color.
- Click anywhere on the blank area.
- Go to the Theme section under the Style panel on the Right Side Panel.
- Click the Theme Font and Theme Color buttons.
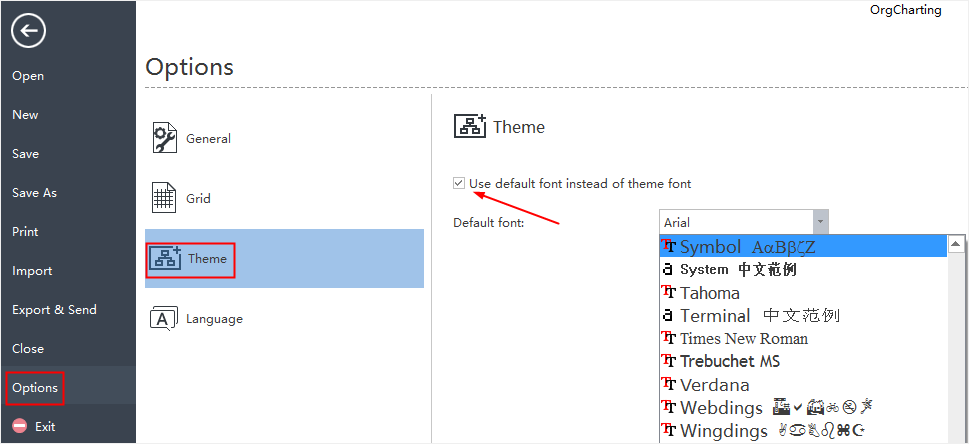
You can set a default font for your chart, and use the default font instead of the theme font. Go to the Options menu, click Theme, and tick "Use default font instead of theme font", then choose a default font for your chart.
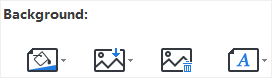
Background
To set a chart background, you can use a background color or a background image. You can also apply the watermark on your background. The buttons and options of background formatting could be found under the Style section on the Right Side Panel or on the Page Style tab on the ribbon.
Background Colors
Click the background color button to fill the background with single color.
Background Images
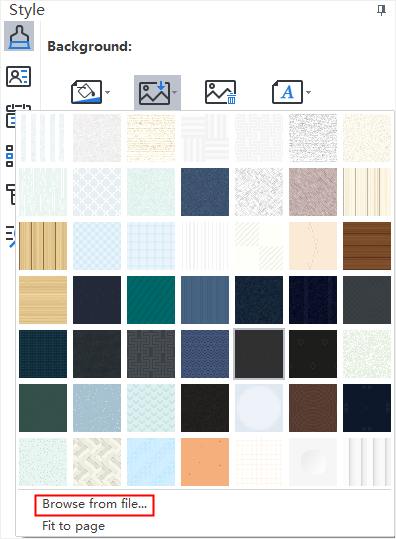
OrgCharting has a wide range of predefined background images to enhance the look of your org charts. You can add these premade background images or upload your own background images from local files.
Add a Background from the Library
- Click the Background Pictures button
 .
. - From the pull-down list, choose your preferred background image.
Add a Background from Local File
You can insert your own image as background.
- Click the Background Pictures button.
- Click Browse from file and navigate to the image file.
Add a Background Watermark
This function lets you print over every page of a document with certain text, which is useful for security or content identification.
You can add a watermark to your org chart via the following steps:
- Click the Background Watermark button
 in the Page Style tab or under the Style section on the right sidebar.
 - Choose a pre-made watermark from the thumbnails in the drop-down menu.
- If you do not need the pre-made ones, you can click Customize Watermark to create your own one.
- From the Custom Watermark pop-up window, you can adjust the text, font, size, color or layout of your watermark
- Click Remove Watermark when you don't need it.
Remove Background
To remove the background, click the button Remove Background .
.
Change Shape Fill and Shadow
Change Shape Fill Color
You can change the shape fill colors via the following steps:
- Select a shape.
- Click on the Style icon
 to open the right sidebar.
 - On the Style panel, click the Fill icon
 to choose your desired color to fill the selected shape.
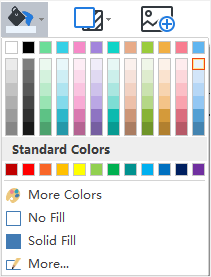
No Fill
To make a shape colorless, or to remove fill from a shape, you can choose the "No Fill" option.
Theme Colors
The top section of the Fill colors is Theme Colors. They are predefined color sets of the current themes.
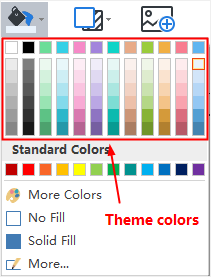
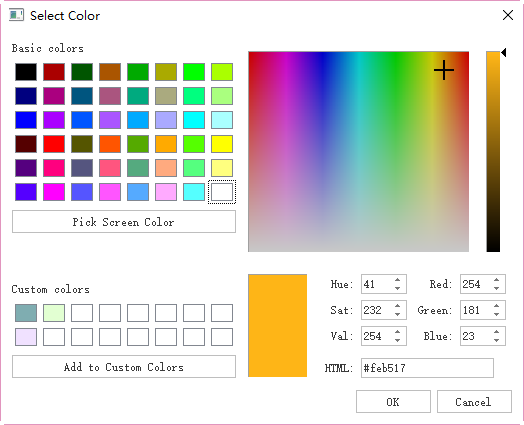
More Colors
To use colors that aren't included in the theme colors or standard colors, click More Colors. In the pop-up window, you can:
- Choose a color from the color swatch.
- Select a color from the color palette.
- Click "pick screen color" to pick a color.
Transparency
To change the transparency, you can move the Transparency slider, or enter a number in the option box next to the slider. You can vary the % of transparency from 0 (fully opaque, the default setting) to 100% (fully transparent).
Gradient Fill
Click More… to find the Gradient Fill option and add a gradient fill to a shape. (Gradient: A gradual progression of colors and shades, usually from one color to the other, or from one shade to the other shade within the same color).
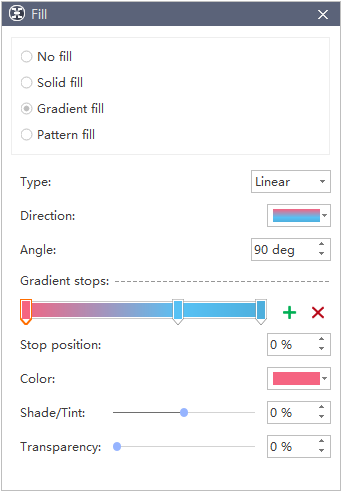
Gradient Type
To specify the direction when drawing the gradient fill, select an option from the list. The Type that you selected determines the available Direction.
Gradient Direction
To choose a different progression of colors and shades, click Direction, and then click your preferred option. The available Directions depend on the Gradient Type that you have chosen.
Angle
To specify the angle of the gradient fill which is rotated within the shape, enter your preferred degree value. This option is available only when you have selected Linear in the Type option.
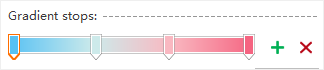
Gradient Stops
Gradient stops consist of a position, a color, and a transparency value. The transparency value applies to the gradient stop instead of the overall fill. Gradient stops can create non-linear gradients. For example, if you want to create a gradient that goes from red, green to blue, you need to add three gradient stops — one for each color.
Alternatively, if you want to create a gradient that shows up only in a corner of a shape, you need to use gradient stops to make the non-linear gradient.
Add: Click the green Add icon![]() to add a stop.
to add a stop.
Remove: Click the Red Cross![]() icon to delete a stop.
icon to delete a stop.
Stop position
To set the location for the color and transparency change in the gradient fill, please move the Stop position slider or enter a number in the option box below the slider.
Color
To choose the color of the gradient stop, click Color. To use a color that is not in the theme colors, click More Colors.
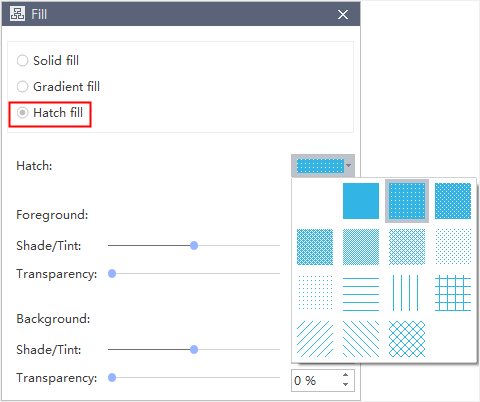
Pattern Fill
You can also fill a shape with a predefined pattern.
- Click the More… from the Fill drop-down menu.
- From the pop-up dialogue, click Hatch Fill.
- Choose a hatch from the predefined hatch gallery.
- Change the Front and Background color of the hatch.
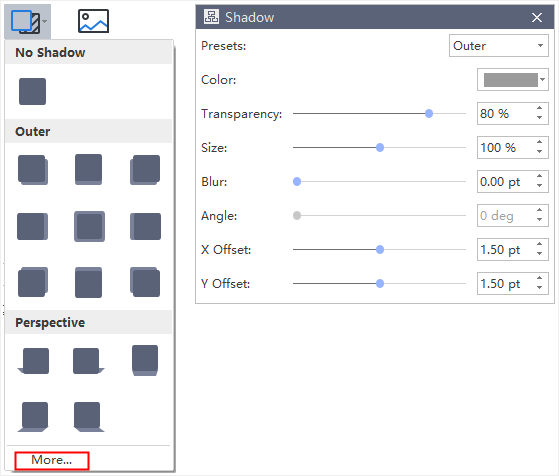
Change Shape Shadow
Click the Shadow button on the Shape panel, and then choose your preferred built-in shadow effect. If you cannot find your preferred one above, click More… to create customized shadows. This function lets you set customized shadow colors, effects, or offsets.
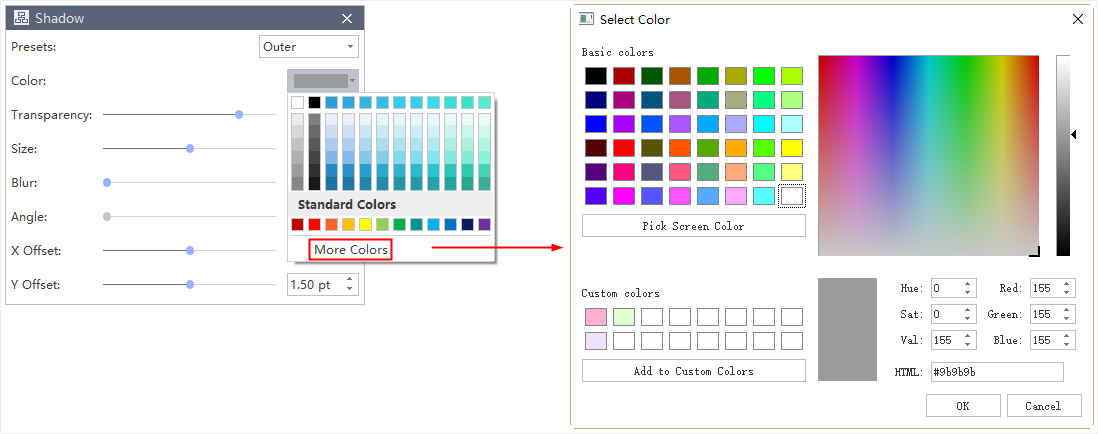
Shadow Color
To choose a color for the shadow, click Color in the Shadow dialogue, and then click your preferred color. To change to a color that isn't in the theme colors, click More Colors.
Shadow Transparency
To specify how much you can see the shadow, please move the Transparency slider or enter a number in the box next to the slider. You can vary the % of transparency from 0 (fully opaque, the default setting) to 100 (fully transparent).
Shadow Size
To specify the angle of your shadow, please move the Angle slider or enter a value in the shape next to the slider. By using the Angle and Offset options together, you can place the shadow anywhere relative to the shape.
Shadow Blur
To set blur radius on the shadow, please move the Blur slider or enter a value in the shape next to the slider. The larger the radius, the blurrier, or "fuzzier", the shape or line will be.
Shadow Angle
To specify the angle of your shadow, please move the Angle slider or enter a value in the shape next to the slider. By using the Angle and Distance options together, you can place the shadow anywhere relative to the shape.
Shadow X Offset and Y Offset
To set a distance for an Angle of the shadow, please enter a value in the shape next to the slider.
Change Border and Font
Change Color and Style of Shape Border
- Select the shape you want to change.
- On the Style panel, in the Border group, you can change the border color, border round, border style, and dash type
- To change the border color, click the Border Color button
 , and then choose your preferred border color.
 - To change the border corner roundness, click the Line Round button
 , and then click your preferred border round.
 - To change the border style, click the Border style button, and then choose your preferred border style.
- To change the border dash style, click the Border Dashes button
 , and then click your preferred dash style.
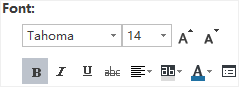
Change Font
- Select a shape or multiple shapes.
- On the Style panel, in the Font group, you can change the font type, font size, alignment, bullet points, boldness, italic, underline, line spacing, or font color.
Click the following buttons to achieve corresponding font effects:
 Bold the selected text.
 Italicize the selected text.
 Underline the selected text.
 Draw a line through the middle of the selected text.
 Align selected text to a special edge.
 Highlight the selected text.
 Change the text color.
 More font options.
Views Options
The Views Options provide a lot of choices to display your data. The individual chart elements and data excluded from your choice are hidden in this mode.
This area is located at the right-side panel. Usually, the company organizational charts contain massive information on different categories. However, a person at a specific position may not always want to see all the data. For example, if you are an HR, you can click HR Details to view the information about human resources only.
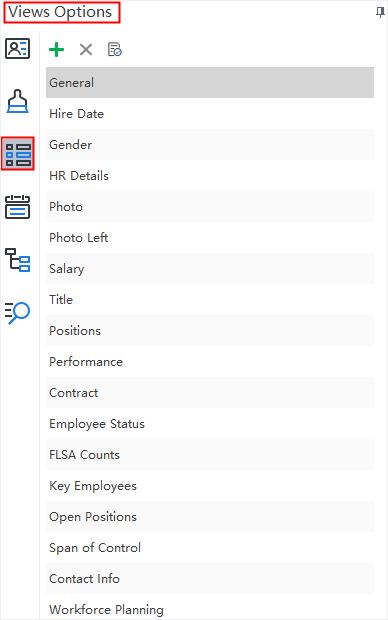
Add New View
Please note that the view options displayed on the picture above are predefined and cannot be deleted. You can add new views to your org charts and the customized views are deletable.
Follow the steps below to add a new view:
- Go to Views Options on the right sidebar, click Add New View button
 .
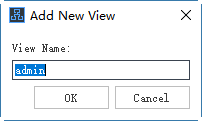
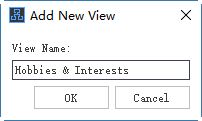
. - Edit the name of the new view and click OK. Here I name it "Hobbies & Interests".
- The new view appears at the bottom of the predefined views.
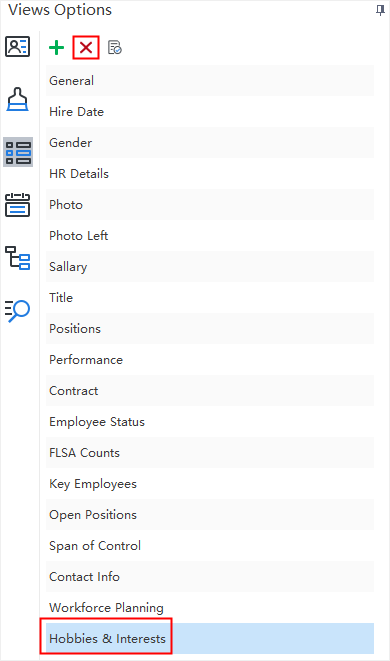
If you need to delete the customized view, select the view and click the Delete Selected View button .
.
Note: When there is no customized view, the Delete Selected View button is gray, and it turns red if a customized view is selected.
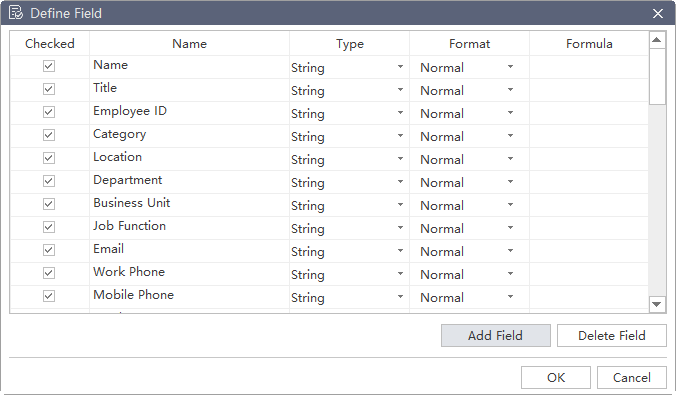
Define Field
The Define Field function supports to define a new data field that is not covered in the predefined data fields. The newly defined data field will be saved in the Data Field panel with the predefined ones, and can be added to your chart or the custom view anytime.
The steps below will tell you how to add customized field to the org chart:
- Go to the Views Options on the right sidebar, click the Define Field button
 . The Define Field window will pop up.
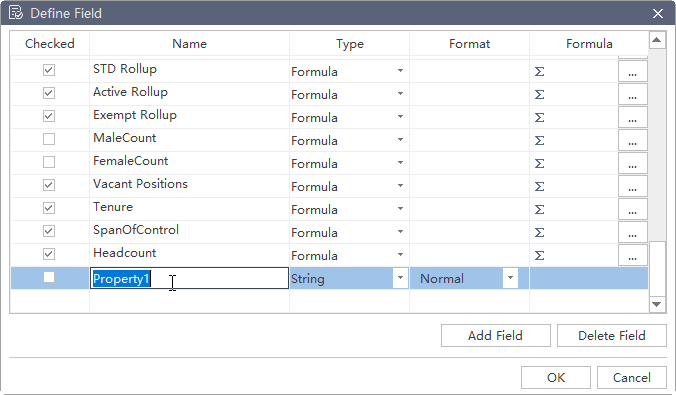
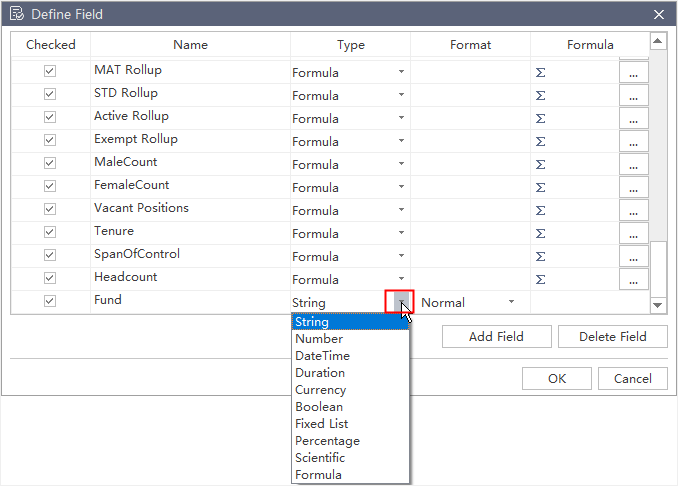
 - Click Add Field. A new field "Property 1" appears at the bottom of the predefined data fields. Double click and rename the newly added field. Here I name it "Fund".
- Click the triangle to choose the data type in the drop down menus.
After you have checked the newly added field, you can choose to display it in the Display Options or not.
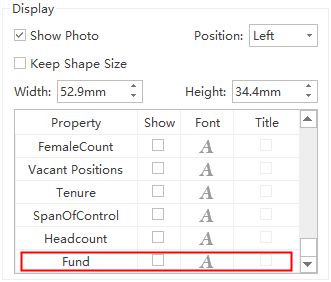
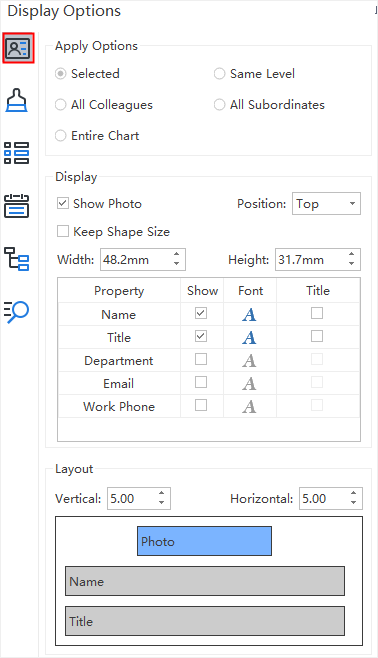
Display Options
The Display Options panel allows you to choose which kind of data will be displayed in the current view. It also lets you set the width, height, photo position, content layout, interval, etc.
Select a box and go to the Display Options on the right panel to open the Display Options menu.
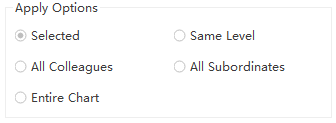
Apply Options
The Apply Options panel allows you to quickly set the ranges and locations of the changes in your chart. With a single mouse click, you can affect everything from the data in the individual box to the look of selected boxes, same level boxes, all colleague boxes, all subordinate boxes, and even the entire chart.
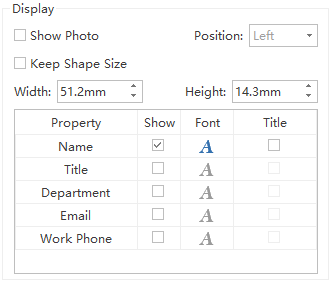
Display
The Display menu determines the visual appearance of the data in a box. You can check or uncheck the Show box on the right of each property to make the data visible or not.
Layout
The Layout option determines the layout and alignment of the data inside a box.
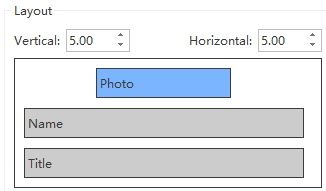
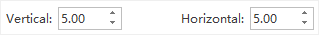
Distance
The "Vertical" and "Horizontal" refers to the interval of the content blocks. The unit of the distance is millimeter and the default value is 5 in both horizontal and vertical direction.
To adjust the default distance value, you can:
- Click the up arrows and down arrows to increase or decrease the number.
- Press Enter to set your adjustment to your chart.
- Or input the number you need in the blanks directly and press Enter.
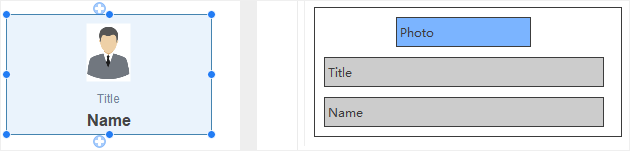
Change Data Layout Inside a Box
- Select the target box, and the current data layout inside the box appears on the Layout window.
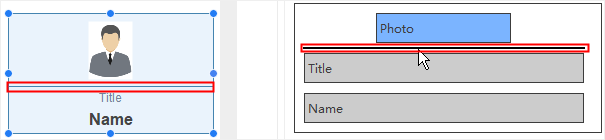
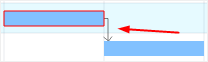
- Drag the bar in the Layout window to re-align the data elements in the box. The red line reminds you where you can drop the bar.
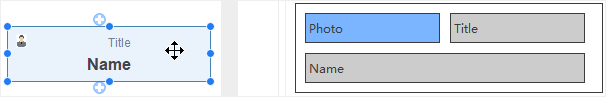
- After you've finished the realignment, you can see the updated box in both the canvas and the Layout window.
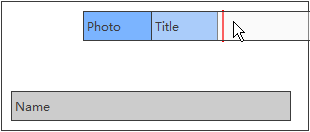
- Hover the pointer on the blank gaps between the two content sections and a black line appears.
- Click the black line, and a border line will appear in the box accordingly.
Show Photos on a Box
- Select a box.
- Click the Display Option on the right panel.
- Tick the Show Photo box.
- Change the position of the photo by selecting the drop-down menu of the Position. It determines whether the photo will be aligned.
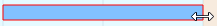
Change a Box Size
You have 2 ways to change a box size.
- Select a box, then drag and drop the blue handle at the corners of the box to change its size.
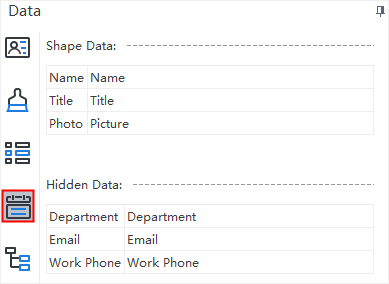
- Select a box and go to the right sidebar, then click the Data button
 . The menu displays the shape data and hidden data as in the example below.
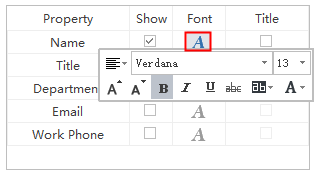
Change Font for Each Data Field
Each data field of the box could be adjusted based on the following simple steps:
- Select a box.
- Click the Display Option on the right panel.
- Click the Font button to change a single data field.
Display and Edit Data of a Box
- Select a box and go to Right Side Bar, then click Data button. The menu displays the visible box data and hidden box data as in an example below.
- Double click the data you want to edit and type in the correct information.
Search Data
To search a box that contains specific data, you can use Search option.
Import and Export Data
Import Wizard
Importing files is a powerful and efficient way to take bulk data in other file formats (such as Excel) and convert them into org charts. OrgCharting can import files in .txt, .cvs, .xls, .xlsx, and .sql formats.
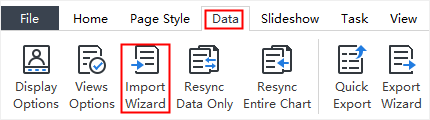
To open the Import Wizard - go to the Data tab and select Import Wizard.
- The data you intend to import must have correct reporting relationships.
- You can move back and forth in the wizard to change your choices before you submit the final import.
Select Sources
To import a data file, launch the wizard and proceed through the following steps.
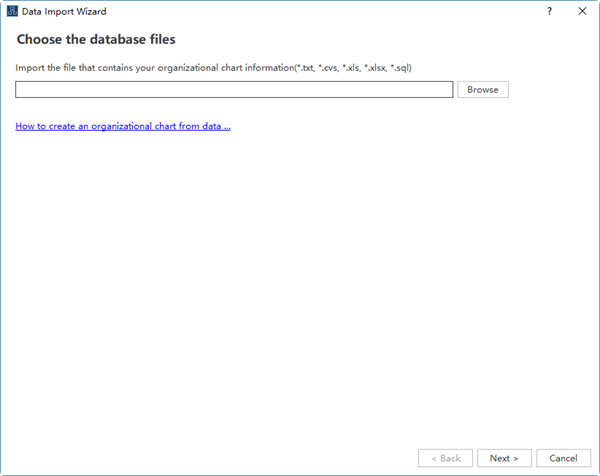
- This step is to choose which file to import (see below).
- Click the Browse button. The Open menu will appear.
- Next - proceed to the next Import Wizard screen.
- Cancel - close the Import Wizard without saving and return to the main work area.
- Get help from "How to create an organizational chart from data...".
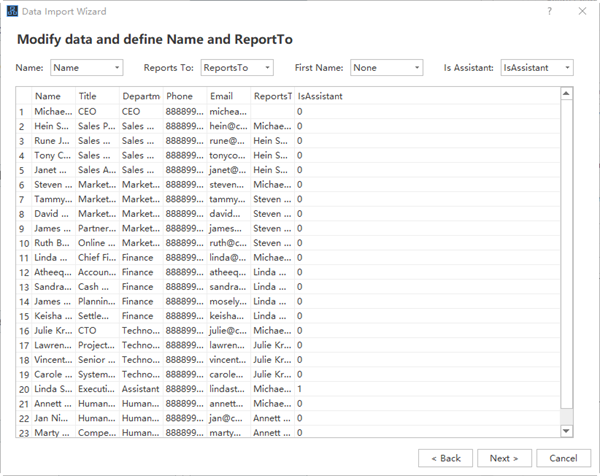
- Modify data and define Name and ReportTo
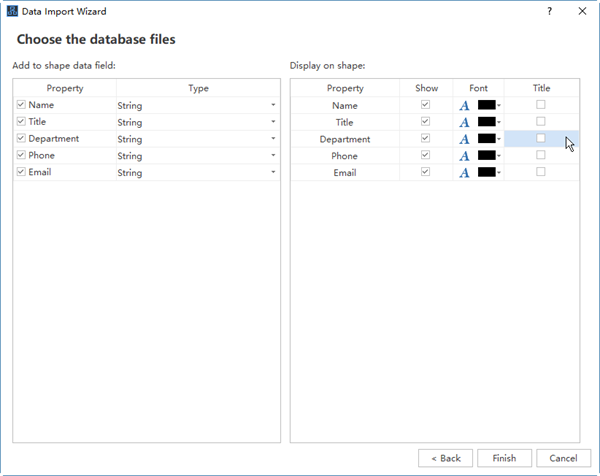
- Set data field and display options
- Click Finish to complete the wizard and return to the main work area.
When you choose the file to import, there will be the following options:
The Display on shape option determines which data fields will be shown in each box of the org chart. OrgCharting shows Name, Title, and Department by default. You can choose to show more data by clicking the check boxes.
Quick Export
(Ctrl + Shift + Q)This function supports to export the data displayed on the chart quickly to the following formats:
- Excel Workbook (*.xlsx)
- Excel 2003 Files (*.xls)
- Text Files (*.txt)
- CSV Files (*.csv)
Export wizard
(Ctrl + Shift + E)Exporting is the process of saving org charts in formats that can be opened and utilized by other programs. You can choose what specific data you want to export. This function supports to export the data displayed on the chart quickly to the following formats:
- Excel Workbook (*.xlsx)
- Excel 2003 Files (*.xls)
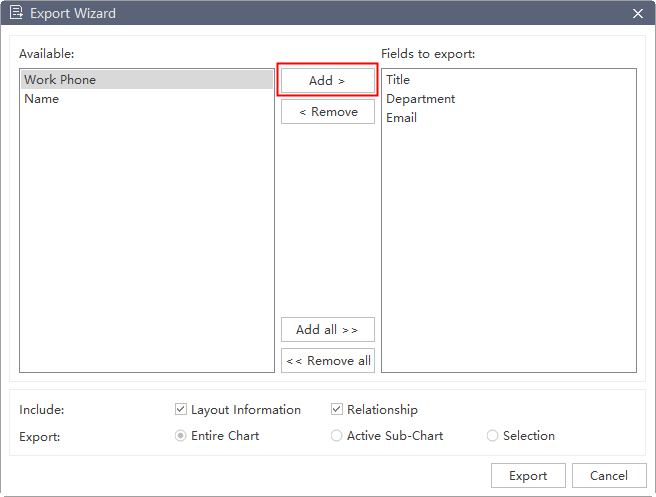
After you have selected the data fields you want to export, you can add them to the "Fields to export" box on the right of the window and click Export to save them in a storage location.
Data Synchronization
OrgCharting provides the latest dynamic project creation through Data Synchronization. This tool can be used to update an org chart's information in almost real-time.
You can constantly update your org chart by linking it to a database which contains your latest information. To enable Data Synchronization function, the information must be imported from an external database file firstly.
After you've created an org chart with the imported file, you can use Data Synchronization under Data tab.
Resync Data Only
(Shift + R)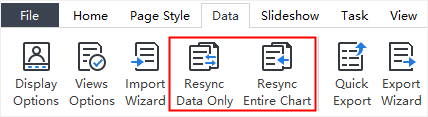
This option only synchronizes data on boxes. It won't change the relationship between the boxes and add or delete shapes.
Resync Entire Chart
(Ctrl + Shift + R)This option can get the whole chart rebuilt according to the updated data source, including the data and the relationships.
Create Slides
In the Slideshow tab, you can create and manage a set of slides for a chart. This can help viewers focus on the specific part of your chart or present the whole chart with different branches.
Once you have created slides, you can display, print, or export these slides to Microsoft PowerPoint.
Create Slides from Chart Automatically
OrgCharting lets you create a set of slides based on the chart branches. All slides can be automatically generated from your chart branches.
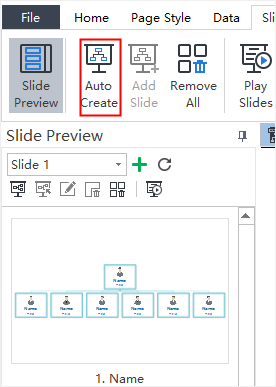
- Go to the Slideshow tab and click the Auto Create button
 .
. - When the slides are created, you can see the thumbnails of the auto-created slides on the Slide Preview panel. The first slide is the top management and the rest of the slides are the branches at lower levels.
Create Slides Manually
If you don't want auto-created slides, you can create them manually and choose which branch or box you want to add into the slideshow.
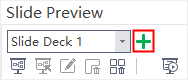
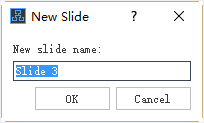
- On the Slideshow tab, click the button New Slide Deck.
- A pop-up window will show to let you name the new slide deck.
- Type the name of your New Slide Deck and click OK.
- A new slide deck is created.
Add and Rename Slide Pages
Add Slide Pages
Once you have created a slide deck, you can add new slide pages to the slide deck. Any shapes or branches could be added as a slide page.
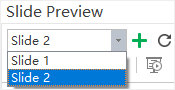
- In the Slide Preview panel, select the Slide Deck you need to add pages.
- Go to your chart, select a branch or shape, and click the Add Slide button on the Slideshow tab.
- The branch or shape will be added as a slide page. You can see it at the bottom of the Slide Preview panel.
Rename Slide Pages
Options of renaming a slide page are as follow:
- Select a slide page from the Slide Preview panel, click Rename button
 on the Slide Preview panel and type your preferred name.
 - Double click the slide page name and edit the name directly.
- Right click a slide in the Slide Preview panel and click Rename in the context menu, you will see its current name turn blue so that you can type your preferred name.
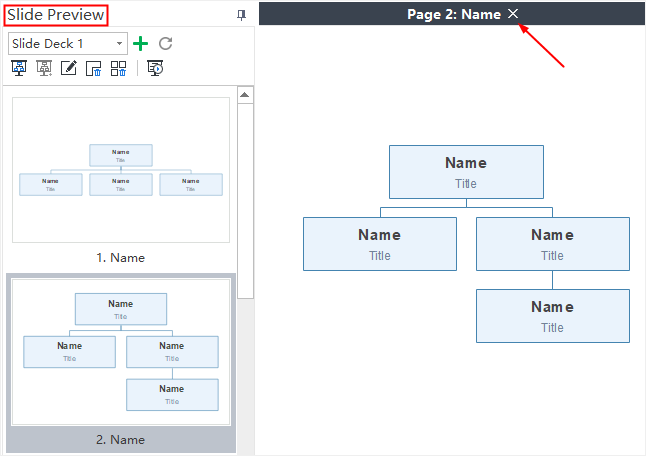
Slide Preview
Once a slide is created, the slide preview panel will open automatically. You can close or reopen the slide preview panel by click the Slide Preview button on the Slideshow tab. Click a thumbnail of the slide page in the Slide Preview panel, and you can preview the full slide page in the main window. Click the close button
 on the top of the main window, and you can close the full slide page.
Reorder and Delete Slide Pages
Reorder Slide Pages
Right-click on a slide preview thumbnail, and click Move Up or Move Down.
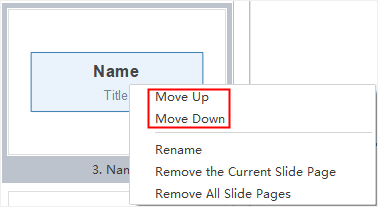
Delete Slide Pages
To delete a slide page, you can:
- Select the slide page in Slide Preview panel and click the Remove Current button
 .
. - Right click the slide in the Slide Preview panel and click Delete the Current Slide Page in the context menu.
Delete the Whole Slide Deck
To delete the whole slide deck, you have the following options:
- Click Remove Slide Deck button
 in the Slide Preview panel
 - Right click the slide in the Slide Preview panel and click Delete All Slide Page in the context menu.
- Click Delete the Current Slide Deck in the context menu.
Display a Slide Show
Click the Play Slides button on Slideshow tab or on Slide Preview panel to start a slideshow from the first slide.
Navigate Slides
There are 3 ways to navigate your slides in slide show view:
- Press the Down or Right arrow of your keyboard to jump to the next slide. Press the Up or Left arrow to go back to the previous slide.
- Click your mouse once on anywhere of the screen to jump to the next slide.
- Move the cursor on the lower part of the canvas, a toolbar with seven buttons will appear. Click the up and down arrow buttons to navigate your slides.
Click the following buttons to achieve corresponding effect:
 Broadcast automatically.
 The previous page.
 The next page.
 Zoom in.
 Zoom out.
 Fit in view.
 Close the slide show.
Exit
You can end the slide show by pressing the Esc key on your keyboard, or click the Close button on the slide show toolbar.
Traverse Boxes or Branches
(F5, Shift + F5)In the full-screen mode, you can navigate and highlight specific boxes or branches with the direction arrow keys.
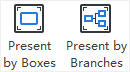
- You can click the Present by Boxes or Present by Branches option.
- You can also click the Full Screen icon on Slideshow tab to view your document in full screen mode.
Export and Print Slides
Export Slides to Microsoft PowerPoint
You can export the slide show to Microsoft PowerPoint format. Simply click Export Slides to PPT button .
.
Print Slides
- Click the Print Slides button on the Slideshow tab, or on the Quick Access Toolbar, then you can see the print setting and preview interface.
- Set your printing options and then click the Print button.

Gantt Chart View and Options
Use Gantt Chart View
Gantt chart is effective for monitoring project status and progress. You can manage task information directly in the Gantt Chart view.
- Click the Task tab on the Ribbon.
- Click the Gantt Chart button to create a Gantt Chart.
Modify Task Info in Gantt View
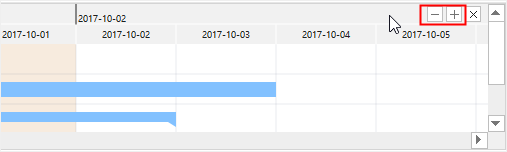
Each task is presented as a taskbar in the Gantt Chart. You can move or drag a taskbar to change its start and end date. You can also build task dependency in the Gantt Chart view.
- Rename a Task
- Change Task Start and End Date
- Build a Task Dependency
- Change the Date Unit
Double-click the cell in the Task Name column to rename the task.
Drag the right border of the bar to change the bar length. You can also select and move the whole bar to change its position on the calendar.
Click on a taskbar, then hold the mouse and drag it to another taskbar to build a relationship.
Click the "+" and "-" button in the top right corner to change the date unit.
Set Gantt Chart Options
You can set many task details such as date formats, major and minor units, workdays, start and finish time, etc. Simply follow the below steps to set your Gantt chart.
- Click the Gantt Option button in the Task tab.
- You can set the following options for your Gantt chart.
a.Select a date format in the drop-down menu.
b.Tick the workdays from Monday to Sunday.
c.Select the Major Unit and the Minor Unit in the corresponding drop-down menu.
d.Set the Task Duration in the corresponding drop-down menu.
e.Set the Start Date/Time and the Finish Date/Time in the corresponding drop-down menu.
Set Milestone
If tasks are set, you are allowed to set milestones for your tasks. Go to the Task tab on the ribbon and click the Milestone button, then the selected taskbar will be shifted to a diamond shape icon.
Export Gantt Chart
The Export Gantt Chart option will help you save the Gantt chart in PDF format, which is convenient for users to print or share the Gantt chart with others.
- Go to the Task tab on the ribbon and click the Export Gantt Chart button.
- Input a name of your Gantt chart in the pop-up window.
- Click the Save button.
Find and Replace
Find & Replace option can help you check the specific word within the whole org chart, including employee names, titles, notes, comments, departments, salaries and so on.
- Go to the Home tab and click the Find & Replace button. A pop-up dialogue will show up.
- Type the content you intend to find in the find column, and click the Find icon
 .
. - Type the content you intend to replace in the Replace column, and click the Replace icon
 .
.
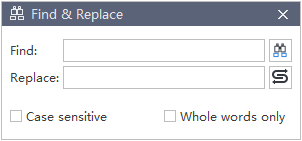
- If you want to filter capital words only, you can click Case sensitive for precision.
- If you want to reduce the scope of finding, please click Whole words only.
Spelling Check
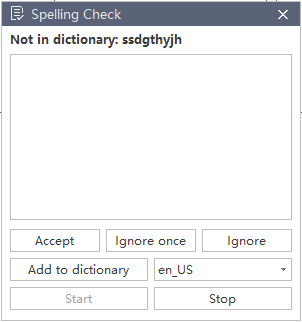
Spelling check function of OrgCharting helps you diagnose spelling mistakes and offer suggestions for correct spellings.
- Go to the Home tab and click the Spelling Check button
 .
. - If there are mistakes in your file, the Spelling Check dialogue will show up with recommended spellings for you to choose.
- Type the content you intend to replace in the Replace column, and click the Replace icon.
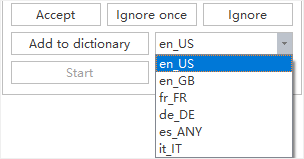
- Choose one of the listed recommendations and click Accept, or Ignore if the word is not wrong.
- Once you click the Accept or Ignore, it will jump to the next spelling mistake until there are no mistakes.
- For the word which is correct but not in the dictionary, you can click Add to Dictionary, so that it won't be treated as a wrong word next time.
Undo and Redo
OrgCharting provides undo and redo actions for users.
Undo is used to reverse your last action. Click Undo button on the quick access toolbar, or press Ctrl + Z.
Redo is used to do any undo function again. Click Redo button on the quick access toolbar, or press Ctrl + Y.
Open, Find and Recover an Org Chart
Open an Org Chart
To open an org chart made by OrgCharting, you can:
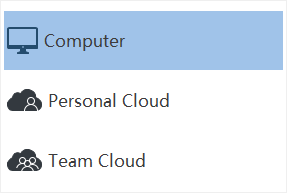
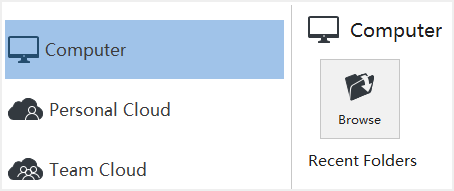
- Go to the File tab and click Open, then you can choose to open an org chart from Computer, Personal Cloud, or Team Cloud.
- Drag an org chart and drop it on the top of the program.
Find and Recover an Auto Saved File
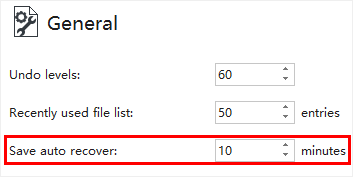
OrgCharting creates an auto-saved temp file for users in case they didn't save the files due to unexpected computer shutdown or software crash. Users can set a time-frequency for each autosave. The default setting is to save in every 10 minutes.
Set Auto-Save Time Period
- Go to the File tab, click Options>General.
- Input a time period in the Save Auto Recover option.
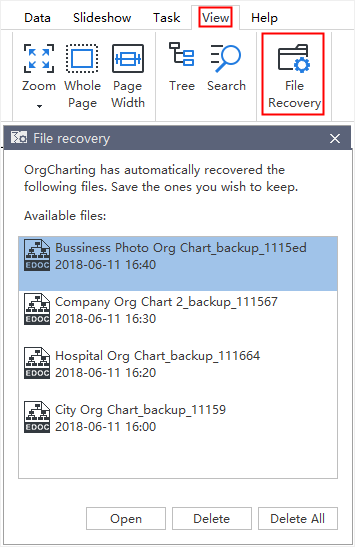
Find Auto Saved File
- Go to the View tab, click the File Recovery button.
- Find your auto saved files from the file recovery list.
Save and Export an Org Chart
Save an Org Chart
(Ctrl + S, Ctrl + Shift + S)You can save your org chart via the Save or Save As options.
- Go to the File menu, then click Save or Save As.
- Enter a name and choose a storage location to save your file. The storage location can be the local disk, personal cloud, or team cloud.
Export an Org Chart
You can export your charts to different formats, including PDF, Microsoft Office, Graphics, Html, and SVG.
Export to Graphic Format
You can export your org charts to graphic formats including .jpg, .png, .bmp, .gif, .ico, .tif, .ppm, etc.
- Go to the File tab.
- Click Export & Send.
- Click Graphics.
- From the "Save as type" list, choose a graphic format and save.
Export to PDF
You can export your org charts to graphic formats including .jpg, .png, .bmp, .gif, .ico, .tif, .ppm, etc.
- Go to the File tab.
- Click Export & Send.
- Click PDF, PS, EPS option.
- Choose PDF Vector Format to export org charts.
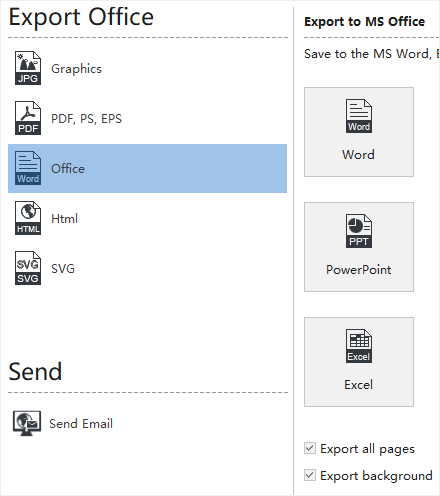
Export to Editable MS Office File
This feature lets you export org charts to editable MS Office files including.docx, .pptx, and.xlsx.
- Go to the File tab.
- Click Export & Send.
- Click the Office option.
- Choose Word, PowerPoint, or Excel.
Export to Html
- Go to the File tab.
- Click Export & Send.
- Click Html button.
Export to SVG Format
- Go to the File tab.
- Click Export & Send.
- Click the SVG option.
Print and Share an Org Chart
Print an Org Chart
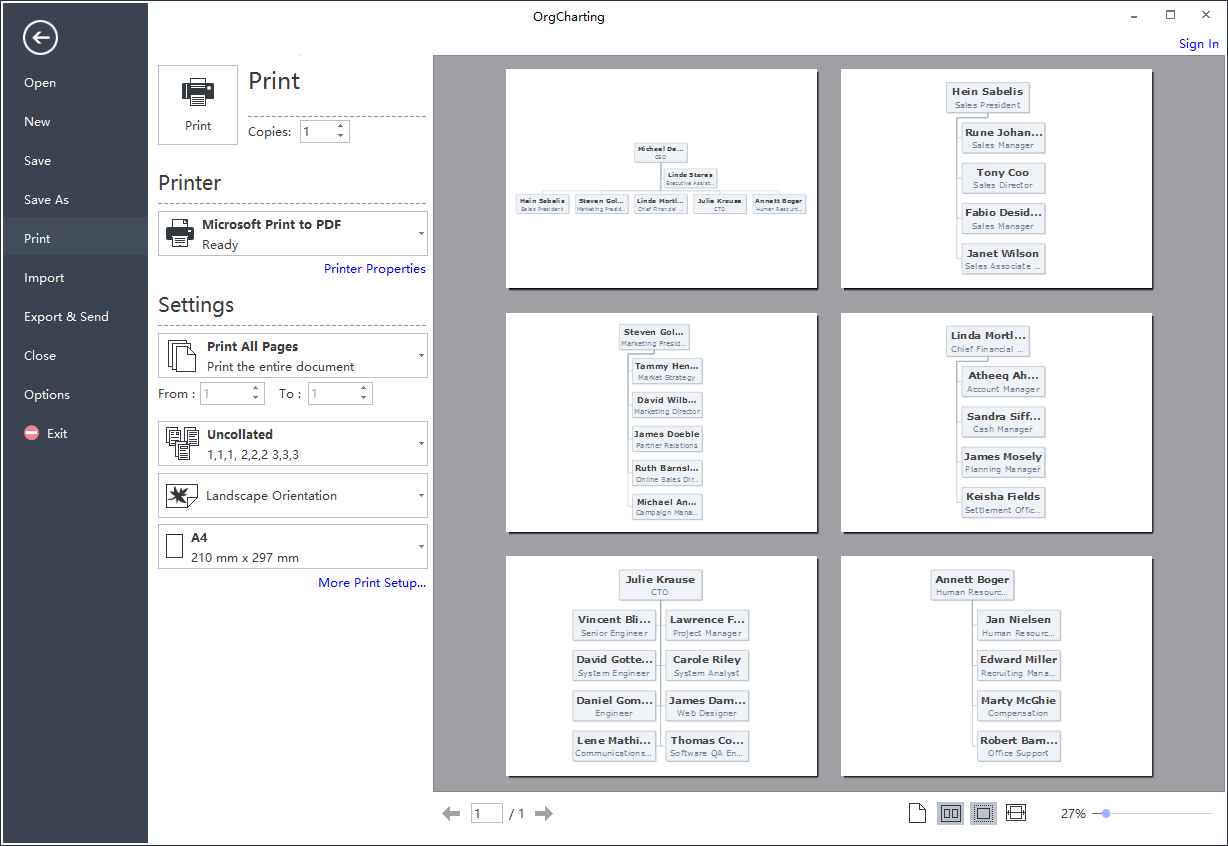
Go to the File tab, and click the Print button to print a chart; or click the print button in the Quick Access Toolbar.
Orientation
Specify the paper orientation as portrait or landscape.
Paper Size
Shown in the list are the paper sizes supported by the current printer as well as industry standard sizes.
Print Setup
Click the File tab, click the Print, and then click the More Print Setup… to set the print options.
Adjust to
If the drawing page is larger than the size of the single printing paper, the diagram will be printed onto multiple pieces of paper. So you need to adjust the size of the drawing page to a specified proportion for printing.
Fit to
Fits each drawing in the print job on the length and width of the specified number of sheets. The drawing will be enlarged or reduced according to the number of pages and the margins you specified. If the length and width of pages are not proportional to the drawing's dimensions, only those sheets that are needed to maintain the drawing's proportion will be used.
Share an Org Chart
Once you have drawn an org chart, you can share the link with your colleagues and friends who have not installed OrgCharting, so they can view the org chart in anywhere and anytime.
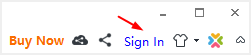
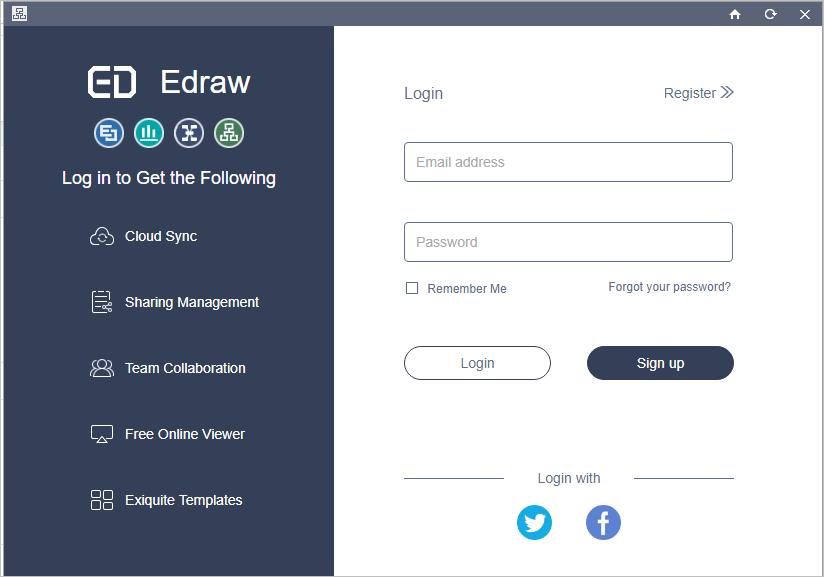
Sign Up an OrgCharting Account
- Click Sign In button on the top right of the user interface.
- Click Sign Up to register an account.
Share Your Org Chart
- Click Share button on the top right of the user interface.
- Click Copy to share the link.
- Scan the QR Code to share the specific link.
- Copy the HTML code when using org charts in HTML.
Set Share Management Options
- Click Share Manager button in the top right corner of the user interface.
- Click the File you want to modify.
- Click the Expire Time drop down menu to set expiry time.
- Click Copy Link button to share the links.
- Click Cancel Share to stop sharing with others.
Tree Outline and Whole Page View
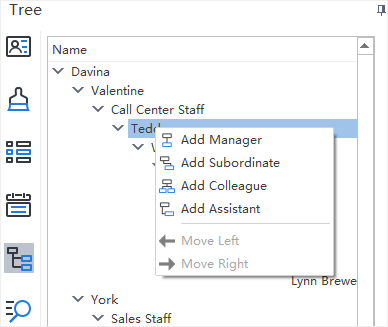
Tree Outline
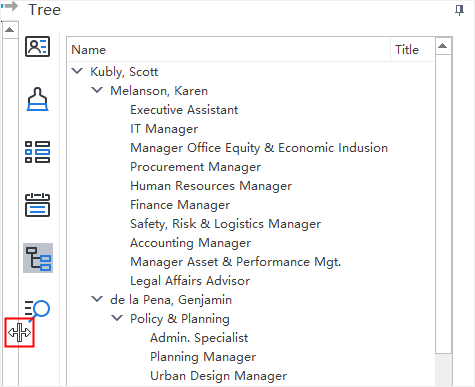
The Tree Outline View allows you to edit Data Field which synchronizes with the org chart in the work area.
The operations are as follow:
- Click Tree button
 in the View tab or right side panel. The Tree Outline View will show up.
 - Double click the name and type to edit the content of Data Field. You can also move the box or add managers, subordinates, colleagues and assistants to the box in Tree Outline View.
- If you need to close the Tree Outline View, click the Hide Panel button
 on the top right of the panel.
 - Choose Word, PowerPoint, or Excel.
To change the size of Tree Outline View panel, follow these steps:
- Place the mouse pointer over the edge of a panel.
- When you see a pointer composed of a line and two arrows pointing to opposite directions, you can drag the pointer to resize the panel.
Whole Page
(F3)Zoom the page so that the entire page, both vertically and horizontally, can be displayed on the screen.
- Click Whole Page button in the View tab.
- Click the Whole Page button on the status bar.
Rulers, Gridlines, Action Button and Status Bar
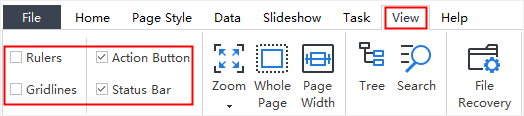
On the View tab, you can choose to show or hide rulers, grid lines, action button and status bar that may assist your OrgCharting work.
Rulers
Each drawing window has vertical and horizontal rulers that show the scale of the drawing.
Gridlines
The gridlines help users to position shapes more precisely.
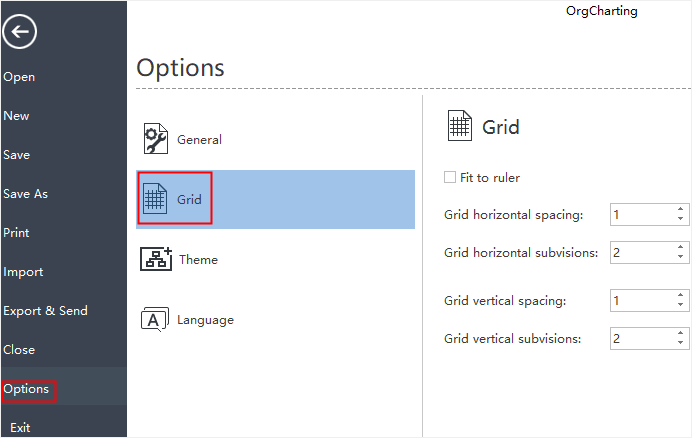
Open File menu, click Options, and choose Grid. You can set grid spacing and subdivision by clicking the up and down buttons or entering a number.
Action Button
The Action Buttons float around each box to assist your drawing work. There are two types of Action Buttons in OrgCharting.
The is used to add managers, colleagues and subordinates.
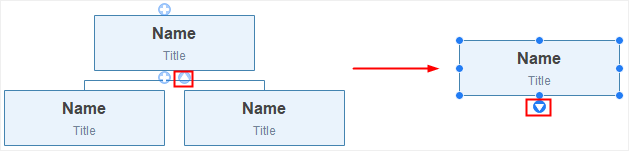
The


 four buttons are used to collapse and expand the chart to different directions.
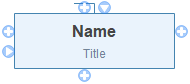
If you hide the Action Button, the box looks as the appearance below.
Status Bar
The Status Bar is a horizontal bar at the bottom of the window, showing the information about the program and the document being edited.

Other View Options
Zoom
Open the Zoom dialog box to specify the zoom level of the document. In most cases, you can also use the zoom control in the Status Bar.
- On the View tab, click Zoom button and choose a zoom percentage.
- On the Status Bar, drag the Zoom slider.
- Press Ctrl+ + for Zooming in. Press Ctrl+ - for Zooming out.
- Press Ctrl key while scrolling the mouse wheel to zoom in and out.
Page Width
(Shift + F3)Zoom the page so that the width of the page matches the width of the window. Options are:
- Click Page Width button in the View tab.
- Click Page Width button on the status bar.
File Recovery
The File Recovery function shows the file recovery panel and finds auto-recovery files.
Collapse and Expand Boxes
You can collapse and expand branches of individual boxes interactively by using the and icons that appear around the boxes.
Keyboard Shortcuts
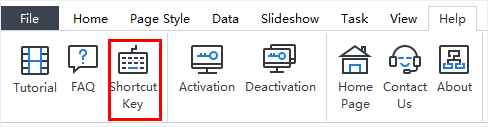
You can find the list of keyboard shortcuts any time on the ribbon's Help tab by clicking the Shortcut Key icon.
Documents
| Function | Shortcuts |
|---|---|
| Create a new chart | Ctrl + N |
| Open a chart | Ctrl + O |
| Save the current chart | Ctrl + S |
| Save all charts | Ctrl + Shift + S |
| Close current chart | Ctrl + W |
| Close all charts | Ctrl + Shift + W |
| Print the current chart | Ctrl + P |
Navigating
| Function | Shortcuts |
|---|---|
| Select box (above, below, left and right) | Arrow keys |
| Select next box / previous box | Tab / Shift + Tab |
| Save the current chart | Ctrl + S |
Window
| Function | Shortcuts |
|---|---|
| Zoom in | Ctrl + + (plus) |
| Zoom out | Ctrl + - (minus) |
| Fit chart to screen | Ctrl + F5 |
| Fit chart to 100% zoom | Ctrl + 0 |
| Whole Page | F3 |
| Page Width | Shift + F3 |
View
| Function | Shortcuts |
|---|---|
| Ruler | Ctrl + Shift + U |
| Gridlines | Ctrl + Shift + G |
| Status Bar | Shift + B |
| Action Button | Ctrl + Shift + A |
Interface
| Function | Shortcuts |
|---|---|
| Show / Hide Display | F6 |
| Show / Hide Views | F9 |
| Show / Hide Tree | F10 |
| Show / Hide Data | F8 |
| Show / Hide Search | Ctrl + Shift + F |
| Spelling check | F7 |
| Find | Ctrl + F |
| Preview | F11 |
Slideshow
| Function | Shortcuts |
|---|---|
| Play slideshow | Ctrl + Shift + F5 |
| Traverse boxes | F5 |
| Traverse branches | Shift + F5 |
| Full Screen | Ctrl + F5 |
| Exit Full Screen Mode or Stop Slideshow | Esc |
Adding Box and Elements
| Function | Shortcuts |
|---|---|
| Add first box | Enter |
| Add Subordinate | Insert / Ctrl + Enter |
| Add Colleague | Enter |
| Add Manager | Shift + Enter |
| Add Assistant | Alt + Enter |
| Add attachment | Ctrl + H |
| Insert picture | Ctrl + Shift + P |
| Add hyperlink | Ctrl + K |
| Add comment | Ctrl + Shift + T |
| Add note | Ctrl + T |
| Optimize Layout | Ctrl + Shift + O |
Data
| Function | Shortcuts |
|---|---|
| Refresh data | Shift + R |
| Associate data | Ctrl + Shift + R |
| Define field | Ctrl + D |
| Quick export | Ctrl + Shift + Q |
| Import | Ctrl + Shift + I |
| Export wizard | Ctrl + Shift + E |
Editing and Selecting
| Function | Shortcuts |
|---|---|
| Undo the last action | Ctrl + Z / Alt + Backspace |
| Redo the last action | Ctrl + Y |
| Select all boxes and elements | Ctrl + A |
| Select all branches | Ctrl + Shift + B |
Cut, Copy, Paste and Delete
| Function | Shortcuts |
|---|---|
| Cut | Ctrl + C |
| Copy to the clipboard | Ctrl + C / Ctrl + Insert |
| Format Painter | Ctrl + Shift + C |
| Paste | Ctrl + V |
| Selected Paste | Ctrl + Alt + V |
| Delete current object | Delete |
| Delete Current Branch | Shift + Delete |
Commands in Box Text Edit and Find Mode
| Function | Shortcuts |
|---|---|
| Enter line break in box | Shift + Enter / Ctrl + Enter |
| Move to beginning of line | Home |
| Move to end of box text | Ctrl + Home |
| Cancel editing box | ESC |
| Find | Ctrl + F |
| Edit box text | F2 |
| Find next | Enter |
| Spelling check | F7 |
Formatting
| Function | Shortcuts |
|---|---|
| Toggle to bold and back | Ctrl + B |
| Toggle to italics and back | Ctrl + I |
| Toggle to underline and back | Ctrl + U |
| Increase font size | Ctrl + Shift + > |
| Decrease font size | Ctrl + Shift + < |
| Edit text | F2 |
| End Formatting | Esc |
Layout
| Function | Shortcuts |
|---|---|
| Toggle up | Ctrl + Shift + F4 |
| Toggle right | Ctrl + F4 |
| Toggle down | F4 |
| Toggle left | Shift + F4 |
| Move to left | Ctrl + Left Arrow |
| Move to right | Ctrl + Right Arrow |
General Windows Commands
| Function | Shortcuts |
|---|---|
| Close a menu or dialogue box | Esc |
| Cancel an operation | Esc |
| Exit OrgCharting | Alt + F4 |
| Export to graphics | Ctrl + G |
| Show help | F1 |

