Edraw Support Center
Get quick answers and step-by-step instructions in our support center.
Create a Gantt Chart from Data
If you have your project data saved in a document (.txt, .csv, .xls, and .xlsx), and the data in the data set is arranged in a fixed format.
Open a new document, click Import on the right Gantt Chart pane. On the first page of the pop-up window, choose the file that contains the project plan data, and then click Next.
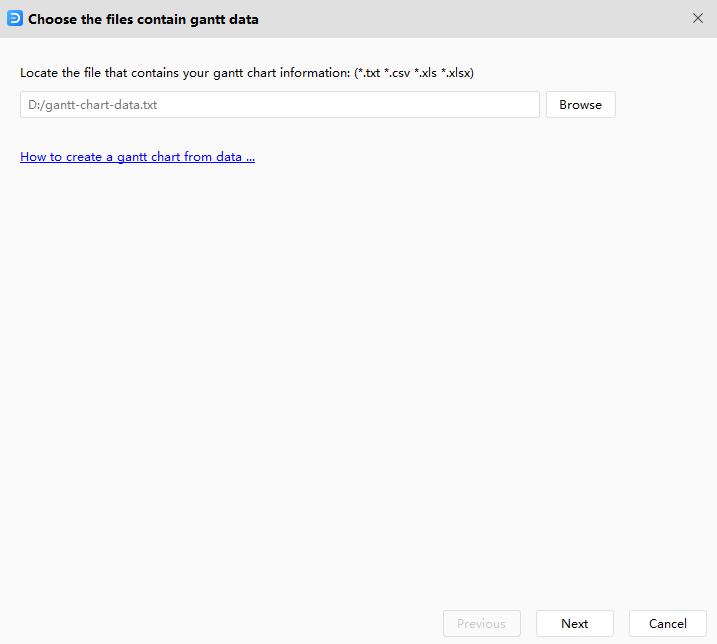
Note: The data set must have the columns for task name, task start date and task finish date.
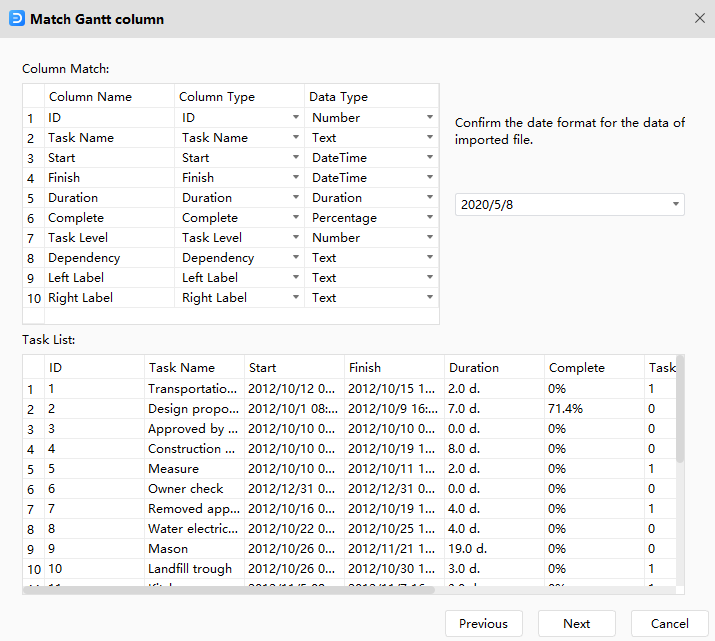
On the second page of the window, confirm the date format, column name, column type and data type. There you can preview your data set in the worksheet of Task List.
| Column Name | Specification |
| ID | [Optional] Unique identifier of the task, if there is not this column in your data file, EdrawMax will add a numbered list, this unique identifier is used for Dependency. |
| Task Name | The description of the task. |
| Start | The date that you start to work on the task. |
| Finish | The date that you finish working on the task. |
| Duration | [Optional] duration time of a task, if there is not this column in your data, Edraw will calculate the duration value from Start and Finish. |
| Complete | [Optional] The percentage value of task complete. |
| Task Level | [Optional] Identify the task or sub-task with an integer value. Level 1 task is a sub-task of level 0 task. |
| Dependency | [Optional] Help define relationships between tasks. |
| Resource | [Optional] Task resource. |
| Cost | [Optional] Task cost. |
| Resource | [Optional] Task resource. |
| Hyperlink | [Optional] Hyperlinks to other source files. |
| Priority | [Optional] Indicate task priority with an integer value from 0~5. |
| Left Label | [Optional] Text label for task. |
| Right Label | [Optional] Text label for task. |
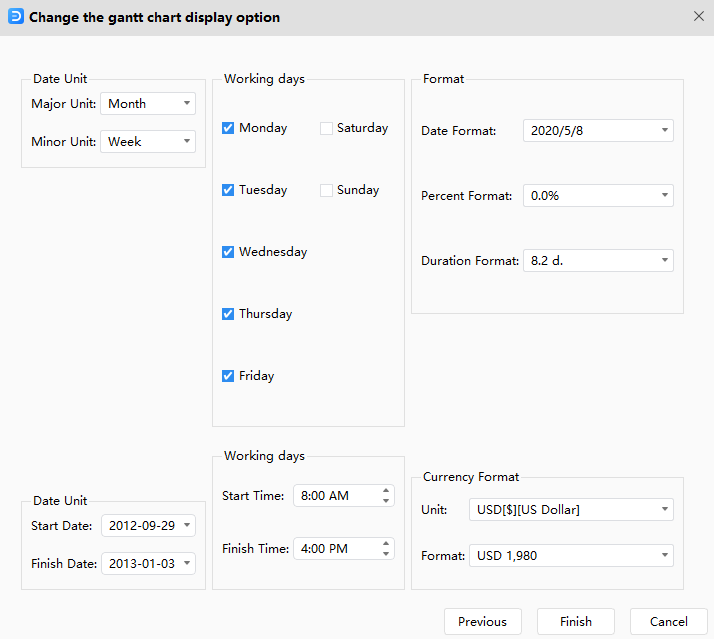
On the third page of the window, set various data formats for your Gantt chart.
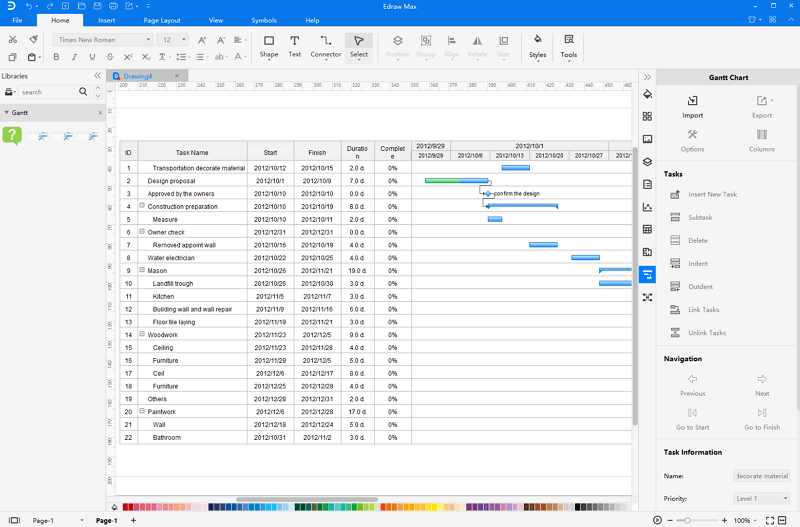
Therefore, you will get a Gantt chart that comes from your project data.