Edraw Support Center
Get quick answers and step-by-step instructions in our support center.
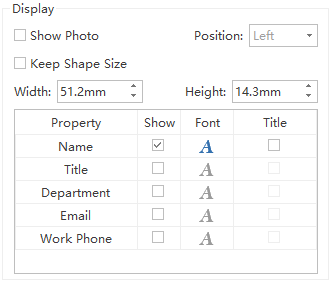
Display Options
The Display Options panel allows you to choose which kind of data will be displayed in the current view. It also lets you set the width, height, photo position, content layout, interval, etc.
Select a box and go to the Display Options on the right panel to open the Display Options menu.
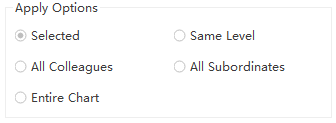
Apply Options
The Apply Options panel allows you to quickly set the ranges and locations of the changes in your chart. With a single mouse click, you can affect everything from the data in the individual box to the look of selected boxes, same level boxes, all colleague boxes, all subordinate boxes, and even the entire chart.
Display
The Display menu determines the visual appearance of the data in a box. You can check or uncheck the Show box on the right of each property to make the data visible or not.
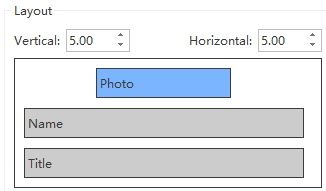
Layout
The Layout option determines the layout and alignment of the data inside a box.
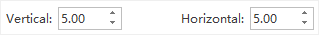
Distance
The “Vertical” and “Horizontal” refers to the interval of the content blocks. The unit of the distance is millimeter and the default value is 5 in both horizontal and vertical direction.
To adjust the default distance value, you can:
- Click the up arrows and down arrows to increase or decrease the number.
- Press Enter to set your adjustment to your chart.
- Or input the number you need in the blanks directly and press Enter.
Tipps:
To change the distance between boxes of a certain part in the chart, select the certain boxes first and then follow the steps above.
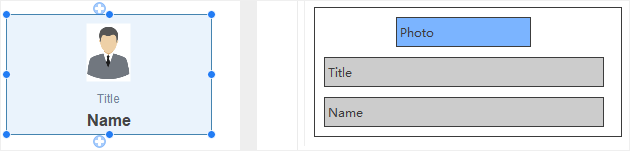
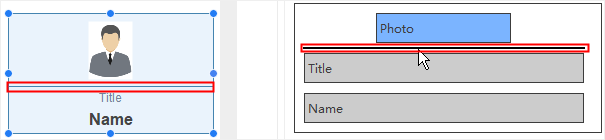
Change Data Layout Inside a Box
- Select the target box, and the current data layout inside the box appears on the Layout window.
- Drag the bar in the Layout window to re-align the data elements in the box. The red line reminds you where you can drop the bar.
- After you’ve finished the realignment, you can see the updated box in both the canvas and the Layout window.
Tips:
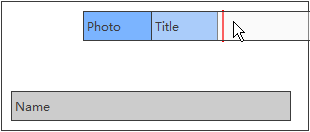
In OrgCharting, you can add a separation line between two adjacent content sections.
- Hover the pointer on the blank gaps between the two content sections and a black line appears.
- Click the black line, and a border line will appear in the box accordingly.
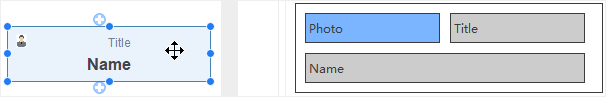
Show Photos on a Box
- Select a box.
- Click the Display Option on the right panel.
- Tick the Show Photo box.
- Change the position of the photo by selecting the drop-down menu of the Position. It determines whether the photo will be aligned.
Change a Box Size
You have 2 ways to change a box size.
- Select a box, then drag and drop the blue handle at the corners of the box to change its size.
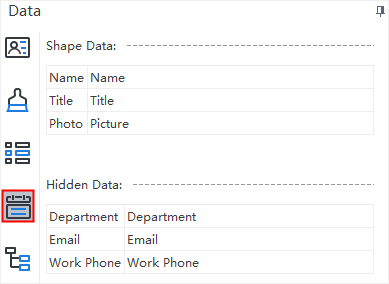
- Select a box and go to the right sidebar, then click the Data button
 . The menu displays the shape data and hidden data as in the example below.
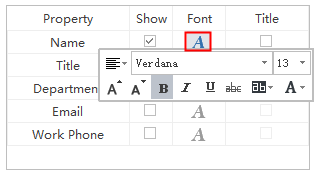
Change Font for Each Data Field
Each data field of the box could be adjusted based on the following simple steps:
- Select a box.
- Click the Display Option on the right panel.
- Click the Font button to change a single data field.
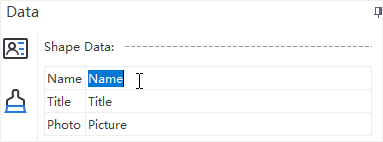
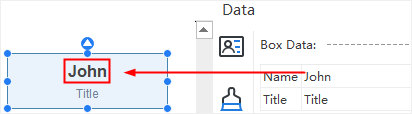
Display and Edit Data of a Box
- Select a box and go to Right Side Bar, then click Data button. The menu displays the visible box data and hidden box data as in an example below.
- Double click the data you want to edit and type in the correct information.
Search Data
To search a box that contains specific data, you can use Search option.
