How Can EdrawMax Add Value To Your Work?

Why are diagrams important?
Picture the following scenario: you are writing a report to your supervisor detailing your branch’s performance. You have all of the numbers in front of you. How best to present these numbers? You can’t just simply write about the numbers - it would be far too long and complicated, especially when it comes to comparisons between different variables.
This is why drawn graphs and diagrams are so important in your work. They allow you to quickly provide information and facilitate analysis in a way that words simply cannot. But the beauty of graphs and diagrams is that they can be used in every stage of a working process.
- In the planning or preparation stages, diagrams can be used to map out project plans and outlines. For example, an architect would create a floorplan for clients looking to renovate their apartment.
- During the working process, mind maps and similar diagrams can be used for brainstorming purposes to inspire creative solutions to persisting problems.
- After a project or process has been completed, graphs and charts can be used to present the results. Depending on your line of work, this can be helpful for analysis, comparison, evaluation and appraisal purposes.
How Can EdrawMax Add Value To Your Work?
As established, graphs and diagrams serve a wide variety of purposes, but they do not have to be complex; on the contrary, you should make them as clear and readable as possible. As such, they can be used by anyone, from young students to seasoned professionals, to display data. Here are some situation-specific benefits of graphs and diagrams.
- For students, it is often the best way to display the results of science experiments, or plot data points in maths assignments.
- For office workers, presenting data using graphs and charts to different company stakeholders if often a must.
- For sports coaches, using charts such as radar charts is a great way of identifying the strengths and weaknesses of your players.
- For software developers, there is no better way to simplify a complex piece of software for your client than to use certain diagrams.
While all graphs and diagrams serve a purpose, some are better suited to certain lines of work. For example, a marketing professional might not use the same types of graphs as an engineer might. So which graphs should you use? Here are 9 different roles and the different types of graphs that are most commonly used in them.
Marketer
- Marketing Funnel
- SWOT
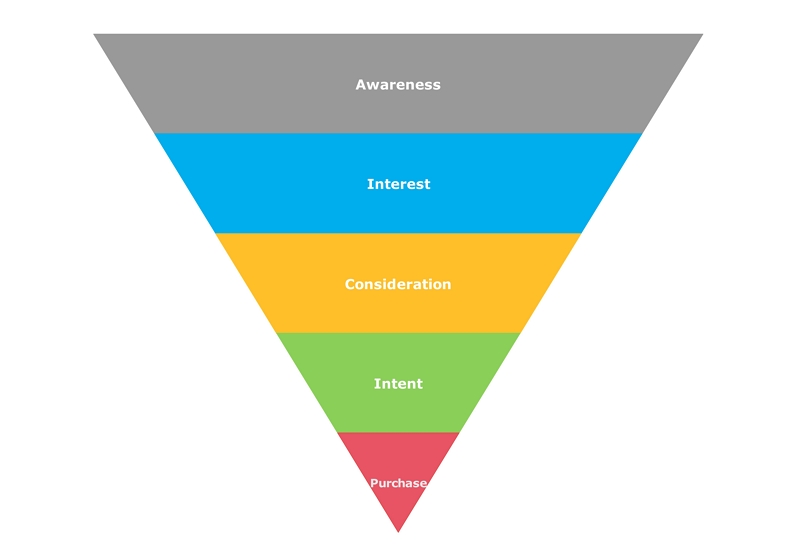
As a marketer, this is your bread and butter. A marketing funnel allows you to visualize your customer’s journey using your product or service, from the moment they find out about you to the point where they are a paying customer.
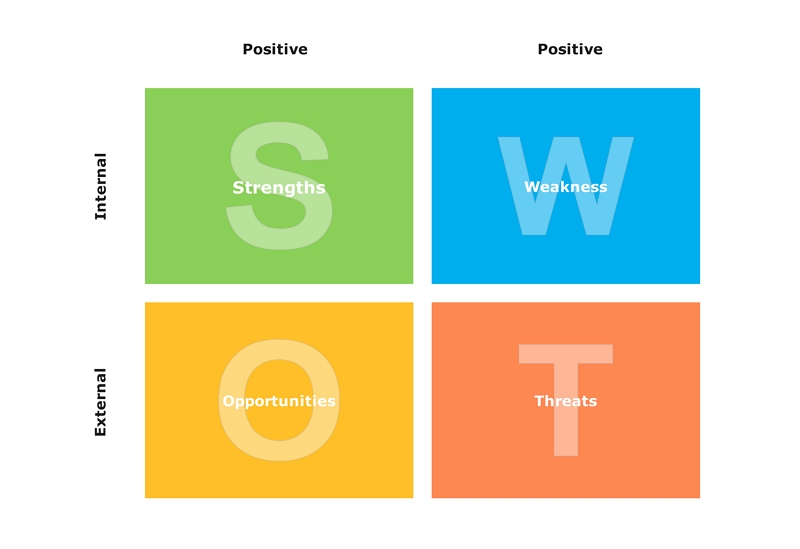
Using a SWOT (Strengths, Weaknesses, Opportunities, and Threats) analysis allows you to identify internal and external factors that could impact the outcome of your marketing efforts.
Product Development
- iPhone UI Wireframe
- Sitemap

Product developers use wireframes to map out what apps and programs will look like on the iPhone and other mobile devices.
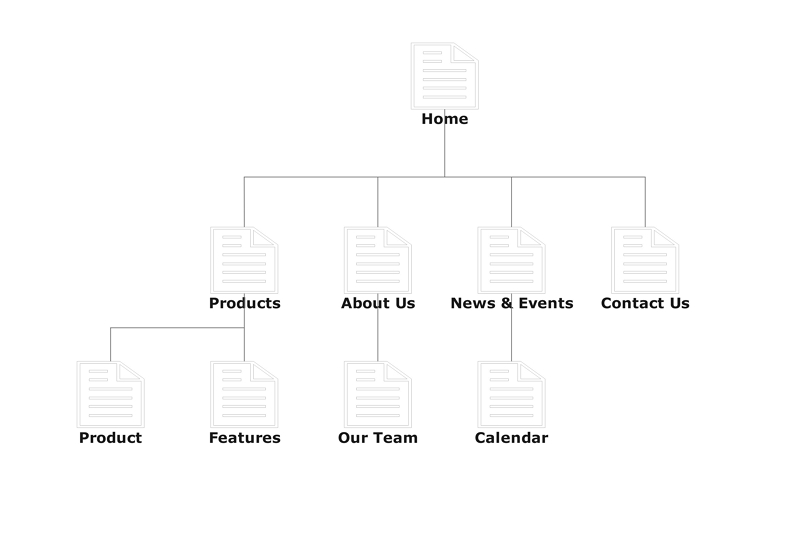
When creating a website, you will use a sitemap to list out all of the pages of your website. Search engines, such as Google, will crawl through your site based on the information provided.
Engineer
- Circuit Diagram

Engineers use circuit diagrams to show all of the components in an electrical circuit. This is useful for designing, creating and maintaining electronic equipment.
Human Resources
- Org Chart
- HR Process Flowchart
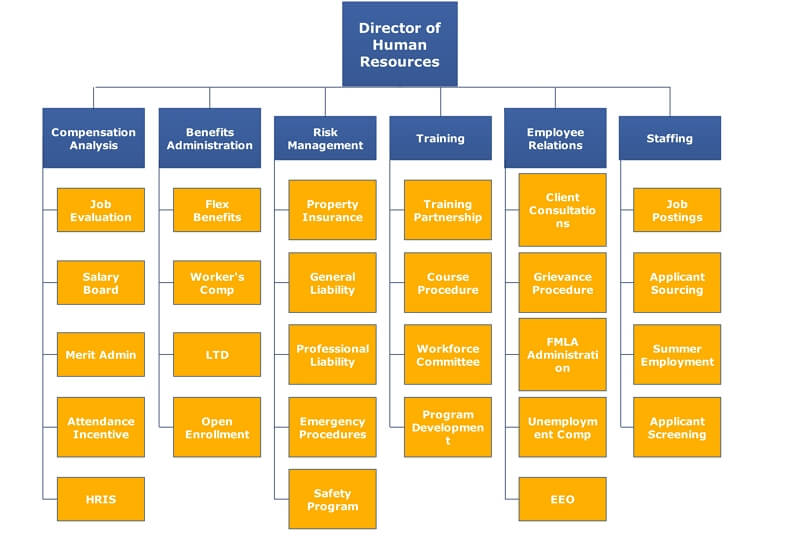
An HR Org Chart informs people within an organization on who is responsible for what tasks. It is useful for when you need to know which person or department to contact in a pinch.
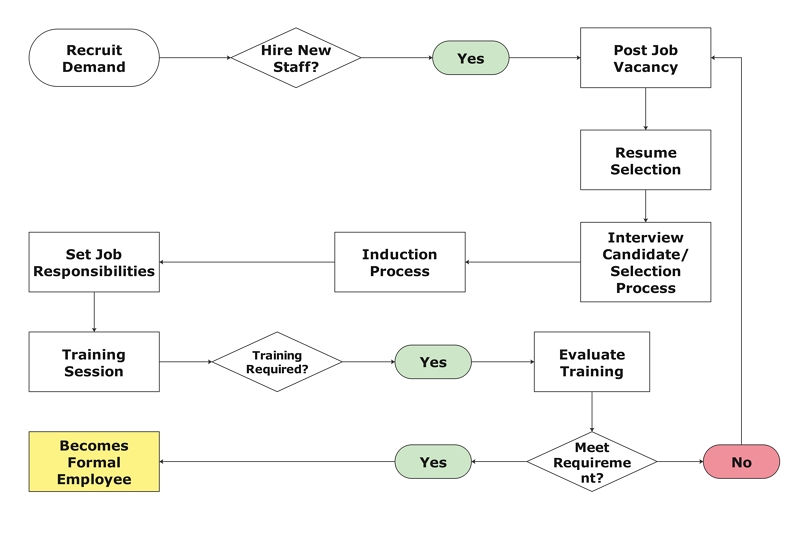
HR process flowcharts not only remove any uncertainty or guess-work required in the HR process, but also encourage companies to take a more digital approach to their HR processes.
Educator & Student
- Mind Map
- Venn Diagram
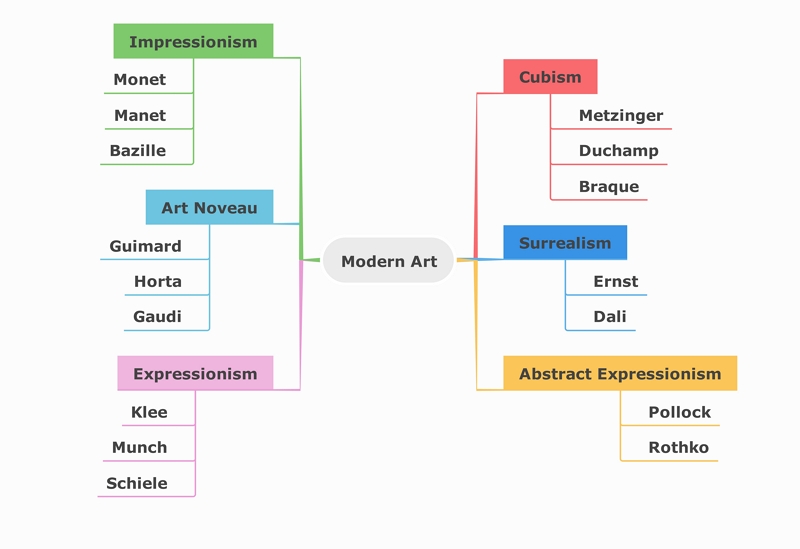
A basic, but essential, diagram for students and teachers alike. It allows students to get creative and brainstorm ideas.
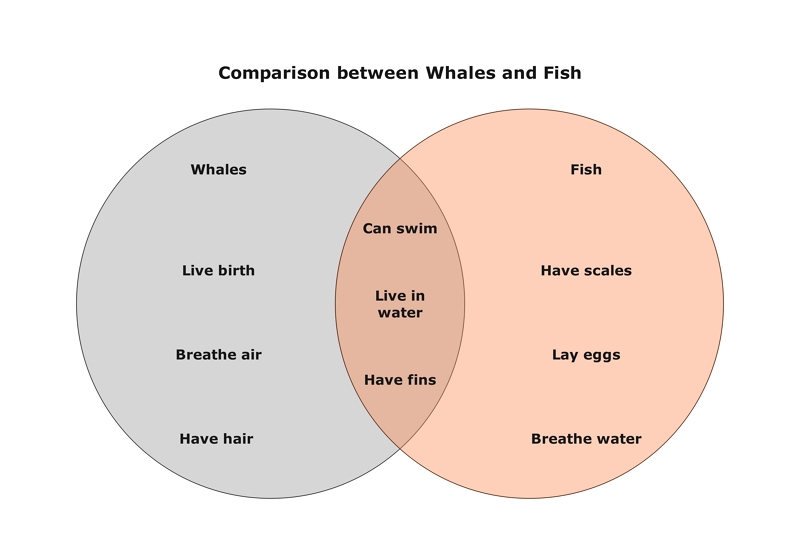
Venn diagrams are incredibly versatile - they can be used for general brainstorming exercises, and even have mathematical applications.
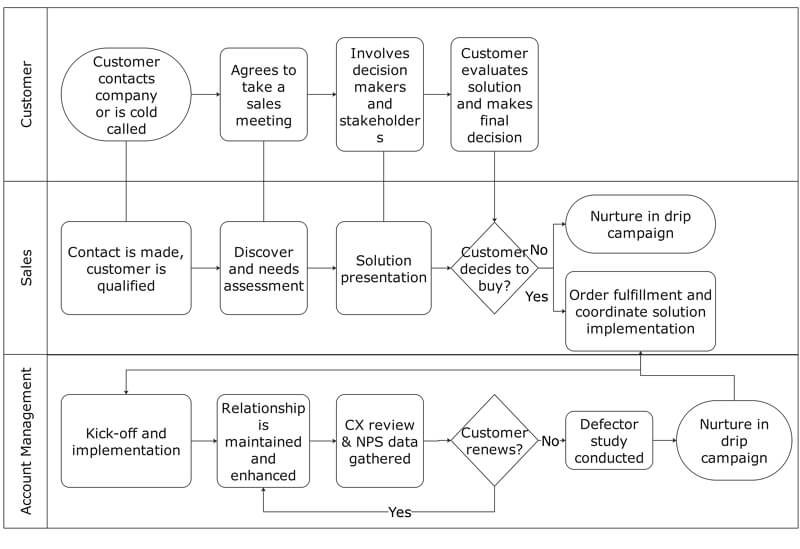
Businessman/woman
- Swimlane Flowchart
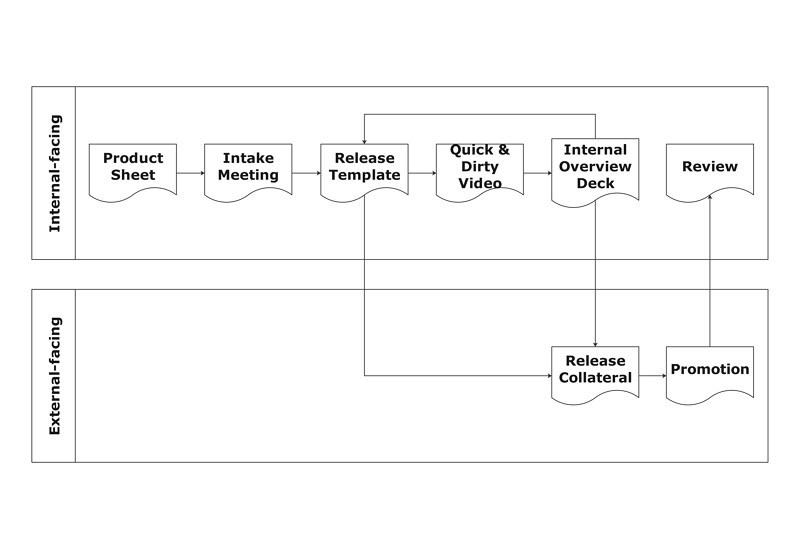
Swimlane Flowcharts are a useful tool for businesses looking to get an overview of how different departments interact and collaborate to achieve a certain task.
IT Developer
- Sequence Diagram
- AWS Architecture Diagram
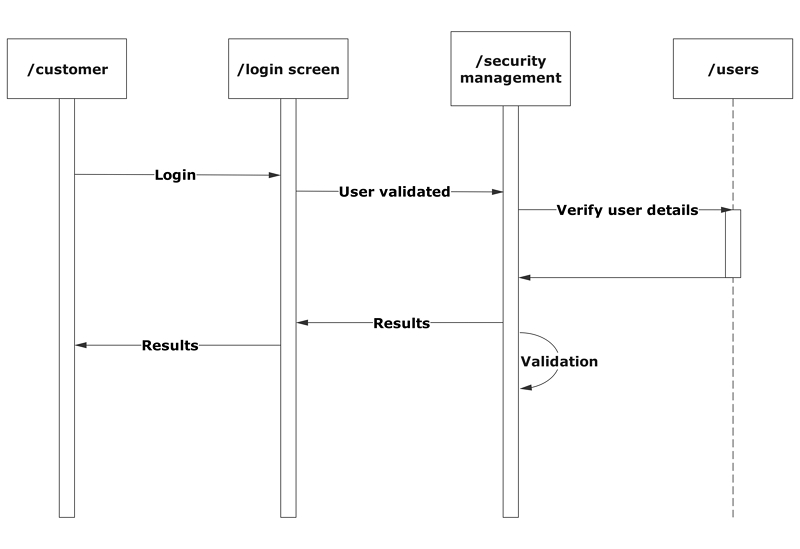
Sequence diagrams are commonly used by developers to depict interactions between objects in a use case. They typically illustrate how different parts of a system interact with each other, and in what order, to achieve an outcome.

AWS stands for Amazon Web Services, a popular data storage and movement service provider. An AWS Architecture Diagram documents any movement and changes that occur in the system.
Salesperson
- Sequence Diagram
A successful sale is achieved by following specific steps to build a relationship with clients/customers. A sales process template is useful for ensuring that team members know what steps to follow to maximise their chances of securing a sale.
Consultant
- 2x2 Diagram
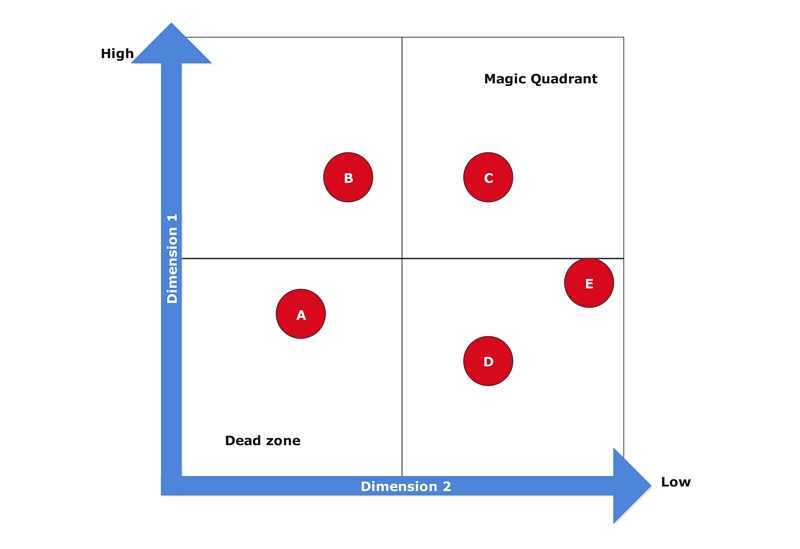
A 2x2 diagram is a class cartesian-style diagram that consultants can use to map the ideal state where their client’s product should lie in (the upper right hand corner).
As you can see, graphs, charts and diagrams are useful in all professions and serve all kinds of functions - the possibilities are truly endless. When used appropriately and presented clearly, diagrams make your work more engaging and easier to understand.
EdrawMax: head and shoulders above the rest!
What makes EdrawMax the go-to choice when creating diagrams?
- Ease of use: Just drag and drop the components you need onto the blank canvas. EdrawMax has a wide range of customization options, yet everything is intuitive to use.
- Ready-made templates: EdrawMax has a wide range of graph and diagram templates for you to choose from, allowing you to save time on building a graph from scratch and focus on the work that matters most.
- Versatility: Whether you are a savvy marketer, a clever engineer, or an ambitious student, EdrawMax has you covered. Our templates cover a wide range of professions and fields, allowing you to create a diagram that suits your every need.

