Edraw Support Center
Get quick answers and step-by-step instructions in our support center.
Chart
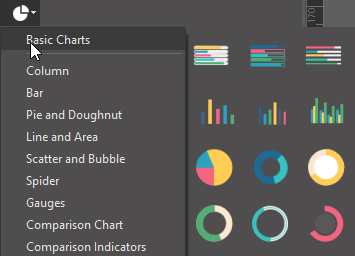
How to Add a Chart?
Open Chart library, drag and drop the selected chart onto the canvas.
How to Change Chart Data?
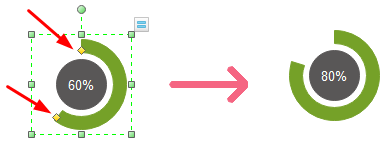
You can drag the yellow control handle on the shape, or click the floating button to set data.
- Drag the yellow handles
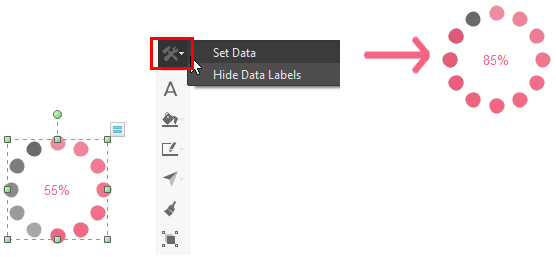
- Set through the floating button
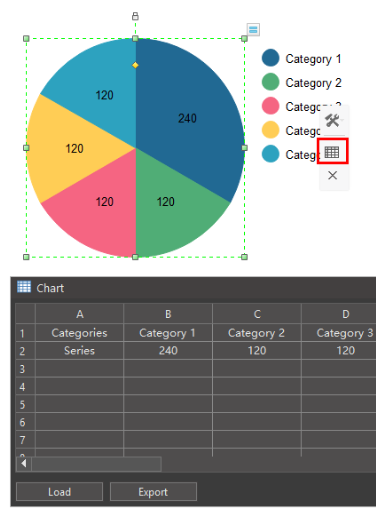
- Set data directly in the table
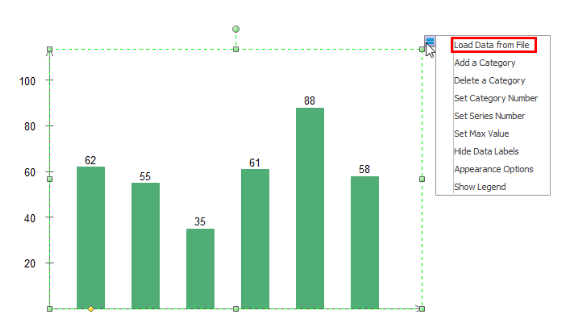
- Change data by importing a data file