How to Make a Gantt Chart on Mac
Know it All about Gantt Charts
The Gantt chart is an essential tool used in project management. It makes the project manager track the progress of the project against time. In the Gantt chart, the whole project is divided into sub-tasks, and then those tasks' progress is then plotted on the chart in the form of a bar. The milestones are also added with the tasks in the diamond shape.
The progress is on the left side of the chart, while the resources and tasks' names are on the right side. The chart helps to see how much work has been done related to the project deployed on a task, what kind of tools are in use, etc.
In this article, we will see how to make a Gantt chart on a Mac, what a Gantt chart is, its importance, and everything related to it.
For this project, we will use the Pages tool on the Mac to make a Gantt chart. See the below steps thoroughly.
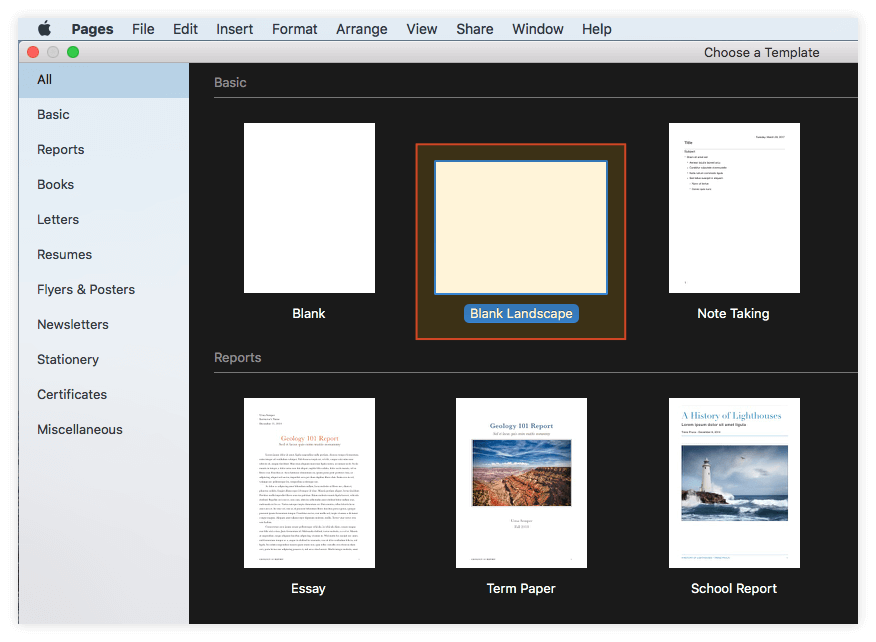
Open the Pages application. In the Basic category of templates, double-click the Blank Landscape. This layout is approved for the Gantt chart.
Now, add the table to your project by navigating to Insert > Table , or click the Table above the page on the taskbar.
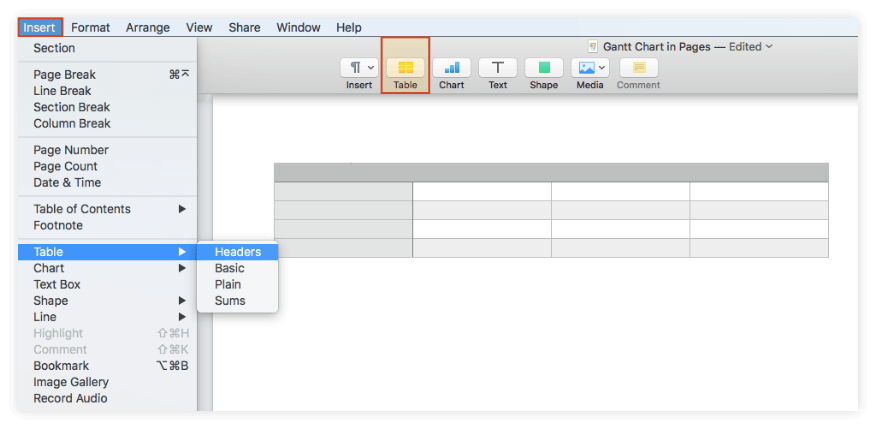
Now, add the names of the tasks of your project in the first row. Keep the names short, so they apply nicely to the graphics. In the third row, add each task duration in which the task has to be done.
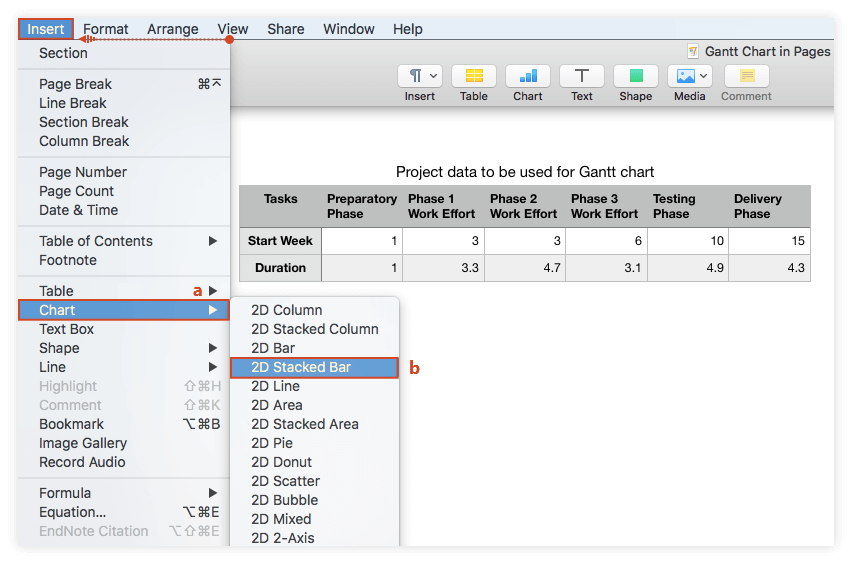
On the ribbon of the page, click on Insert and then go to the Chart. The menu will show you the 2D Stacked Bar. Wait for a second the stacked bar will automatically generate a raw bar.
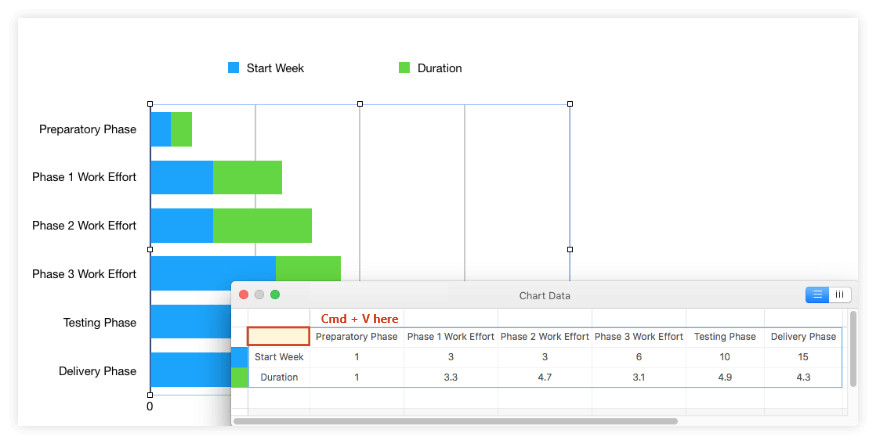
In this step, select and copy all the project data in the first row by using Cmd + C. Now, click on the Edit Chart Data option that appears after the selection of the data.
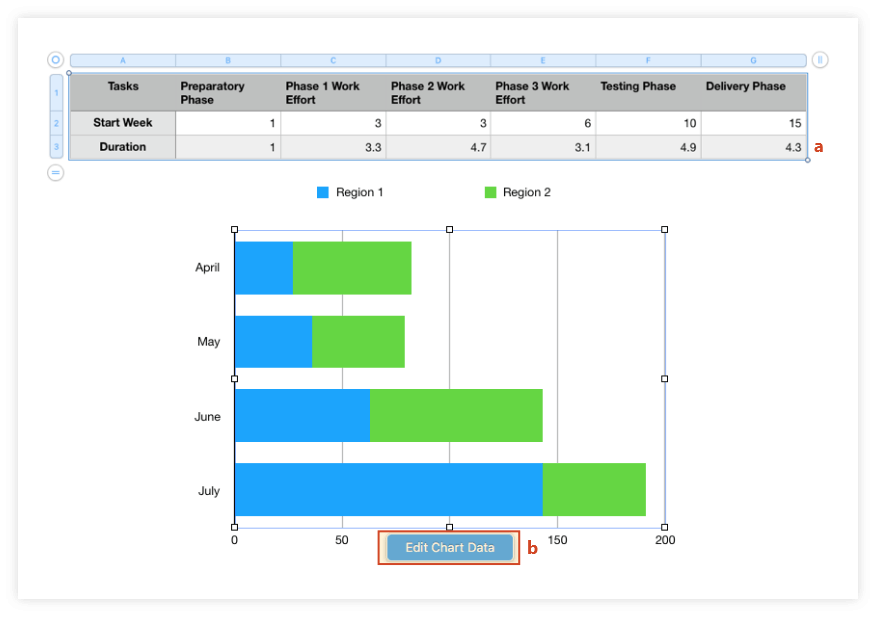
On the Chart Data window, select the first cell in the top-left corner and paste all the data here. The graphics will automatically update your data on the bar chart.
To make your projects look like a Gantt chart, follow these steps. It will simply make the blue bar transparent and the green one more illuminated.
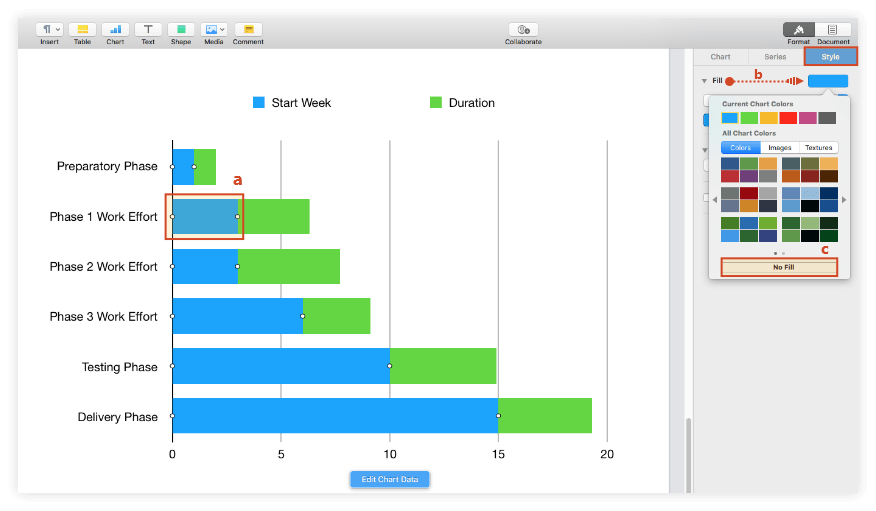
Double-click on any blue bar. It will select all the blue bars on the project. In the Format pane on the right side of the page's document, click the Style tab. Next to Fill, click on the color indicator and then select No Fill.
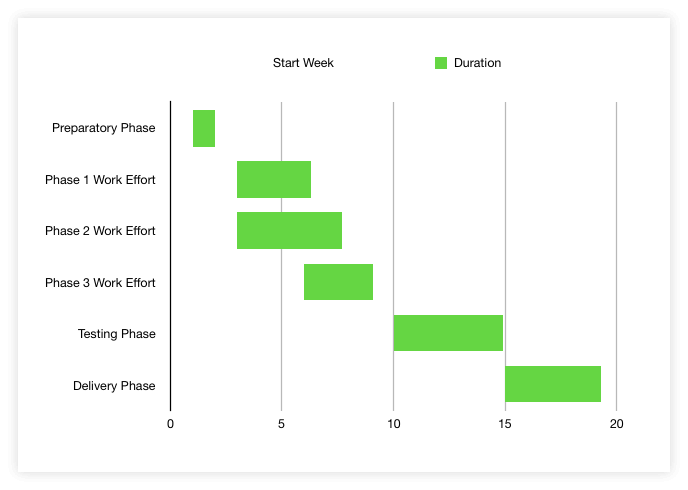
The basic Gantt chart is done! And you can change the color or make some customizations to help it look more professional.
Click the chart area and then click on any bar to select all at once. Then go to the Style tab in the Format pane. Use color indicators near the Fill option and choose a new color you like. You can see any of the templates on the internet to see how the colors are done on the bars.
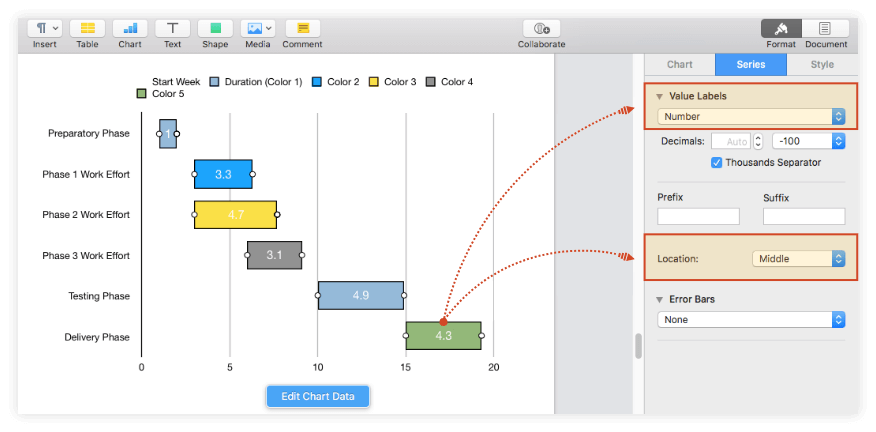
For displaying the task duration, select all the bars by pressing Shift + Click, then go to the Series tab. Under the Value Labels, select Number from the drop-down menu. Use the location feature to change the placement of the value labels.
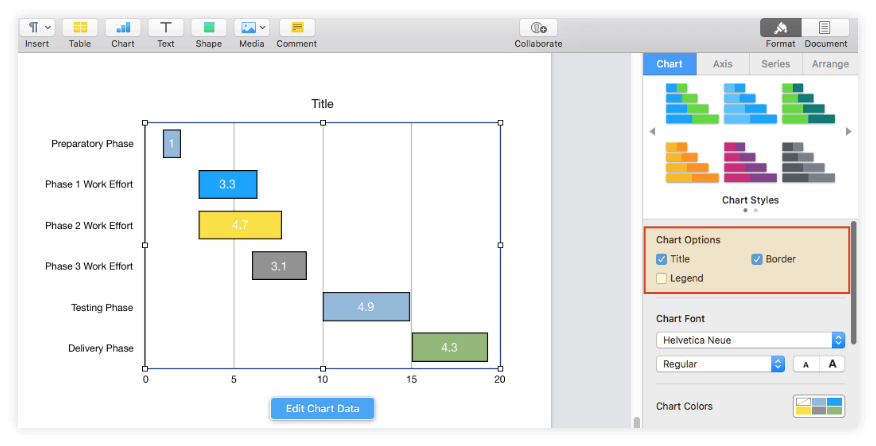
Customize the chart area by the Chart tab of the Format pane. Under Chart Options, tick the Border and Title options. Uncheck the legend if it seems redundant to you.
Under the Chart Font option, you can also customize the chart fonts. Under the Gaps option, use the up-down controls to increase or decrease the space between the chart bars. In the same Format pane, click on the Axis tab and go to the Minor Gridlines to add the vertical lines to your project.
Here we will see how to make a Gantt chart in the Numbers application of the Mac.
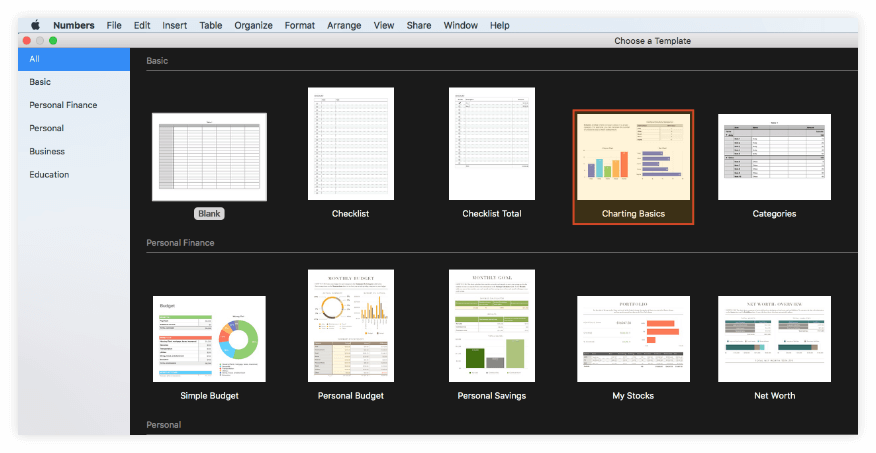
Launch the Numbers application. Under the Basic section of the template gallery, select the Charting Basics category. On the far left side of the Charting Basics, click on the '+' tab to create a new sheet. The table is added to the newly generated sheet. Add your tasks to the first column.
Using the first task as a reference, add the start week for each of the project phases. In the next column, list each time duration in which the task has to be done.
Select all the data that you add on the table and then go to Insert > Chart. Choose 2D Stacked Bar from the menu that appears after the data selection. The data will automatically generate the bars.
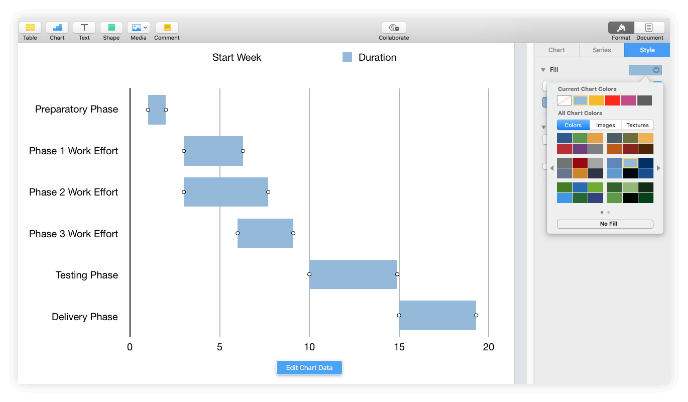
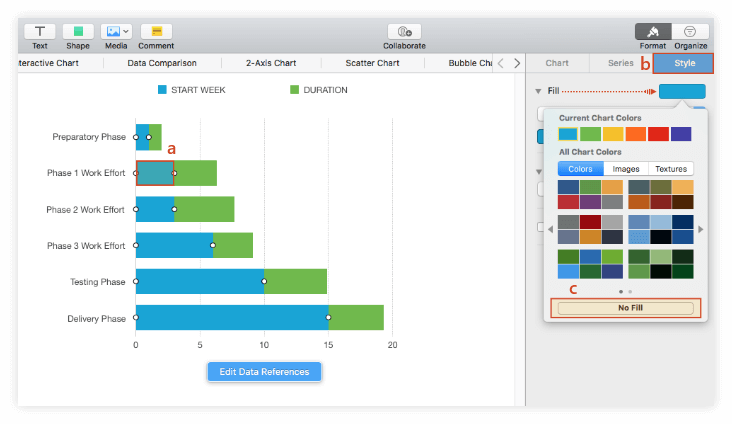
In the Format pane on the right side of the sheet, select the Style tab. Next to the Fill, click on the color indicator and select No Fill. Then the blue bars will "disappear".
To add some colors, go to the Style tab in the Format pane and click on the Fill. See the template on the internet to take the color guidance. You can also add effects and styles from the Style section.
To display task duration, select all the bars and then go to the Series tab, where you will find the Value Labels and then select "Same as Source Data." by clicking on the arrow on the left.
Check the Border and Title under Chart Options. You can change the styles or sizes of the fonts under Chart Fonts. In the Chart tab, select Gaps and the up-down controls to modify the gap between your bars. To add the vertical lines, select the Axis tab of the Format pane and then go to Minor Gridlines to add the lines to your project.

・ Simple alternative to Visio
・ 26k+ symbols
・ 10K+ free templates
・ 10+ AI diagram generators
To create Gantt Charts on Mac fast, it is extremely easy and unexpectedly fast to do it with professional and powerful diagramming software like EdrawMax.
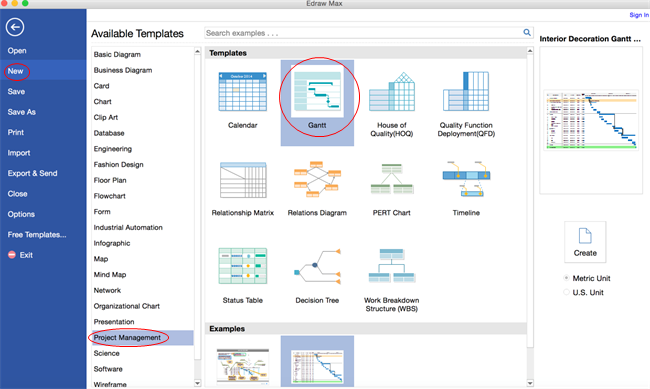
Open a blank drawing page and the libraries including symbols needed for creating Gantt Charts. Navigate to [File] > [Project Management] > [Gantt Charts]. Double-click the icon of Gantt Chart.
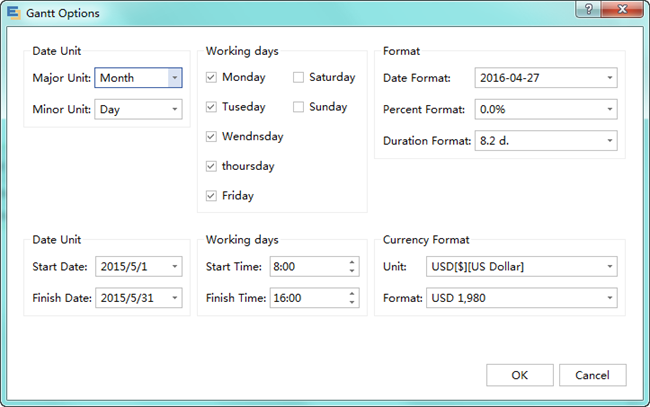
From the Gantt Chart symbol library, drag and drop shapes to the canvas. Then a dialogue box pops up. You can set Gantt chart data in this dialogue box, including date format, start and finish date. (Tip: This dialogue box can be re-opened through Options button on Gantt Chart pane.)
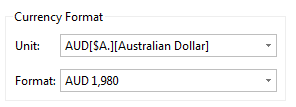
You can set the currency format at the bottom right corner of the pop-up dialogue. (Note: the default currency format goes with the software default setting. It's under the Options menu on File tab.)
Drag the green square handles to resize Gantt chart. Click on the chart and drag it to move it.
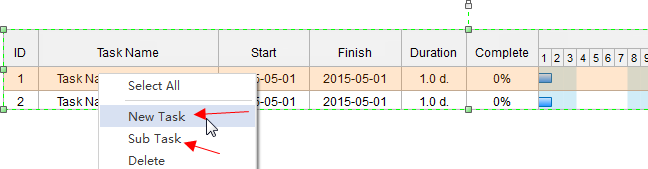
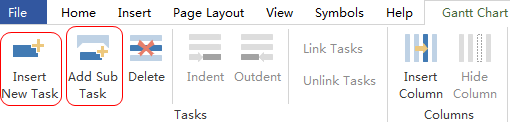
You can right click above a task to add a task or a sub task.
Another way is to use the quick buttons under the Gantt Chart tab to add a task or delete a task.
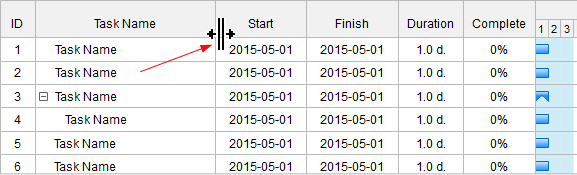
To change the column width, place the cursor on the line between two columns and drag, just as the way excel operates.
To change the row height, place the cursor on the line between two rows and drag.
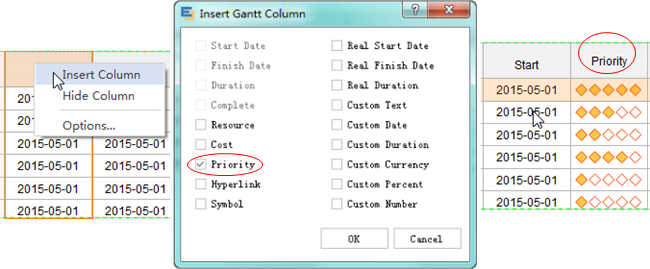
You can right click to insert a new column after the selected column. Choose the title of column from the pop-up dialogue box. For example, we can add a priority column.
Tip:
Double-click a cell to type in text such as the task name. -> Choose a different font under Home tab.
When double clicking the text editing box to input task start date and finish date, the progress bar is updated automatically according to the new date.
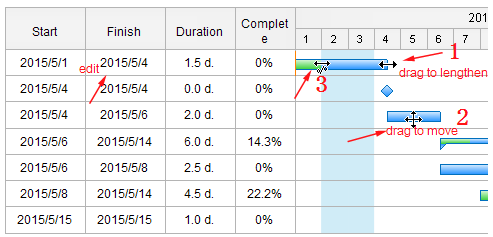
Also, you can rest the cursor at the end of a bar, when the cursor changes as a two-way arrow (No.1), drag the bar to change the finish date.
Hover the cursor above a bar, and when the cursor changes into a four-way arrow (No.2), you can move the whole task bar. When the bar is moved, the start and finish date will change accordingly.
Input the task completed percentage, and the green progress bar will be upgraded automatically. Alternatively, position the cursor at the beginning of the bar, when the cursor turns as a two-way arrow and a percent symbol (No.3), drag the bar to change the complete percentage.
To add a relationship between two tasks, put the mouse curser on one task and drag to another task. Then the two tasks will be connected by an arrow.
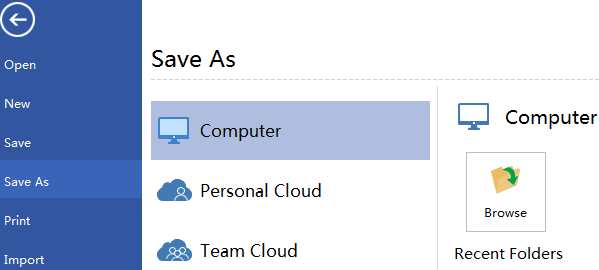
Click Save on File tab to save your Gantt chart as the default format of Edraw documents. Choose Save as on File tab to save as other formats. You can choose to upload your chart to the cloud so that you can access it anytime anywhere.
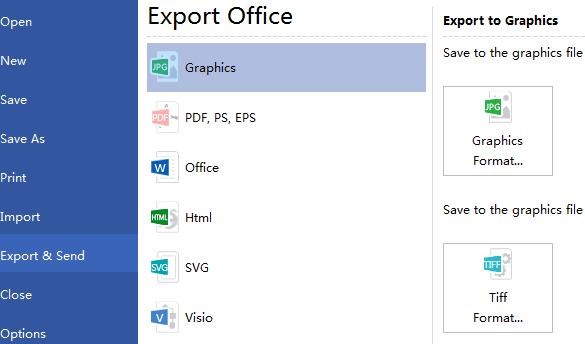
Hit Export & Send under File to export the Gantt chart as images, presentation slides or other format you want.
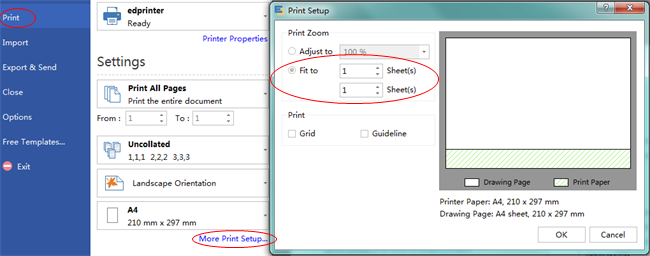
Click File tab; choose Print and then the print setting and preview window show. You can choose which pages and how many copies to print here.
If the drawing page is larger than the print paper, the drawing will be printed on more than 1 paper. To print it on only 1 paper, click More Print Setup... and then choose Fit to.
We have elaborately prepared some Gantt Chart examples for you to get started quickly.
Motivate yourself to use an efficient tool like EdrawMax that contains the complete set of all features and allows you to do your task from anywhere.
You can use EdrawMax to make your Gantt charts. EdrawMax is an all-in-one diagram-making software that makes it easy to make any diagram by just drag-and-drop. The software contains thousands of diagram-making symbols that will make your diagram complete and perfect.
The software provides hundreds of templates that you can use or import your project to customize it further. EdrawMax has both free and premium versions. It also allows you to download your project in many formats and export your project on any social media site.