Graphic Organizer Complete Guide
Edraw Content Team
Do You Want to Make Your Graphic Ogranizer?
EdrawMax specializes in diagramming and visualizing. Learn from this graphic organizer complete guide to know everything about graphic organizer. Just try it free now!
Graphic organizer is a visual chart that displays links between facts, ideas, or singular traits within a write-up. It improves reading comprehension by expressing logics graphically. In simple words, it is a tool for comparing story attributes. For that reason, it helps brainstorm solutions for the problems within the storyline. Besides that, it doesn't come in a single type. You may have heard about it by the name of knowledge maps, concept maps, bubble charts, or cognitive organizers.
Every organizer type has a specific function. Collectively, these can help classify, compare, enlist, sequence, highlight, and summarize your thoughts. You'll get a descriptive analysis of their uses and features further in the article. As for creating a graphic organizer, several programs are on market for the task. The well-known free program EdrawMax can be an optimum choice for you. Here is a step-by-step guide to creating an organizer.
1. What is a Graphic Organizer
Being exposed to its general overview and background, you may ask what is a Graphic Organizer? Graphic organizer is a visual and pictorial representation of the links between facts, concepts, and/or ideas in a learning assignment. Knowledge maps, concept maps, story maps, cognitive organisers, advance organisers, and concept diagrams are other names for graphic organizers.
Let's be honest, long essays and complicated stories are always boring for everyone. Plus, in today's busy world, no one has that much free time to re-read the lines again and again to understand the main concept. A graphic map jumps here as the solution. It saves time and gives value to the readers. According to the graphic organizer definition, they can easily extract the required knowledge in less time with less effort.
Long story short, A graphic organizer visually represents ideas, concepts, and relationships between various components. Its mapped visualization organizes the write-up, connects its details, and portrays it in a simple manner for the readers.
2. Types of Graphic Organizers
All readers are not the same, and neither are the write-ups. For a student, there are academic essays, stories, and biographies that require specific organizers. We know that the collective graphic organizer definition is the same. However, one interface template of an organizer is not suitable for every write-up. Therefore, experts came up with multiple visualization diagrams that target different write-ups and their components individually. Some of types of graphic organizers are as follows:
- Venn Diagrams:
- Double Bubble Map:
- KWL Chart:
- Sequence Chart:
- Cycle Diagram:
- Storyboard:
- Concept Map:
Venn diagrams use two circles to compare two different components of a write-up. You can use it with an essay to compare its two basic notions. On top of that, you can use it with a story to compare the characters inside it. However, the general purpose of the organizer will remain the same. It explicitly depicts the differences and similarities between two content items. The visualization diagram includes two big circles that overlap each other. The things that are similar in both occupy the area that overlaps. In contrast, the differences reside in the area that is individually separated.
The double bubble map also helps the students to compare two items. However, it offers a much broader approach. You can contrast between places, people, and events. Unlike Venn Diagrams, these do not use overlapped circles for all the association details. Instead, this type uses tiny circle bubbles with individual traits. Plus, an extra visual shape connects the similar information in both items.
This type of organizer-KWL Chart helps the students to track their learning behavior in an organized way. Typically it includes separate containers with different information. These sections include the known facts and the data that students want to know. Its significant use is in academic fields where it proves efficient in groups. Plus, individual students or the whole class can perform this task collectively for better understanding.
The sequence chart includes organized components of content. The organizer's purpose is to use a visual aid to create a flow between different scattered details of the essay or story. Moreover, you can use these for business ideas to organize events or steps in a sequence. The series chart has a subtype that focuses on the cyclic sequence.
This diagram includes the steps that sequence themselves in a circular flow. The last step or element of the cycle diagram directly relates to the first one. This diagram focuses on the flow instead of listing steps or organizing events.
This organizer uses static panels and simple visuals to organize and portray the storyline. It contains more pictures and visual artwork rather than words. Therefore, the organizer is more engaging and appealing to the readers.
A concept map develops relationships between concepts. It is an educational graphical organizer that uses academic write-ups for concept connection diagrams. Plus, it uses different shapes such as boxes or circles to list information and ideas. Moreover, the organizer uses arrow shapes labeled with phrases to connect these concepts.
- Venn Diagrams
- Double Bubble Map
- KWL Chart
- Sequence Chart
- Cycle Diagram
- Storyboard
- Concept Map
3. Importance of Graphic Organizer
Graphic organizers are a set of appealing visuals that exhibit a complex write-up in the simplest way. The basic purpose of the graphical organizer stays the same. However, you can use it to extract more benefits from the written content. As the graphic organizer definition states, these diagrams use simple navigation shapes that organize the poorly sequenced content. Moreover, these shapes make the written content more appealing and increase reader engagement. The visual diagrams enhance the reading comprehension of students. Therefore, it helps academically and professionally, which makes it pretty important.
Not only the readers but the writers also find it befitting. It makes their written content more audience-oriented which helps it to serve its purpose. Plus, organizers help to direct the audience towards a central point that is the main reason to write content. Graphic organizers increase the students' ability to look for supporting details and textual evidence inside the write-up. It helps them to find the answers from a given context. Moreover, filling out these organizer forms can help them outline the essay or story they are about to write.
4. How to Use Graphic Organizer
A graphical organizer stays of no use to you until you learn how to utilize it accordingly. Not every organizer will give you the exact output. Some compare the items and give you their details, while others focus on the central concept and try to prove it with evidence. For that reason, before you deal with an organizer, ensure you know why you are using it and what contents it has. General guidelines for using a graphic organizer are as follows.
- Look at the interface and judge what type of organizer it is.
- Typically, organizers include a brief description of the content inside the boxes. Read it and follow those descriptive instructions. For instance, in a character analysis graphical organizer, there are traits and short descriptions about them. You must find the individual detail and write them inside the given box.
- Some organizers have a brief explanation at the top that summarizes the aim and reason for the visualizations. Read those before jumping in to have an accessible data approach.
Moreover, some organizers have specific instructions for usage. We'll discuss some of them here:
- Brainstorm the ideas and write down what you already know about them.
- Write down what you would love to know more about the ideas.
- Brainstorm the ideas and write down what you already know about them.
- Identify the central idea.
- Look for the supporting details and facts and connect them.
- Conclude an imaginary statement at the end that describes the notion.
KWL Chart Usage Steps:
Concept Map Usage Steps::
5. How to Create a Graphic Organizer in EdrawMax
With the word visual artwork, an exaggerated and effort-taking design software comes up in most people's minds. However, things aren't the same as before. With graphical organizer makers in the market like EdrawMax, the workload is now minimum.
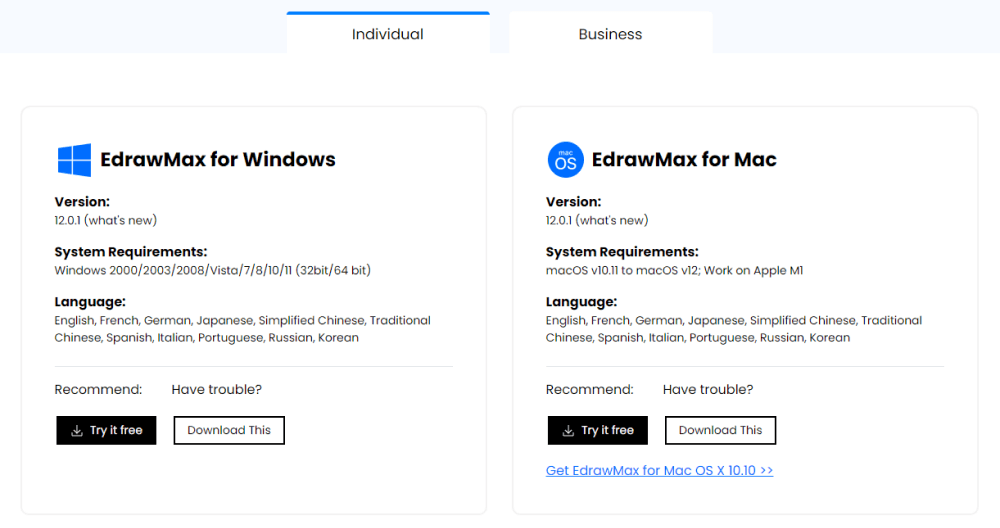
EdrawMax has different versions for macOS, Windows, and Linux. Whatever method you use, there are 4 simple steps to follow in order to make graphic organizer without wasting hours.
Step1 Open EdrawMax and Login
If you are well aware of EdrawMax, you will probably have an account there. In that case, open the EdrawMax and login into it. However, If you are entirely new to the setup, you don't have to worry about excessive package downloads. Just head over to the search engine and type "EdrawMax". Open the Official link and click on the "Download It Now" button.
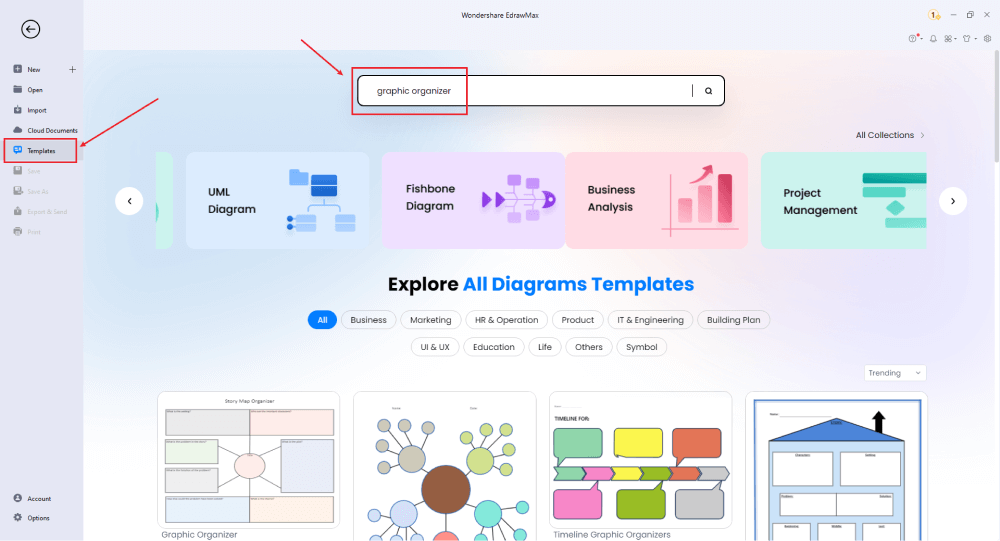
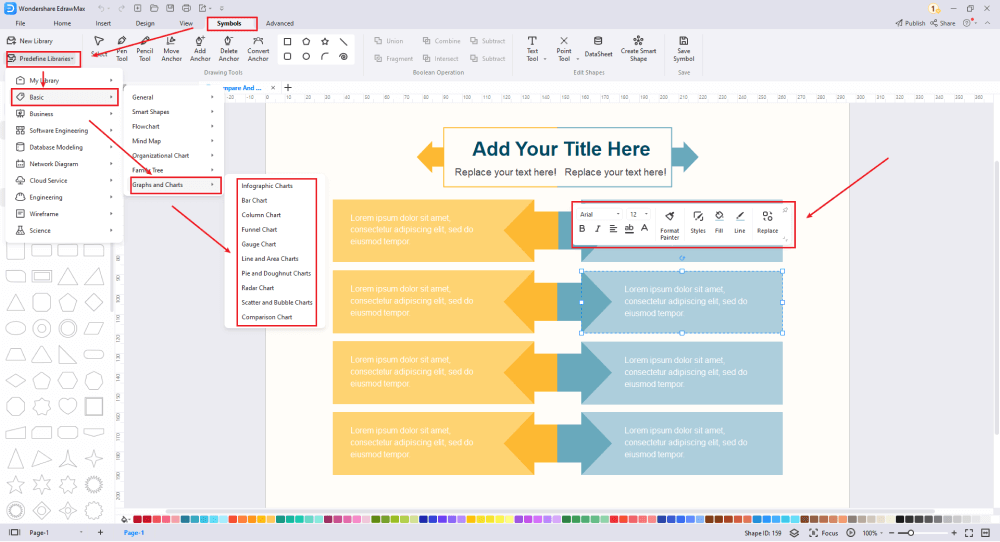
Step2 Select a template
For the next step, open the program. On the left side, look for "Templates". Click on it, and it will take you to one of the biggest social template platforms. You can find any type of organizer there. It is an easy fix if you want to skip some time and generate a graphic organizer in an instant. Moreover, you can share your designs here and publish your listings inside the community. EdrawMax template community adds up hundreds of templates every day for the users. Therefore, it has gained the trust of customers. Plus, the premium visual artworks are the program's biggest pros.
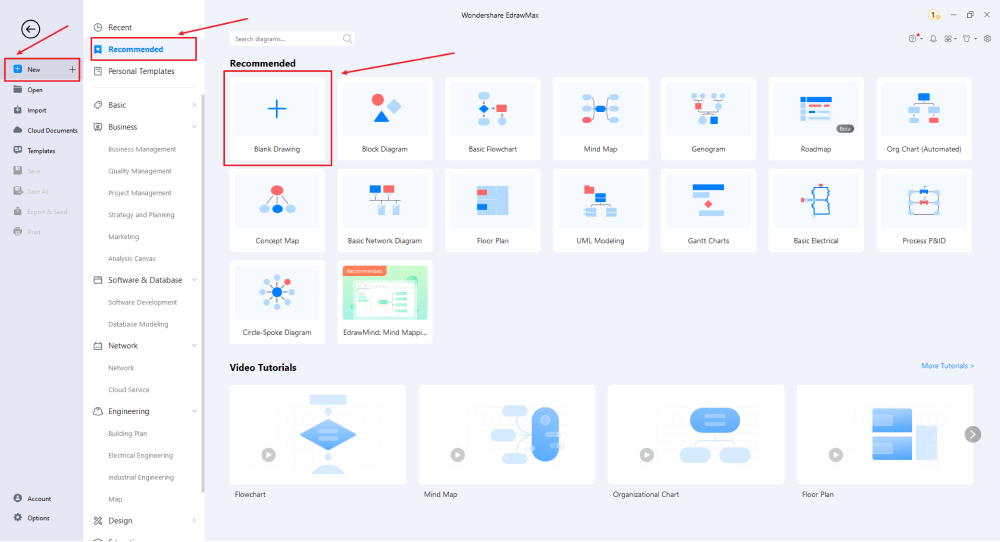
Step3 Create from Scratch
EdrawMax allows you to start from scratch. Its exceptional tools are not only accurate and effective, but they are also effortless to use. Let's discuss the fire escape route plan to understand the organizer's example. A fire escape route plan is a network of shapes that depict an escape route from a building in case of a fire emergency. First, click on the "New" button on the left to create your edit sheet. Now assume the building you want to establish. On the left, you'll see numerous shapes of rectangles, circles, and premade elements. Click on the rectangle ones and drag them inside the edit portion. Organize them and make an escape route.
Step4 Add Components and Customize Your Graphic Organizer
As for the templates, if you got the one you were looking for, click on the" Use Immediately" button and transfer a replica onto your edit screen. Moreover, the program offers a diverse amount of options in terms of customization. You can edit, remove, and add new components inside the readymade template. EdrawMax allows you to add icons, cliparts, shapes, pictures, and many more elements to your styles. Plus, you can edit any grouped template, ungroup it, and remove unwanted components. For this purpose, right-click on the grouped element. Head over to the "Group" button and click on "Ungroup". Now you'll have separate components to edit individually.
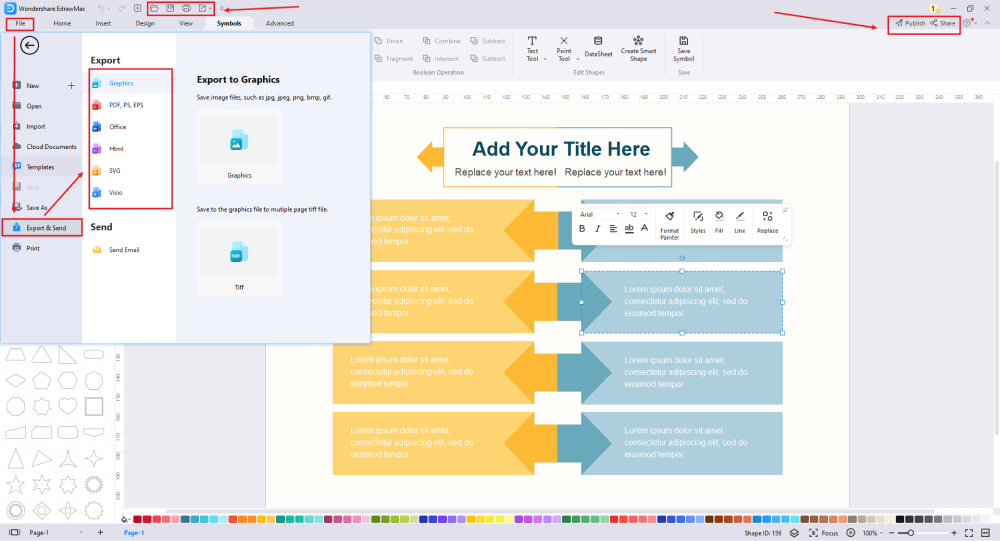
Step5 Export or Share
For the final step, extract your Graphic diagram from the program using the "Export" button. Moreover, you can click on "File" in the top left corner. From there, click on "Save As" and export the file to your desired location in your desired format. It allows the users to export the files in the editable Word, Excel, and PowerPoint format. Therefore it is a universal tool, eligible for most programs on your device. Furthermore, you can publish your template in the community using the " Publish" button at the top right location. Click on it and name your file before sharing.
Basically, it is simple to create a graphic organizer in EdrawMax, just grab a template and keep customizing, drag and drop professinal symbols to make your plan better. If you are still confusing about how to create a graphic organizer in EdrawMax, just check this graphic organizer guide, or check the video below. Or you can find more tutorial videos from our Youtube.
6. Graphic Organizer Examples & Templates
There are 4 examples of graphic organizer that you can refer or use immediately. Just click the image to download EdrawMax, and download the templates accordingly. Then double click to open the templates and customize as your prefer. Or open the templates from EdrawMax Online , and duplicate the templates. Click this graphic organizer examples to get more inspirations.
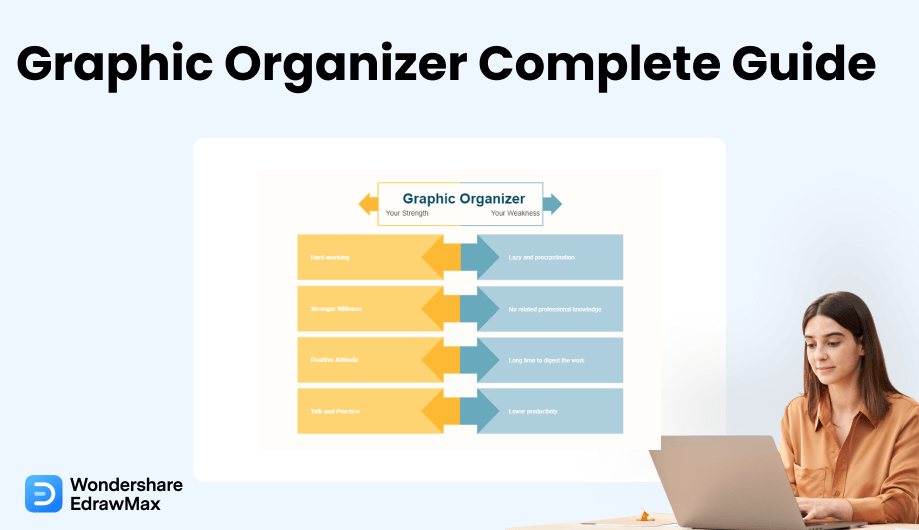
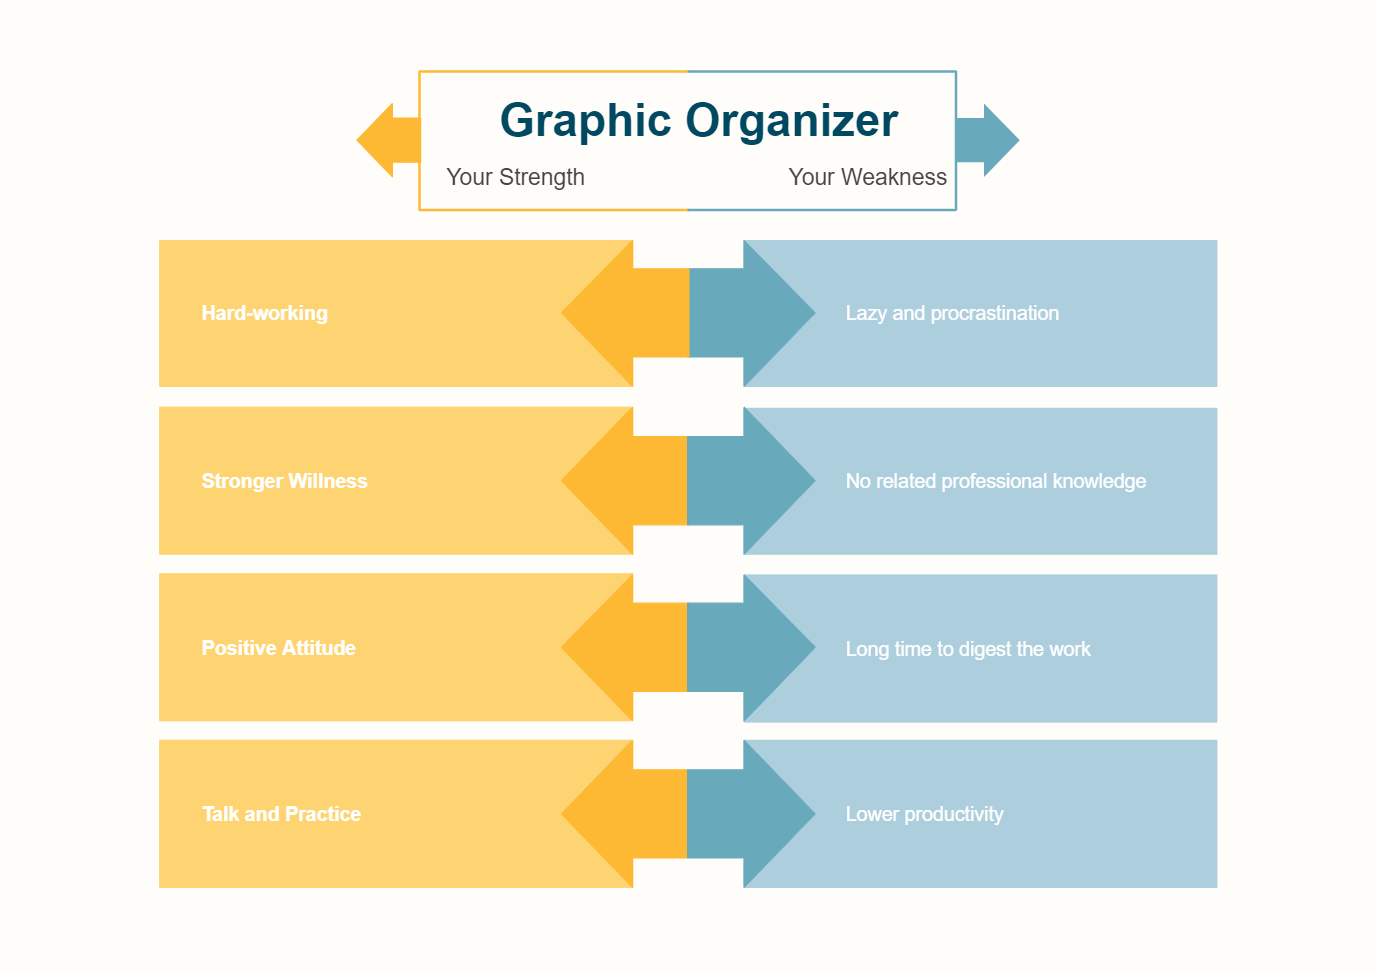
Example 1: Graphic Organizer Example
This graphical organizer separates two opposite traits of a person. In this example, the targeted person is the reader. Using a contrasting color scheme, the organizer depicts the strengths and weaknesses of a character. With its help, students can compare both the traits and their similar sub-details. Moreover, the contrasting concept helps to increase reading comprehension. It is a fact and opinion based organizer that helps you collect information while researching.
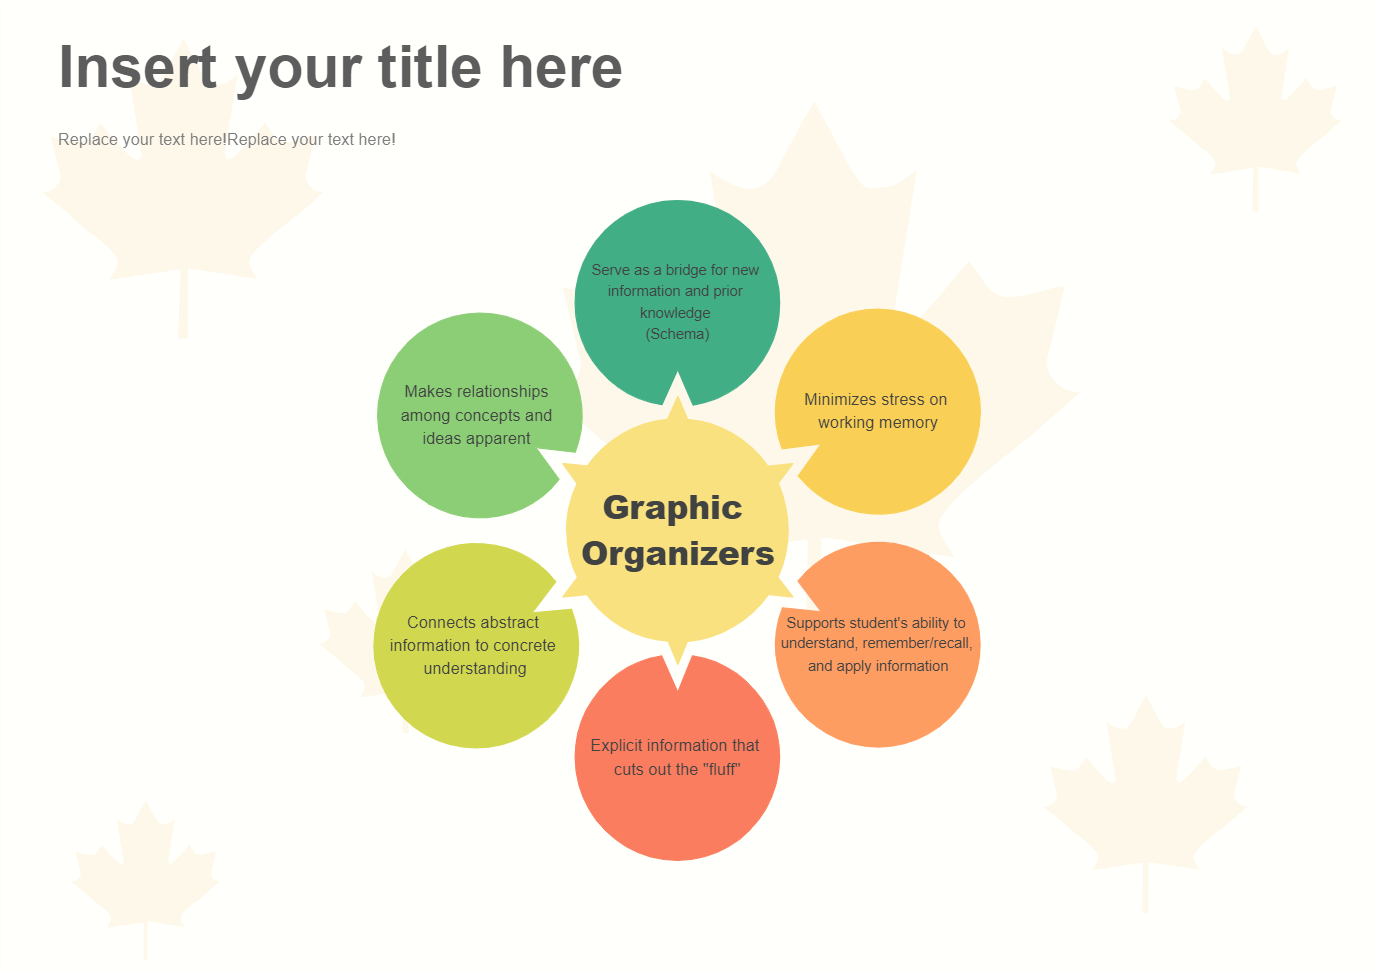
Example 2: Graphic Organizer Definition
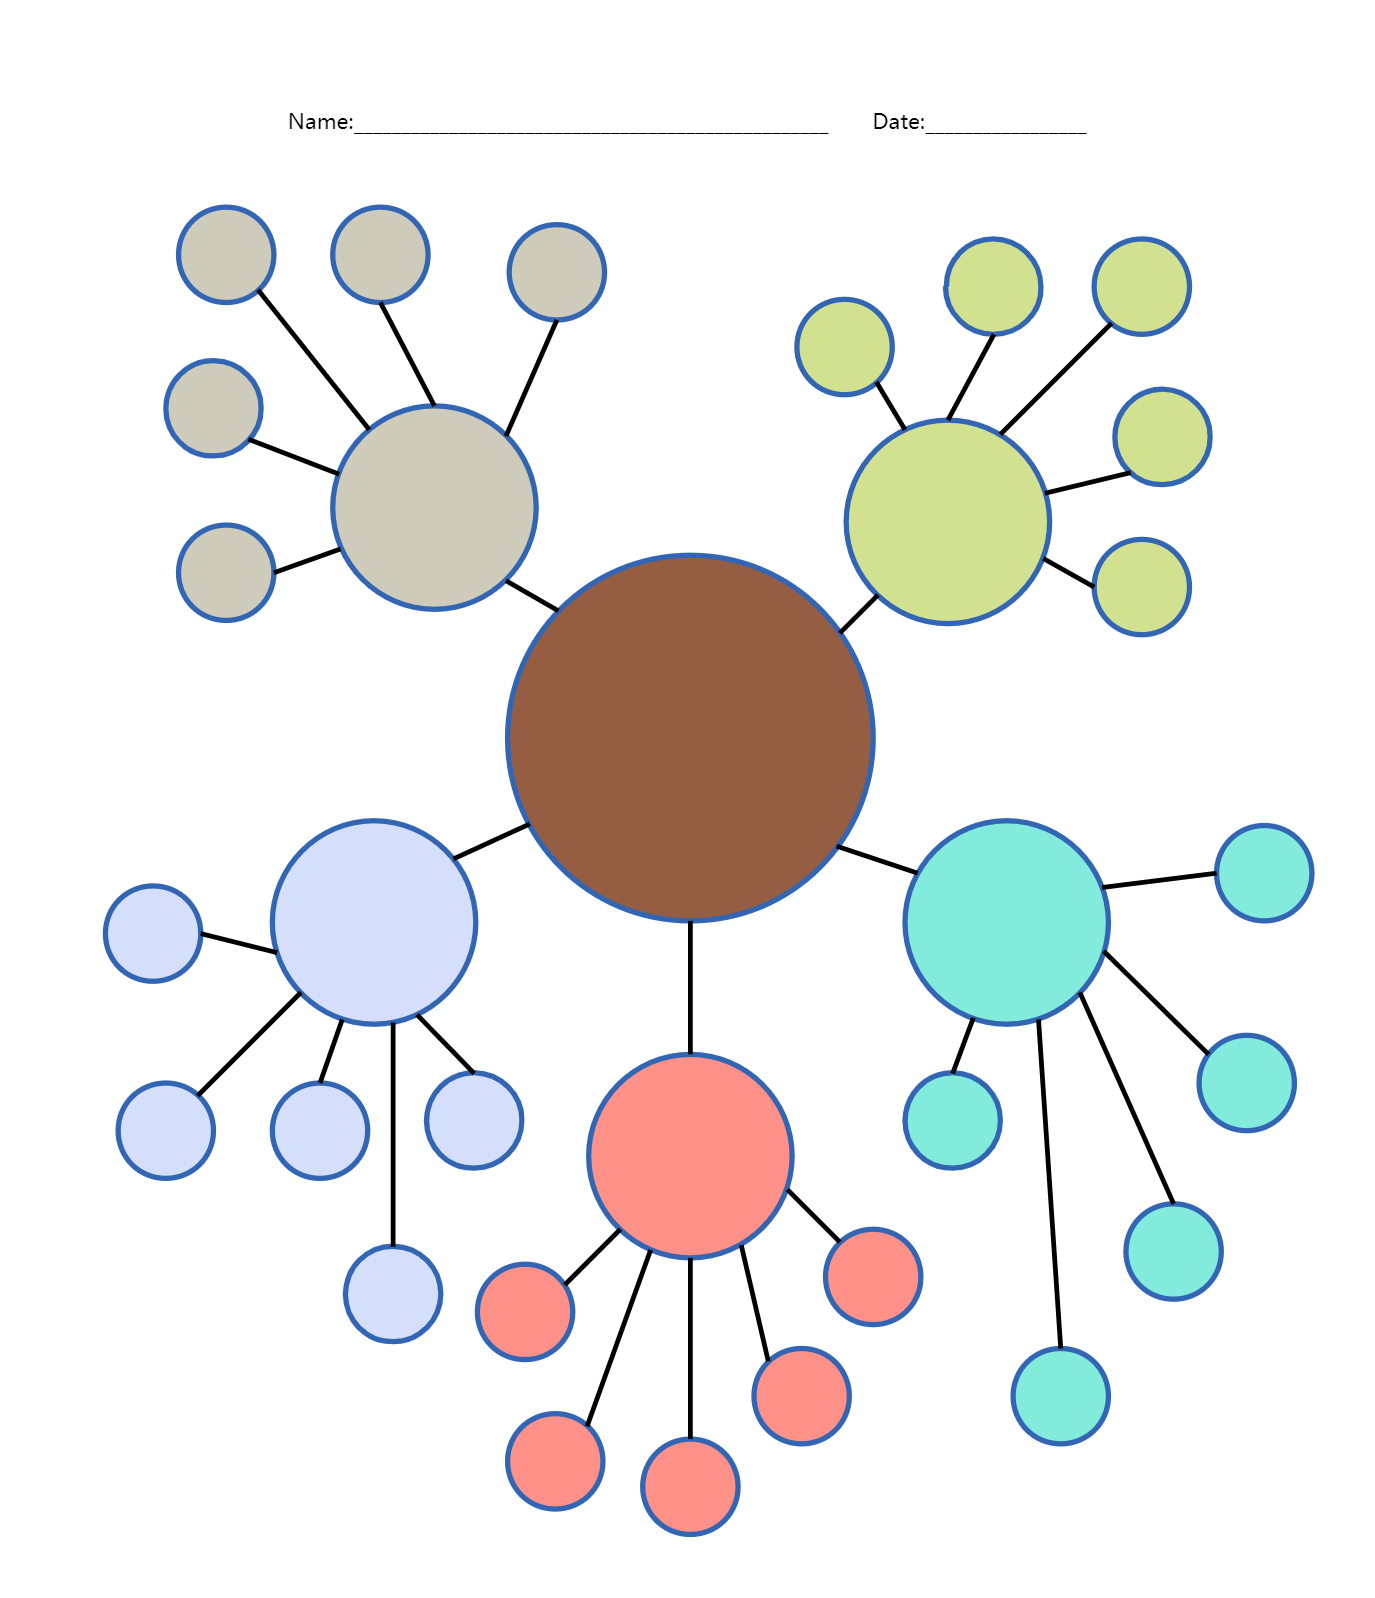
The exemplary organizer includes a primary concept in the central circle. Around that shape, associated details depict the main idea's positive or negative impact. In this case, the visualization summarizes the beneficial impacts of a graphical organizer. Moreover, the different color scheme makes it appealing and user-engaging. It helps the students to assess challenging notions easily. They can determine how the idea influences the other elements inside the write-up.
Example 3: Web Graphic Organizer
EdrawMax which makes it simple and quick to produce a and Details Chart with professional-looking results, is an alternative to employing complicated programs to generate the and details chart. The chart below shows how the key idea is presented along with a thorough diagram. The, Details, and Summary are all given their own slots and columns in the and Details figure below.
Example 4: Timeline Graphic Organizers
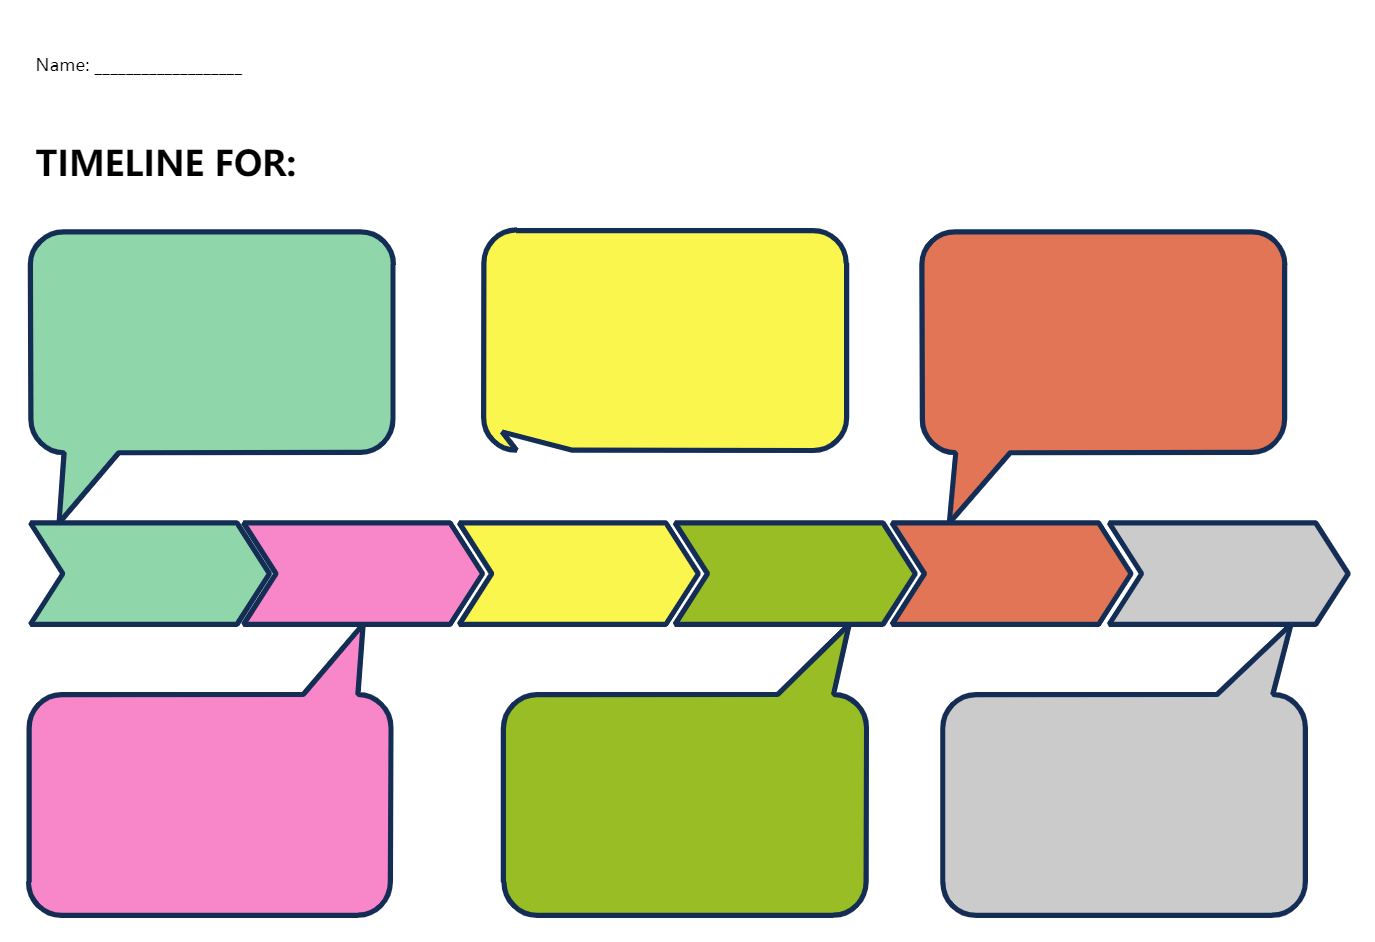
This organizer resembles a sequence diagram. However, it is not as general as that. Instead, it has a logical and reasoning explanation or detail for the sequence. Every sequenced element has a different color similar to its detail box. It makes the entire visualization more hectic and engaging. Plus, it helps the readers to track the plot of a story. It enhances the sequencing and retelling ability of a student.
7. Free Graphic Organizer Maker
Graphic organizer makers are costly as it provides exceptional design value to the reader. However, it is not the case for EdrawMax. Firstly, it provides a free 15-day trial that is more than enough to get used to the program. Moreover, it won't cost you as much cash as others. Instead, you'll be getting every organizer designing tool without affecting your budget. Edrawmax provides a user-friendly interface for the users. Unlike other makers, this program does not include rocket science or complex design strategies. For that reason, it is reliable for most of the general audience. Plus, it does not require any additional design expertise.
key Features of EdrawMax:
- EdrawMax comes with free graphic organizer templates that are 100 percent customizable;
- The built-in vector symbols let you easily add components to your design;
- You can easily share the graphic organizer design with your team and see the live revisions made by your team;
- EdrawMax lets you export the file in multiple formats, including MS Docs, PPTX, JPEG, PNG, PDF, and more;
- EdrawMax has a strong community of 25 million users who update the template community with their creative projects;
- EdrawMax is considered the best tool for beginners and professionals because of the user-friendly dashboard and easy drag-and-drop feature.
8. Final Thoughts
Graphic organizers provide a visual aid for the readers to compare, sequence, and analyze a write-up. Moreover, they help summarize the primary concept of the essay or story. Organizers help to deliver the author's purpose and track the plot of the write-up.
As for the generation of graphic organizers, it is better to choose a third-party software such as EdrawMax. Its easy-to-use interface, simple tools, and readymade templates make it stand out in the crowd of contenders. Moreover, the budget-friendly pricing plans of the program make it suitable for every individual. The website of EdrawMax offers numerous How-to tutorials, considerations, and tips. For instance, creating a cross-sectional flow organizer, making a bubble chart, or a column chart-everything is available at the site. So, it is better to visit for extra tips about your project.
Graphic Organizer Complete Guide
Check this complete guide to know everything about graphic organizer, like graphic organizer types, and how to make a graphic organizer.
You May Also Like
Dichotomous Keys Complete Guide
Knowledge
Conceptual Framework Complete Guide
Knowledge
GCP Architecture Diagram Complete Guide
Knowledge
AWS Architecture Diagram Complete Guide
Knowledge


