SIPOC Diagram
What is SIPOC , and how can one use it to better improve his/her business? First, SIPOC is a method used to summarize the inputs and outputs of business processes by focusing on suppliers first. SIPOC is used for documenting business processes; therefore, considered as part of business process management disciplines, lean manufacturing, and the Six Sigma tool.
Ideally, SIPOC helps you to better understand the entire context in which the process occurs. Most companies use this tool, but some have substituted it with COPIS, which is the same thing, but instead, it puts customers first over suppliers.
1: What is SIPOC?
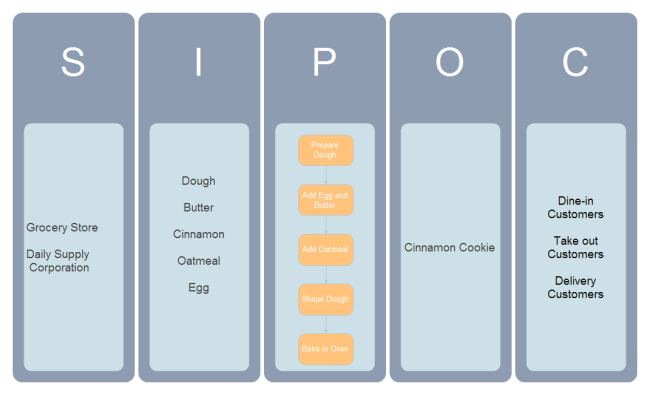
SIPOC is an acronym that stands for Suppliers, Inputs, Process, Outputs, and Customers. SIPOC Map/Analysis is a high-level process summary that visually illustrates the entire context in which the process occurs for better understanding.
So, basically, a SIPOC map enables deeper understanding by showing a big picture view of the vital elements of the process.
2: Purpose and benefit
Purpose
Keep in mind that the SIPOC map is key to business process improvements. But how does it do this?
- By offering a clear picture of the complete process through graphical representations of elements
- Enables effective sourcing of actionable insights
- This model also helps create and understand the interrelations between its components. “For example, how suppliers, inputs, and processes are impacting outputs and customers.”
- It helps individuals and organizations improve processes. It gives them in-depth knowledge that necessitates the creation of practical strategies, which helps them understand the underlying problems and their causes.
- SIPOC helps project management teams to visualize, understand and communicate effectively.
Benefits
There are innumerable benefits that come with using the SIPOC analysis map, and we are going to highlight some of its major benefits here.
- Ensures process management is more informed and improved thanks to its enhanced problem-solving capabilities.
- Provides actionable insights that help solve problems and deal with challenges existing within a business process.
- It improves efficiency by optimizing business processes which in turn cuts down operating costs while boosting revenue.
- It enables the process management team to have a comprehensive overview of their business processes.
When to use SIPOC diagram
- When improving current or creating new processes.
- When you need to ensure everyone is up to date with the current process
- When documenting your process’ high-level view
3: What are the components of a SIPOC diagram?
As said earlier, SIPOC is an acronym. Therefore, this acronym represents five key elements of a SIPOC diagram, which are the components of a SIPOC diagram. So, what does each component stand for?
- Suppliers: Refers to a company or person that provides inputs into a process.
- Inputs: These necessary materials needed to improve or execute a process. It can be energy, feedback, data, raw materials, finance, and other resources.
- Process: This refers to collection activities (structured steps) used to transform inputs into outputs
- Outputs: These are what results from a process which can either be product or service or both.
- Customers:These are the ones who consume the outputs and can be a person or a company. You can also call them the “outputs’ recipients.”
4: Tips for creating an awesome SIPOC analysis
SIPOC analysis requires team effort; therefore, you will need to work as a team to complete it successfully. On top of working as a team, you will need to explore some tips and tricks to create an awesome as well as effective SIPOC analysis table. To help with this, we have highlighted some of the tips and tricks for you.
Define the purpose of your SIPOC map: Before you even start making this diagram/map, you will need to determine the objective of creating it. What do you want it to solve? Or what are your targets with this analysis?
As noted above, don’t try to do this alone; otherwise, you will miss some of the key ideas.
Brainstorm and research for all relevant information or steps that will be needed when designing this diagram. Remember, brainstorming can help identity needed primary inputs.
Build a framework using a template: Create a draft map using paper and a pen – quickly draw a SIPOC map and see if it’s okay before heading into an actual designing phase.
Scan all your data and draft to ensure the completeness and appropriateness of all of your recorded data.
Remember, it’s a high-level overview so, be concise – make I page/sheet.
Now you head over to EdrwaMax software and start a designing process.
Furthermore, to take your SIPOC analysis to the next step, it will be useful to display these key things on the SIPOC map:
- Include KPIs which will ensure product capability is met.
- Necessary resources need to convert inputs to outputs.
- Godliness describing each process.
Note: these tips are ideal for advanced SIPOC analysis diagrams.
5: How to create an SIPOC diagram in EdrawMax
Step 1: Open EdrawMax software if you've installed it already. Sign in to your account or signup you haven’t created an account yet.
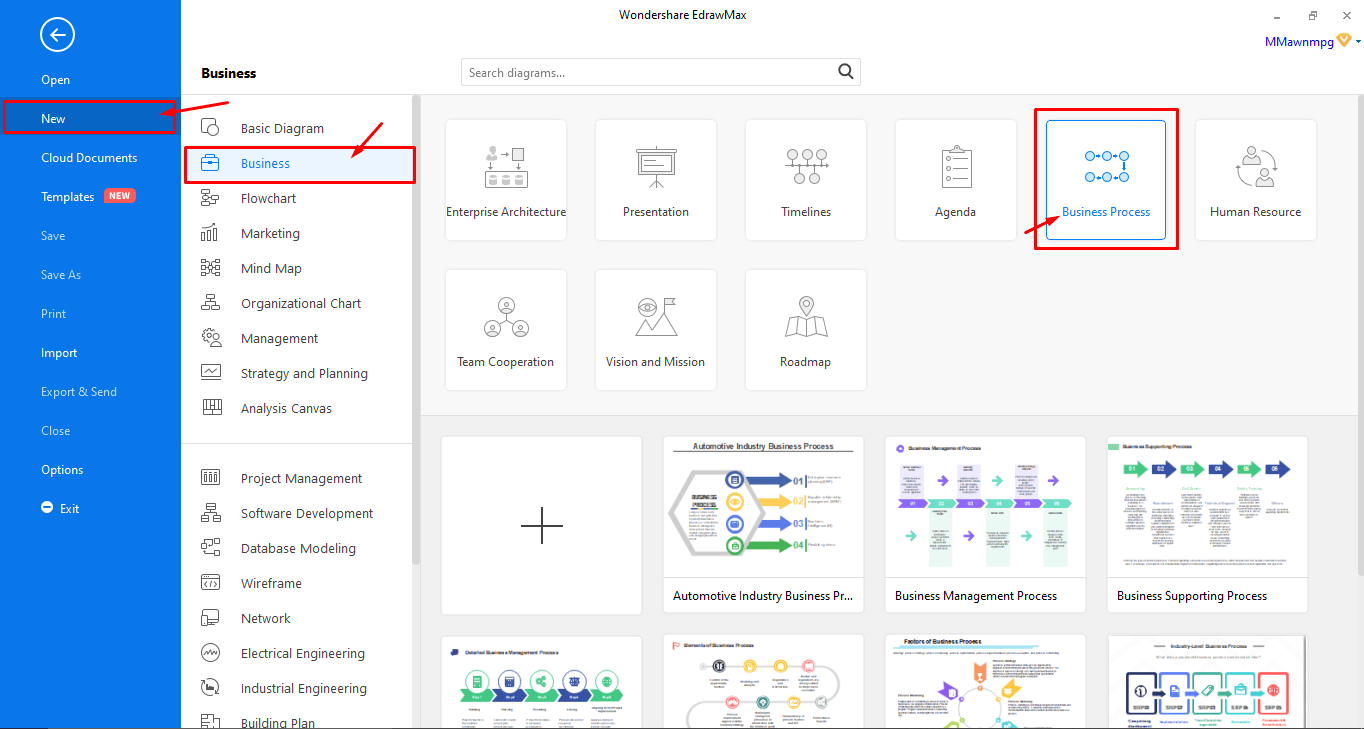
Step 2: Now, on the left blue navigation pane in EdrawMax, click [New] > Business] and then [Business process] and let it load.
Step 3: When it’s done loading, click on [+] if you want to create a whole new SIPOC diagram from scratch. But if not, then browse through the available templates given there and select to edit the one you like.
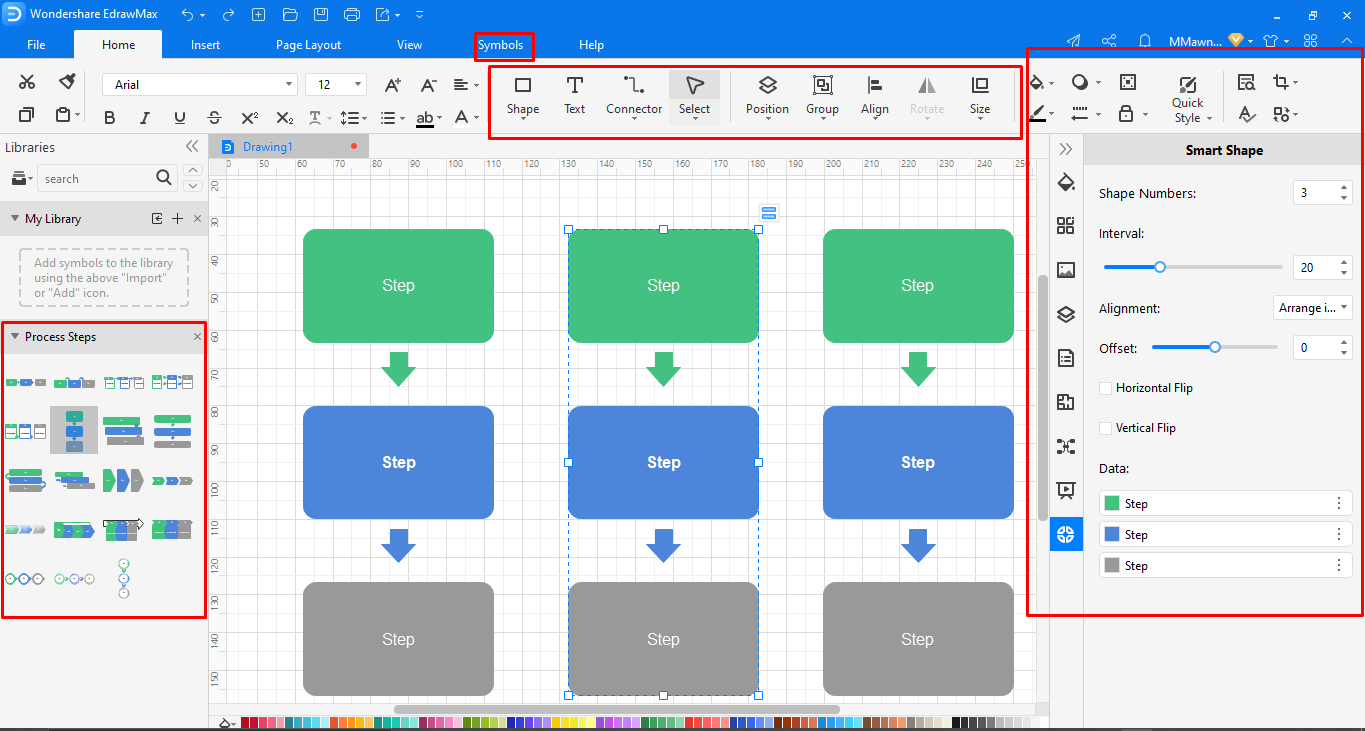
Step 4: Editing: This tool will help you design and edit your diagram in several ways, such as adjusting colors, size, or fonts. Also, you can add extra symbols from the Symbols library.
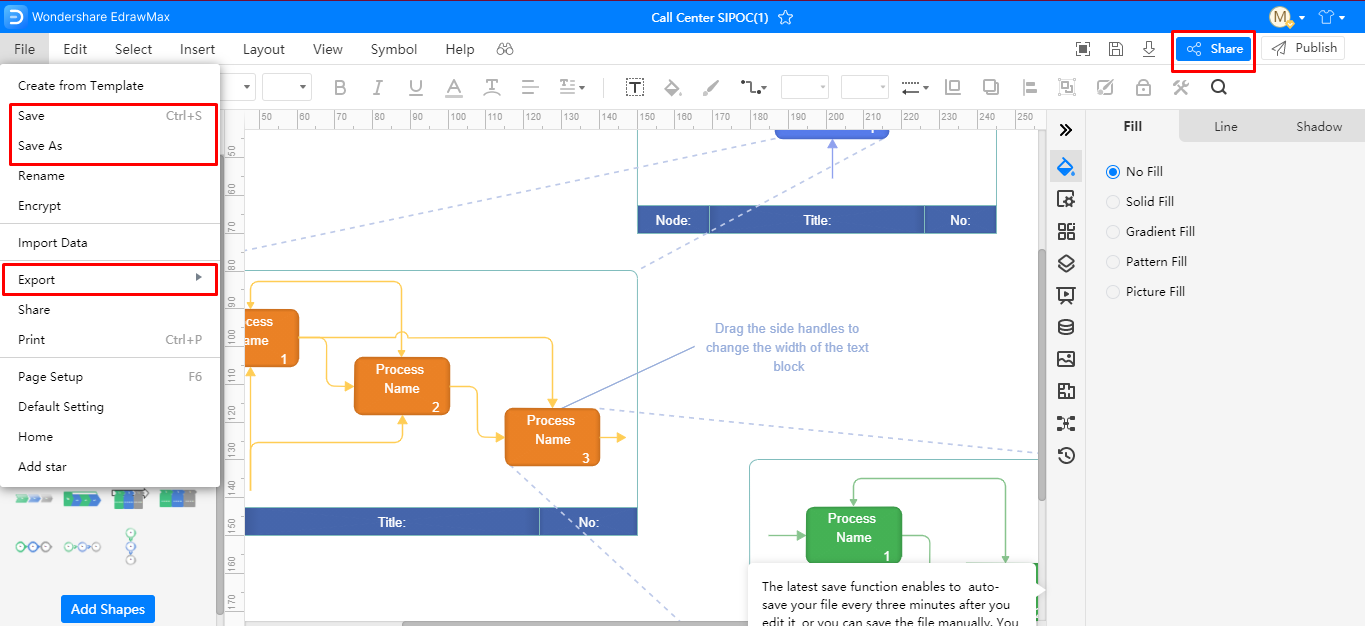
Step 5: Well, when you are done creating and editing your diagram, you can save, export, and even share your complete diagram. EdrawMax allows you to export your file in any format you like, including PDF, editable MS Office file, SVG, Graphics, and Visio vsdx file.

An all-in-one platform for 210+ diagrams.
・ Simple alternative to Visio
・ 26k+ symbols
・ 10K+ free templates
・ 10+ AI diagram generators


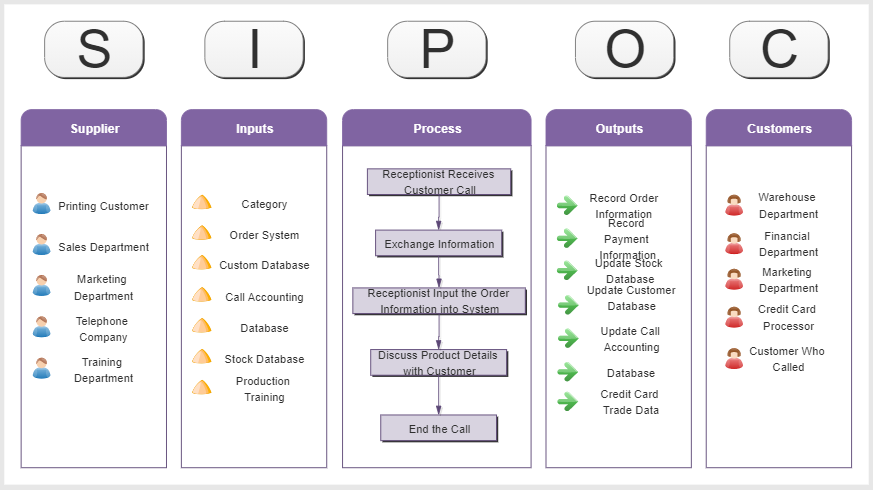
6: Call Center SIPOC Example
Before any project begins, it is important to identify all relevant elements that will be included in the project. This is essential since it presents the project management team with actionable insights that will help in process improvements. The call center SIPOC diagram below is a good example since it highlights all the elements involved within each category.
Note: There are plenty of high-quality templates available in Edraw for creating great SIPOC diagrams. All templates are well pre-designed and with automatic functions, easy to customize and reuse. Try this simple yet powerful software to save your time and maximize your efficiency.
More Resources
Create SIPOC Diagram from Swimlane Flowchart


