Knowledge
Fishbone Diagram
Know it All about Fishbone Diagram
Part 1: What is Fishbone Diagram
A fishbone diagram is a tool to analyze cause-and-effect. It helps to find out the cause of defects, variations or failures within a process. The problem or effect is generally shown at the head or mouth of the fish. While the possible causes are listed on the smaller "bones".
It can also structure a brainstorming session as it can immediately classify generated ideas into functional categories.
Fishbone diagram is also relevant in product development. In the analysis stage of the product development process, fishbone diagrams can ensure that the new product has enough market to be popular. It can also pinpoint any issue with the prototype of the product or any wrong assumption about customer response. Market gap analysis can also use fishbone diagrams to see any room for innovation.
Finally, the fishbone diagram can also be used for troubleshooting and problem analysis to determine possible problems and initial issues. It helps launch a product in the market that is error-free and works for the clients without any hitches.
The other names for fishbone diagrams are the Ishikawa diagram and cause-and-effect analysis.
Part 2: Purpose and Benefit of Fishbone Diagram
Fishbone diagrams or Ishikawa diagrams are used in product development and troubleshooting processes. They are used for problem analysis by finding the root causes of the problems. Also, I used to focus a conversation around an issue. It helps to rate the potential causes according to their level of importance.
These diagrams are handy and precise tools in many situations. Its benefits are;
-
It helps in the identification of cause and effect relationships. When a complicated problem arises in the corporate and functional settings, it becomes rather difficult to pinpoint the exact reason for the malfunction or the situation. A cause and effect diagram, also known as a fishbone diagram, is a great tool to visualize a wide range of possible causes.
-
It facilitates brainstorming sessions. Brainstorming sessions may become counter-productive if some participants are shy and decide not to participate in the session. If we use turn by turn methods in brainstorming sessions and record the contributions in a fishbone, we can bridge this gap.
-
The gradual classification of the root and subsequent causes helps drill deep down into the problem and identify one or more root causes. It helps in making sure that no reason or underlying problem is overlooked.
-
It also supports the prioritization of the foundation causes. The more important reasons can be addressed first. This is especially important in environments that are related to essential services that cannot be stopped. Here, the priority is to bring the system back to operation.
-
It promotes broad thinking by going deep down into the issue and documenting every cause the team comes across.
-
It is also a great tool to record the outcomes of brainstorming sessions.
-
It promotes stimulation for problem-solving. In brainstorming sessions, visual representations of problems, solutions, and causes stimulate the participants to develop innovative ideas. Lack of visual presentation may not be as exciting.
-
The Fishbone diagram is a great tool to analyze logical relationships.
Part 3: What to do before creating Fishbone Diagram
-
While making a fishbone diagram, focus on the causes of the problem rather than the symptoms.
-
A detailed pre-analysis can make a massive difference in the outcome of the fishbone diagram. For example, in brainstorming sessions, a set of guidelines, standards, limitations and other such details give the participants a roadmap to walk on.
-
Leave space for detailed causes to let the diagram evolve from simple to more elaborate.
-
Encourage everyone to participate by asking each member to cause the problem in a cause and effect analysis and for ideas in brainstorming sessions.
-
Encourage each person to participate in the brainstorming activity and to voice their own opinions.
-
You may want to use the "five whys" technique in conjunction with the fishbone diagram.
Part 4: How to make Fishbone Diagram in EdrawMax
1. Launch the EdrawMax Program.
2. Goto New>Management>Cause and effect diagram.
3. Here, you can double click the cause and effect diagram link to draw a diagram from scratch.
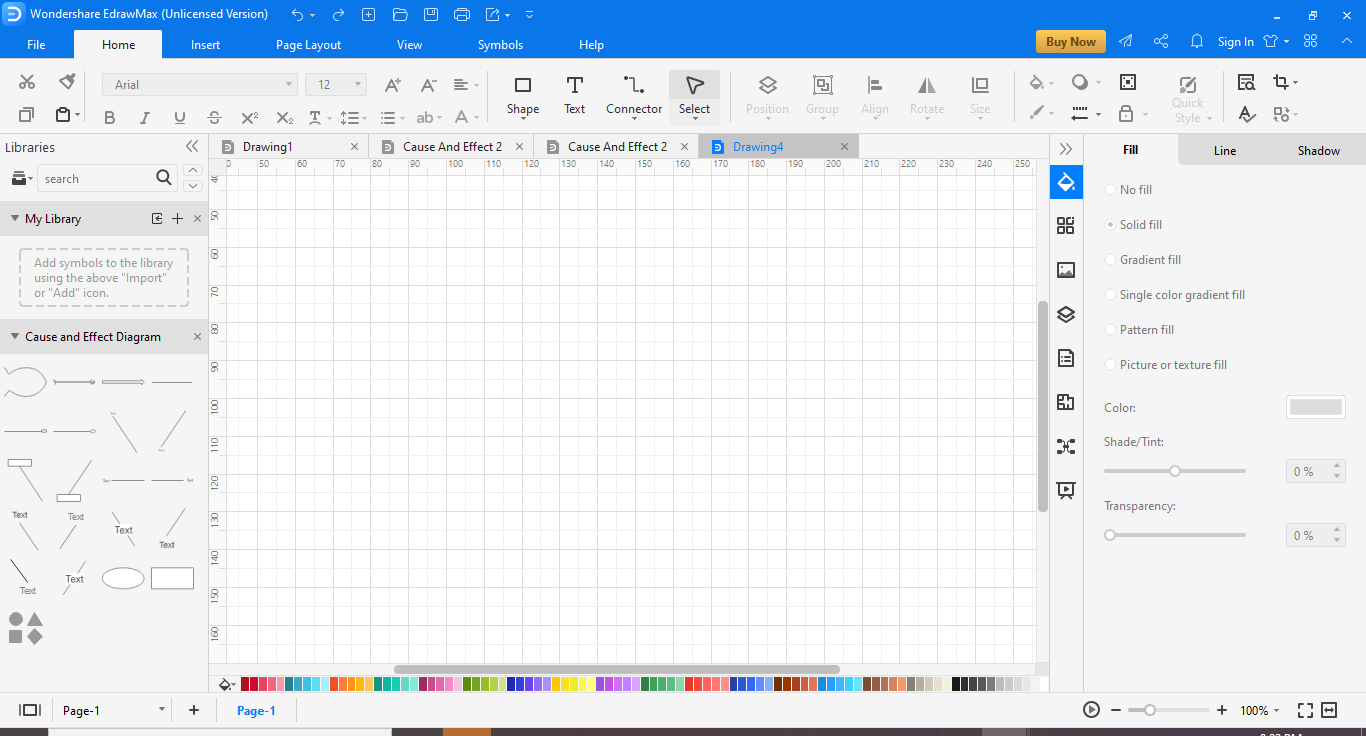
You can follow the steps given below to learn how to make a Fishbone Diagram
-
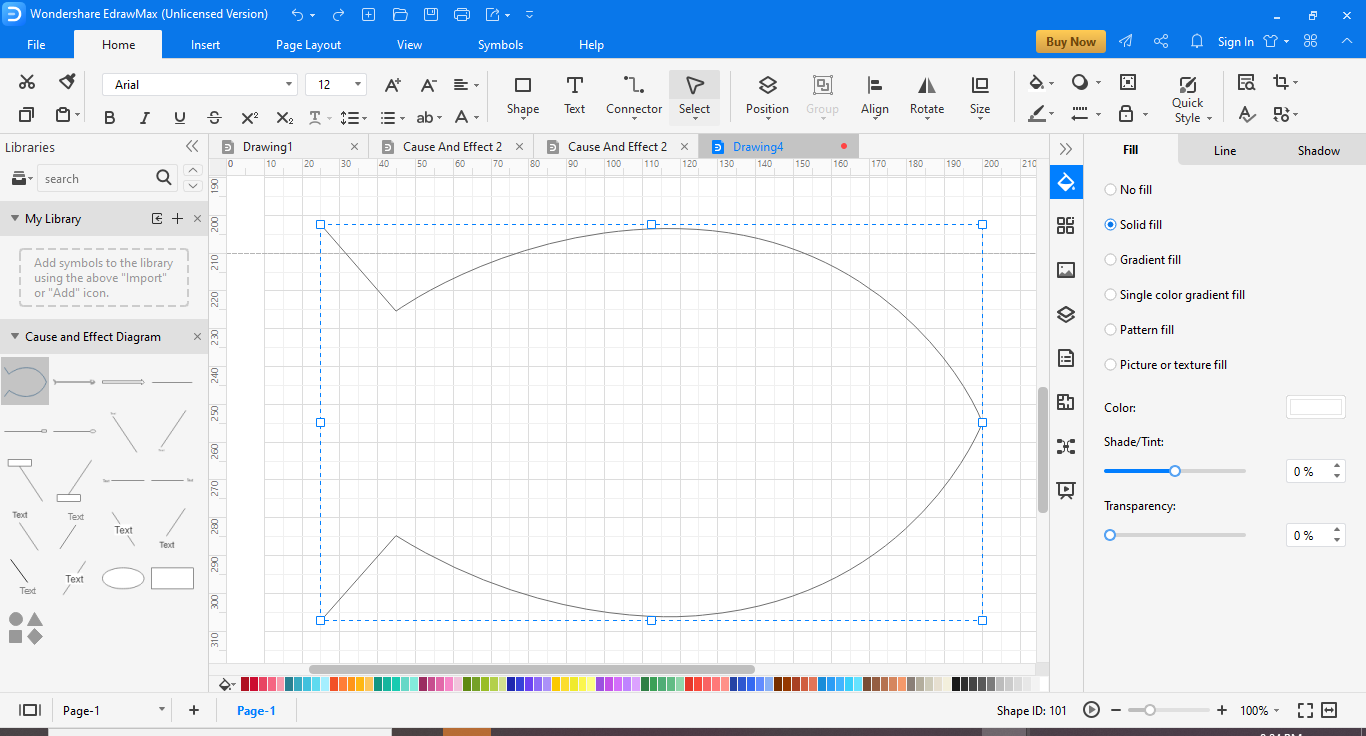
Drag fish shape in the diagram
-
Drag the Category 1 or Category 2 shapes onto the diagram. You will first make the backbone of the fish and then add the secondary conditions.
-
To add text, double-click the shape.
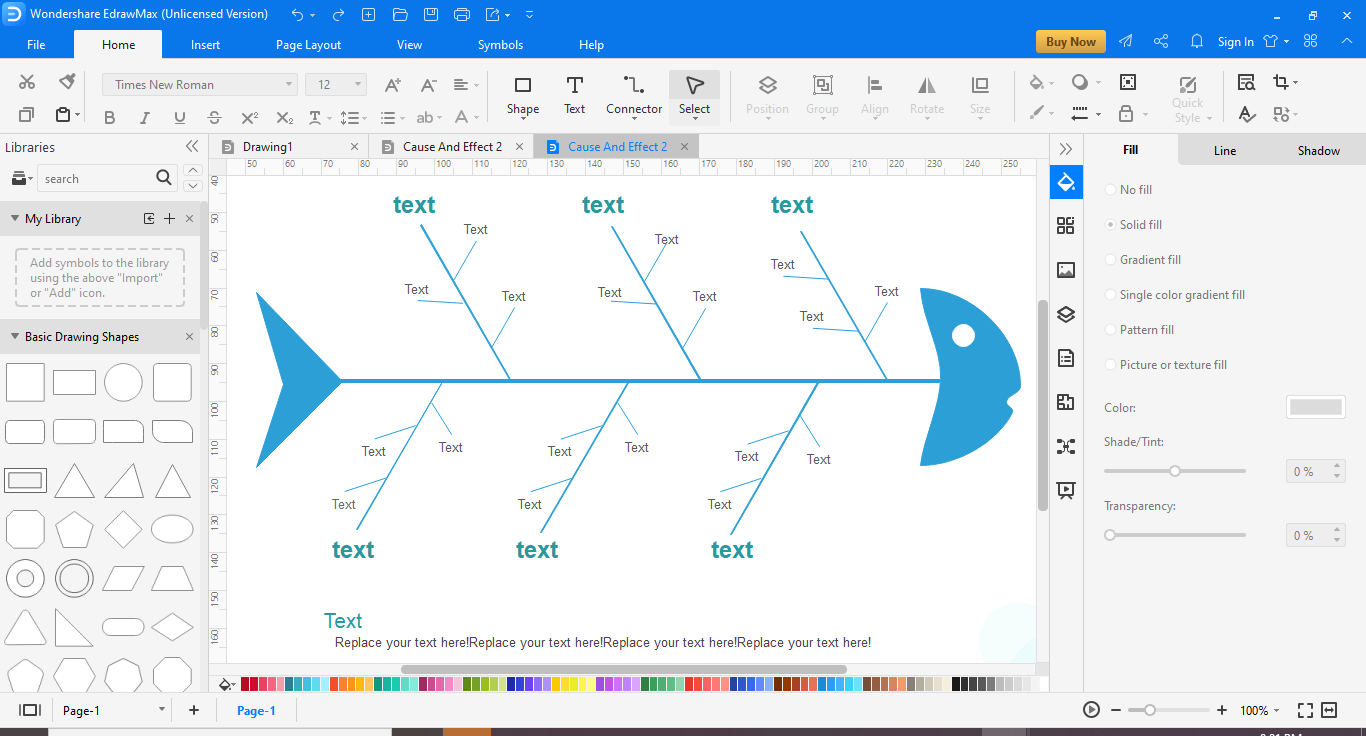
4. Alternatively, you can also select a template from the templates available. For this, select the cause and effect diagram on the top pane, and in the lower one, you will be able to see the templates to choose from.
Wondershare EdrawMax
An all-in-one platform for 210+ diagrams.
・ Simple alternative to Visio
・ 26k+ symbols
・ 10K+ free templates
・ 10+ AI diagram generators
Learn How to Create a Fishbone Diagram
Part 5: Tips for making Fishbone Diagram
-
Make an effective team to create a fishbone diagram. An effective means has members from multiple departments or areas to give their feedback for the issue. It ensures that the chart is a comprehensive visual document with insight from all involved perspectives.
-
Identify the categories. Categorizing the causes in categories helps in the organization of the solution efforts and promotes a better understanding of the problem.
-
Aim for a deep digging while doing the cause and effect analysis—the five why the technique is a great technique to help you with the investigation. You can use 5 Whys for troubleshooting, quality improvement, and problem-solving.
-
Consider a multi-voting technique to help identify the root cause. Each team member may determine the top three reasons.
-
Understand that a fishbone diagram is a visual tool and not a mathematical tool. You can find a chart challenging to read if you add many figures and details to it.
Part 6: An Example of Fishbone Diagram
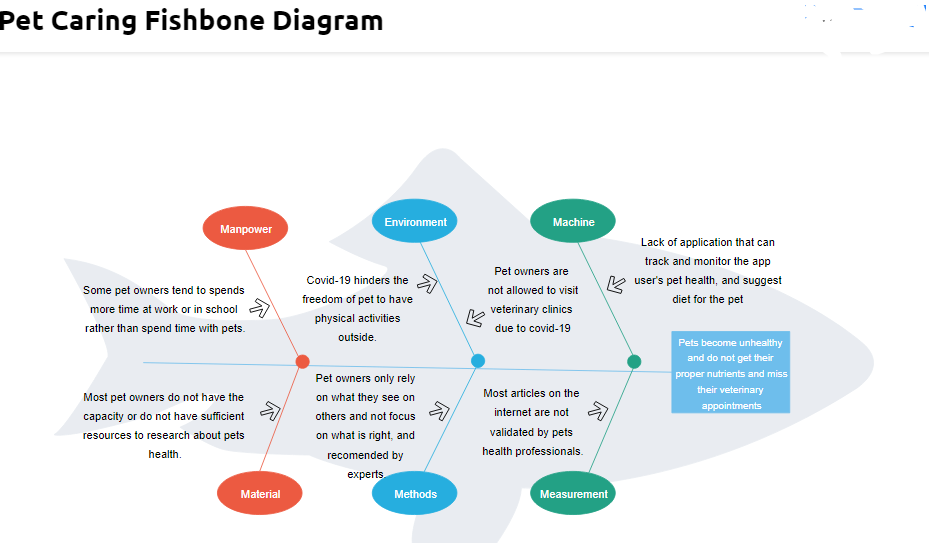
This is a pet caring fishbone diagram. It investigates the causes of pets being unhealthy and malnourished while also missing their veterinary appointments. The different reasons identified here are Manpower, environment, machine, material, methods and measurement. We can see some extra information along with the labels too.
Related Articles


