Fishbone Diagrams for PowerPoint
Sample Fishbone Diagrams for PowerPoint
This page presents an amazing collection of fishbone diagrams in PowerPoint format. They are highly artistic visuals that can attract attention in an instant. Use them to prepare presentations for corporate strategy and roadmap in slideshow, displaying cause and effect initiatives. You can also take advantage of the fishbone diagrams to present your goals to achieve and the ways to achieve them.
Fishbone Diagrams for PowerPoint - Low Market Share
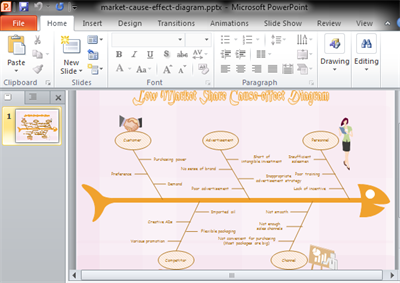
This fishbone diagram is accompanied with some clipart, making it vivid. Use it to find out the reasons for low market share.
Note: click the picture to download it.
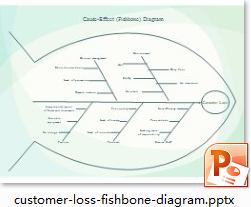
Fishbone Diagrams for PowerPoint - Low Customer Satisfaction
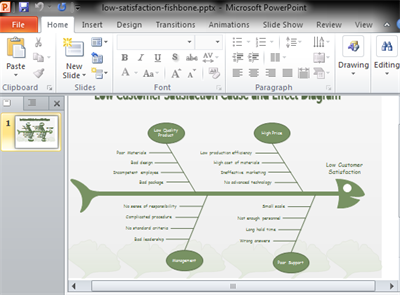
This PowerPoint fishbone diagram shows the causes for low customer satisfaction. By categorizing the reasons into 4 perspectives, it is more structurized and comprehensible.
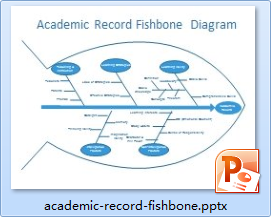
Fishbone Diagrams for PowerPoint - Lack of Reading Interest
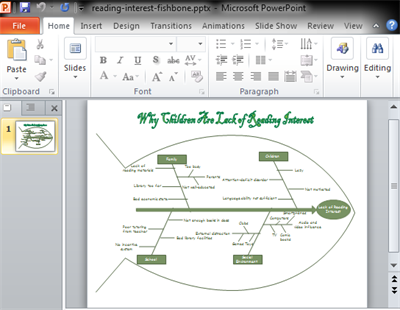
The above ppt fishbone diagram is about education problem. It probes into the problem of children's lack of reading interests.
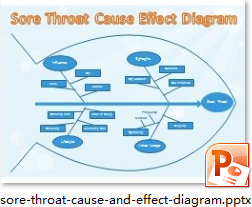
Fishbone Diagrams for PowerPoint - Healthy Lifestyle
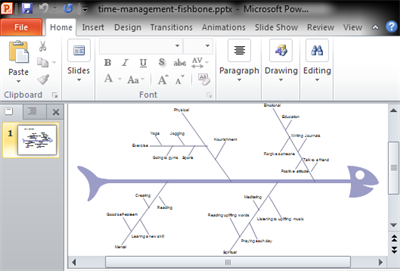
Presented above is a PowerPoint fishbone diagram specially designed for showcasing solutions for a goal. It presents some useful tips to live a healthy life.
The table below shows 4 more PowerPoint fishbone (cause-effect) diagram for your reference.
|
|
|
|
Click here for more fishbone diagram examples.
Easy Fishbone Diagram Maker
Edraw is a diagramming tool that excels at information visualization. It includes over 10,000 vector shapes and hundreds of diagrams that present data in a pictorial way. Included are also various fishbone diagrams. They show cause and effect relationship visually. It offers a set of specialized fishbone diagram symbols. These shapes support drag-and-drop function and can connect automatically. See more details in Fishbone Diagram Software.
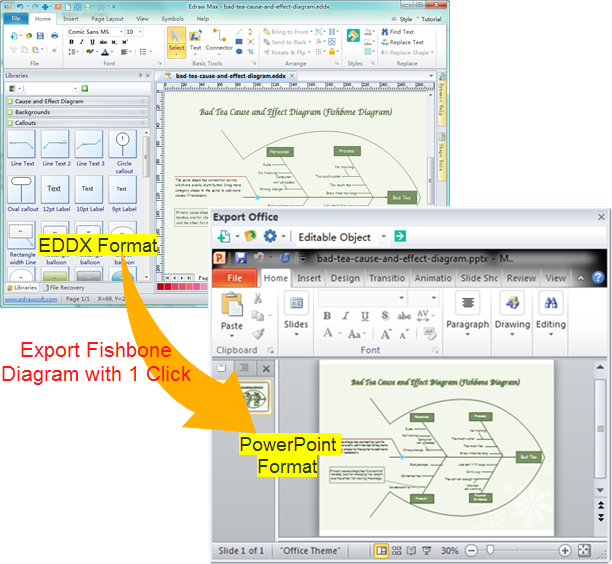
Create Fishbone Diagrams for PowerPoint
In Edraw, 1 click turns the fishbone diagram into a fully editable PowerPoint file. Just click the Export button on the Quick Access Toolbar.
EdrawMax
All-in-One Diagram Software
- Superior file compatibility: Import and export drawings to various file formats, such as Visio
- Cross-platform supported (Windows, Mac, Linux, Web)


