Process Infographic
Edraw Content Team
It is a part of nature that humans understand the pictures clearly and easily. The visual input gets easily processed in the human mind. So, if we try to make people understand our point quickly, we should give them visual information, which means lecturing them through graphics.
Have you ever tried to break down a complex process into multiple, short, and easy-to-understand steps? A teacher who is struggling because his students do not understand difficult topics or a manager can be benefitted from this strategy that should break down the complex project into hundreds of steps.
In this article, you will get valuable knowledge about the process infographics and the steps to make them.
What is a Process Infographic?
As mentioned above, humans can easily understand if they get the input in the graphics form. The term process infographic is related to it. An infographic is a chart that represents the data, knowledge, or information in graphics, colors, graphs, etc.
So, the idea is if we break our complex and difficult-to-understand processes into multiple, short steps, then they can be easily accomplished. We can decorate those steps onto infographics in the form of graphics, appealing fonts, graphs, etc.
In a nutshell, a process infographic is nothing but a chart representing a complex process divided into multiple steps in the most appealing and exciting way.
How do infographics illustrate the process and steps?
An infographic or a process infographic summarizes the complicated process into a short form rather than depicting the large overwhelming paragraphs
For example, suppose a cybersecurity auditor wants to audit the information technology department of a big organization. In that case, they can do it by simply dividing the whole auditing process into multiple steps and accomplishing it one by one. They can mention that process in the infographics and even publish it throughout the whole organization.
Process Infographics
Behaving on our point as mentioned earlier that a human understands the visuals easily, here, in this section, we will give some visual inputs of the process infographics that will make your mind clearer about what process infographic is in practical?
Example 1: Flowchart
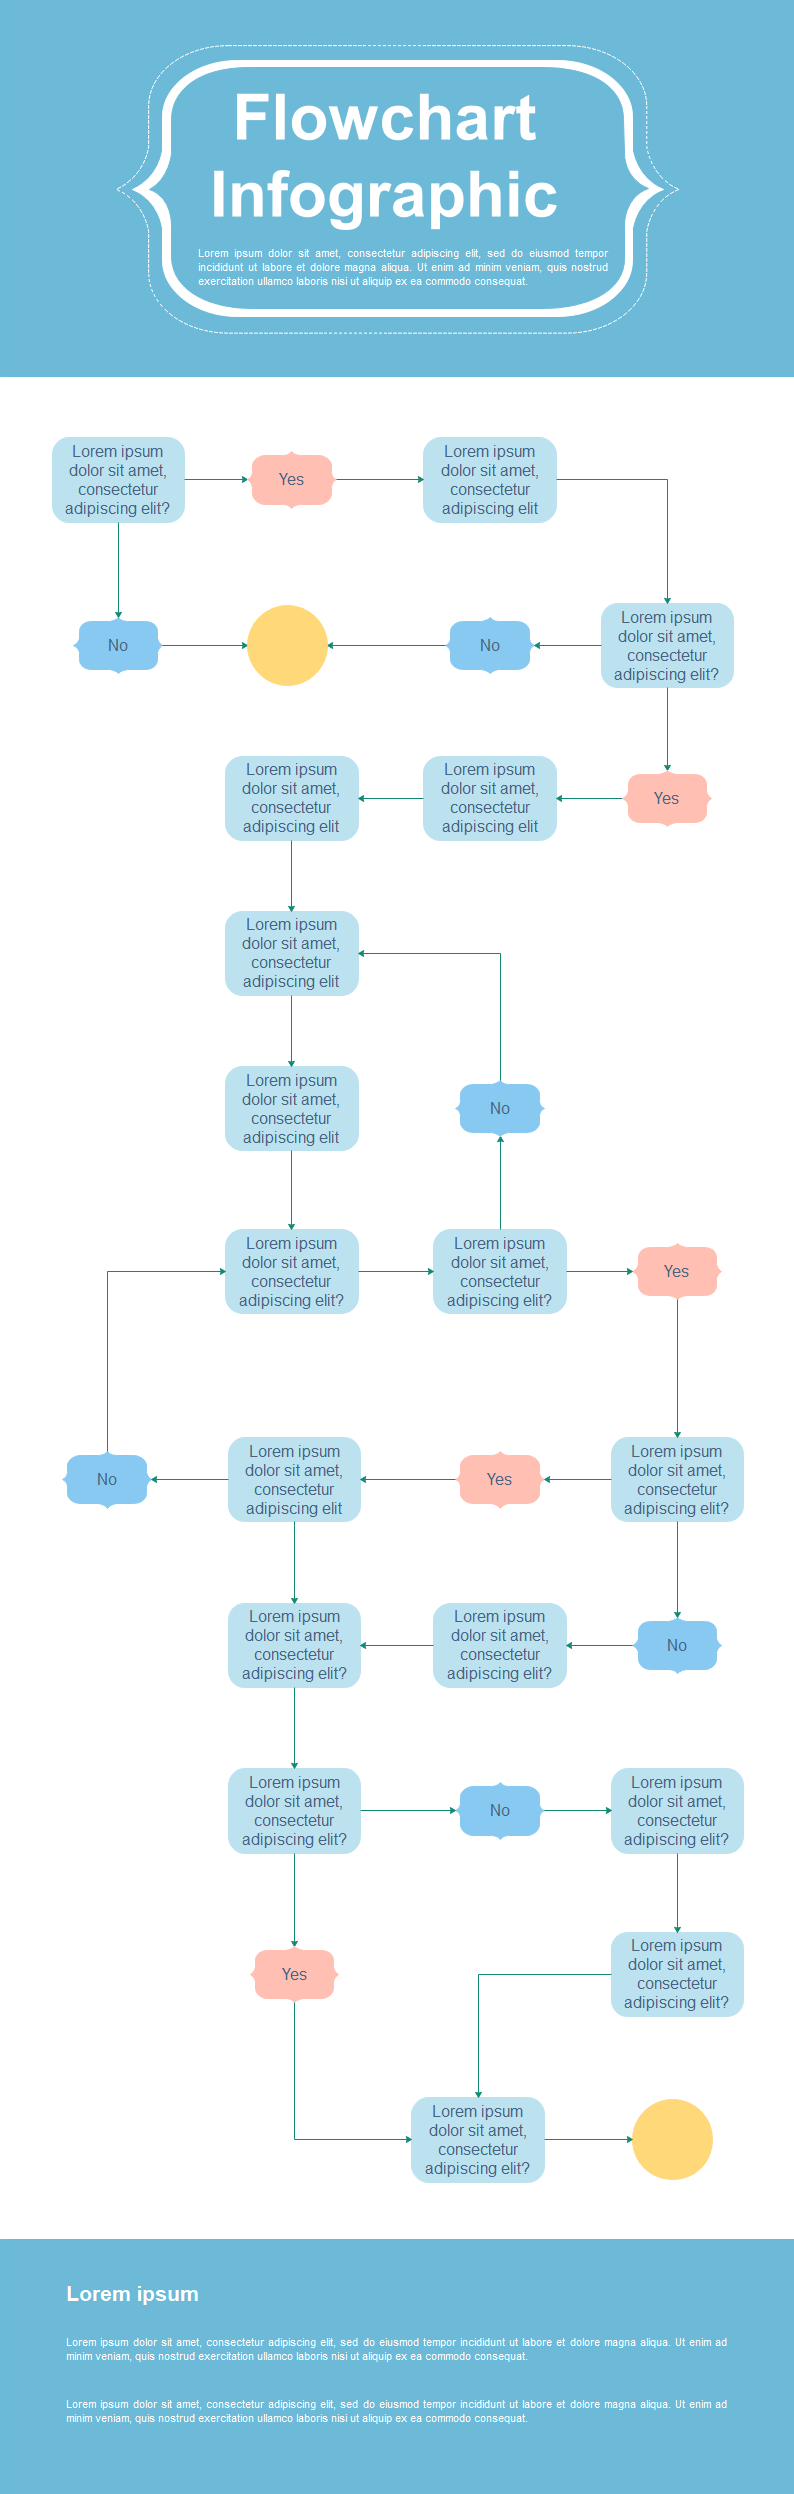
A flowchart illustrates how the work can be done by dividing the process into steps. It is the most appealing form of process infographics depicting a flowchart of a customer journey process. The infographic covers all the steps necessary for a business to deal with its customers. The starting point is from reviewing the goals of an organization. Then a business has to do research on everything related to the product and customers, and so on. When making a flowchart diagram using infographics, use the graphics of every step and link them with sequence. The arrows play an important point while connecting each step.
Example 2: Workflow
A workflow describes the points that show how the work has been done in an organization. The workflow diagram depicts an organization's workflow so that the related teams can communicate and collaborate. The above-pinned infographic summarizes how the work flows from different departments.
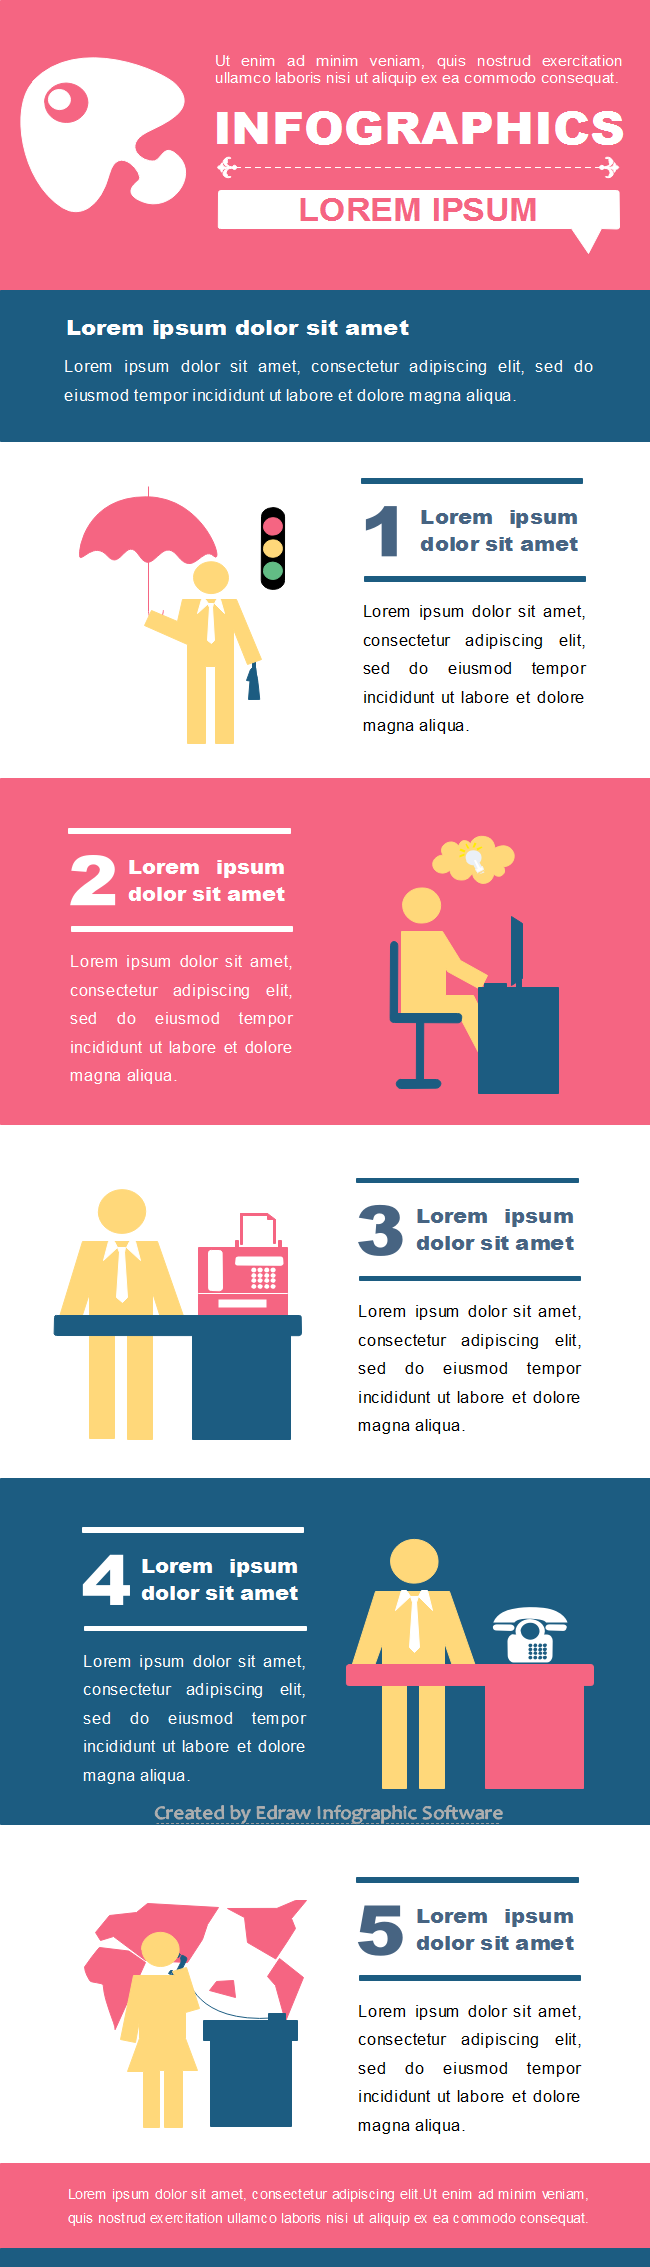
Example 3: Step by Step Process
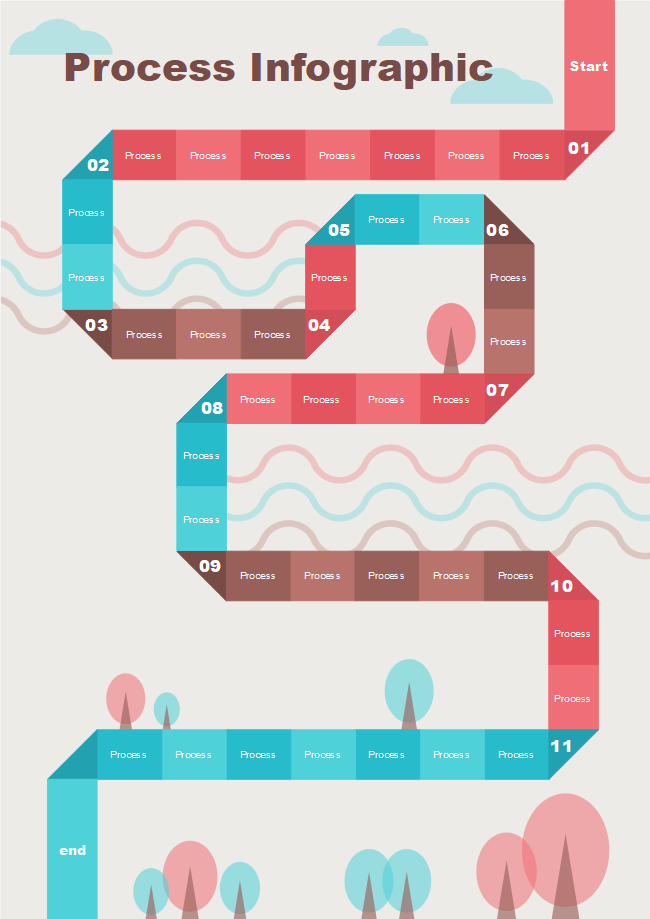
In the step-by-step process, the whole process is divided into multiple phases and then joined sequentially so the steps can be followed easily and quickly. In the above-pinned infographic, the step-by-step process of the business launching is shown. Like the above example, any process can be divided into steps and displayed on infographics. The first step is research before starting the business, getting ideas from different sources and the research. Finally, we derive an idea that becomes the root cause of our business.
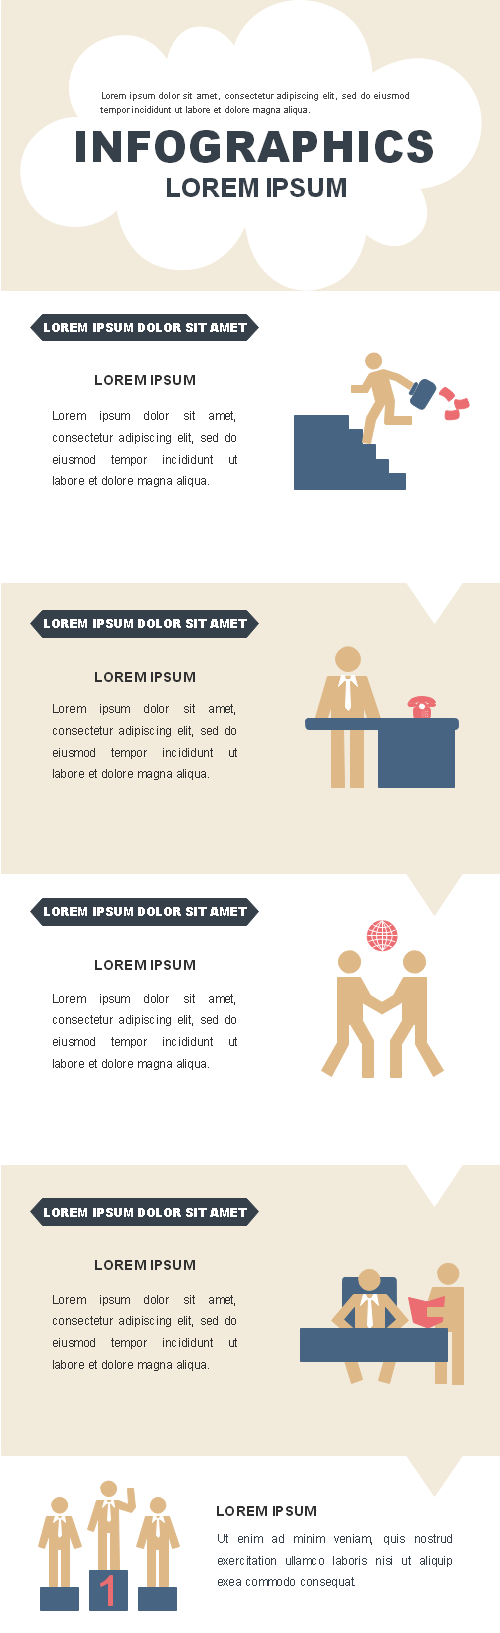
Example 4: Action Plan

An action plan is the steps of construction that we need to perform to succeed in our project. The action plan shows the stages of a complex process. The above infographic is the best example of the action plan. Everything starts from a strategy, mainly a plan to accomplish something. That plan becomes our objective in which an organization or establishment survives. We collaborate with different people and work with them to accomplish our objective. And then, we start the actual process step by step.
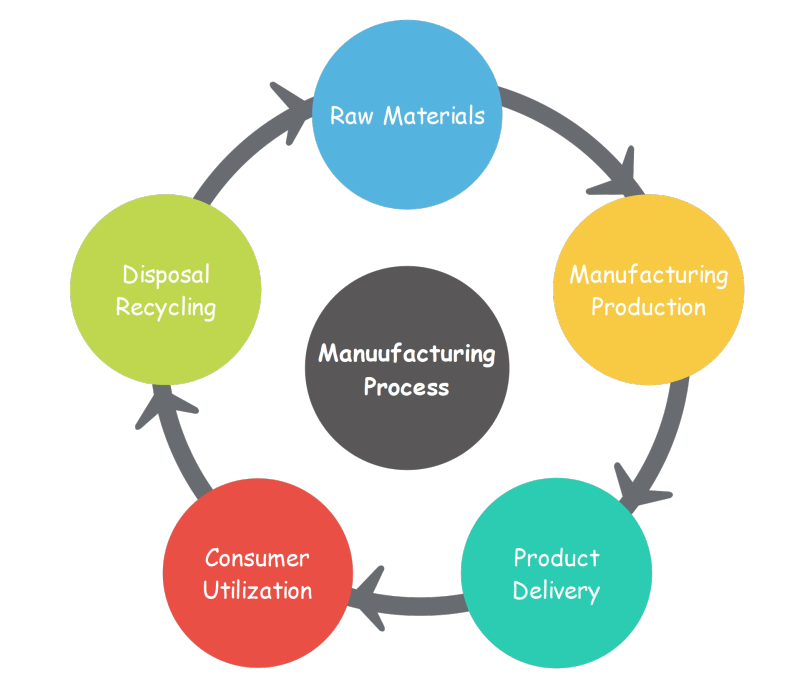
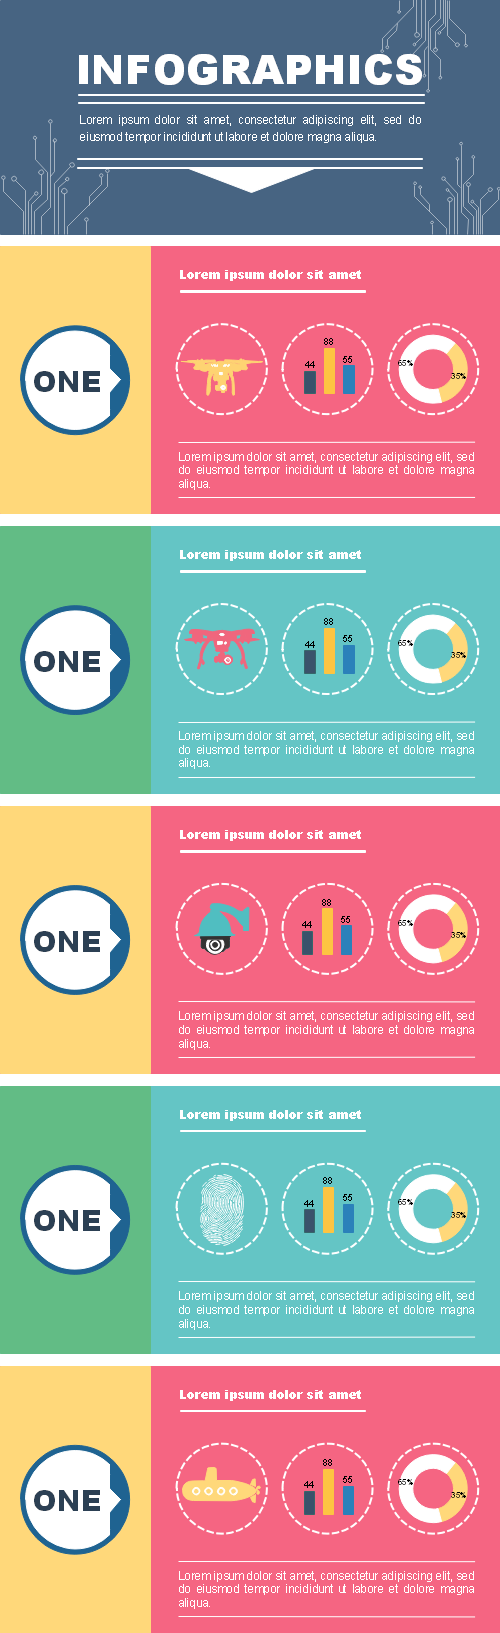
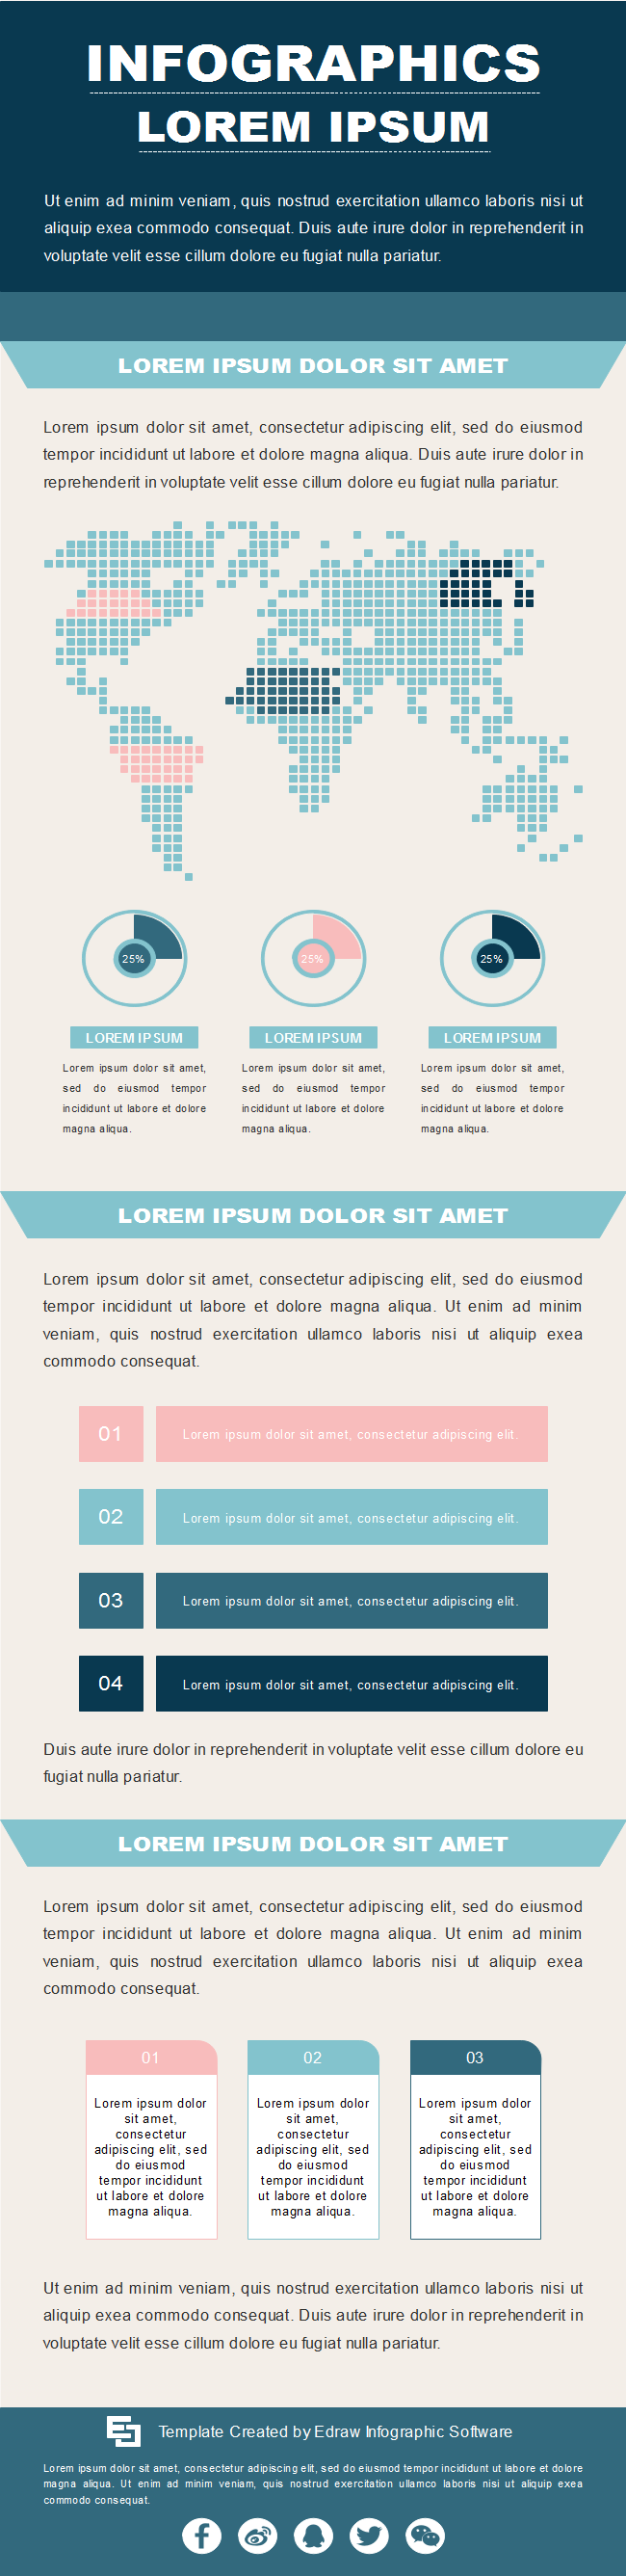
Example 5: Business Process
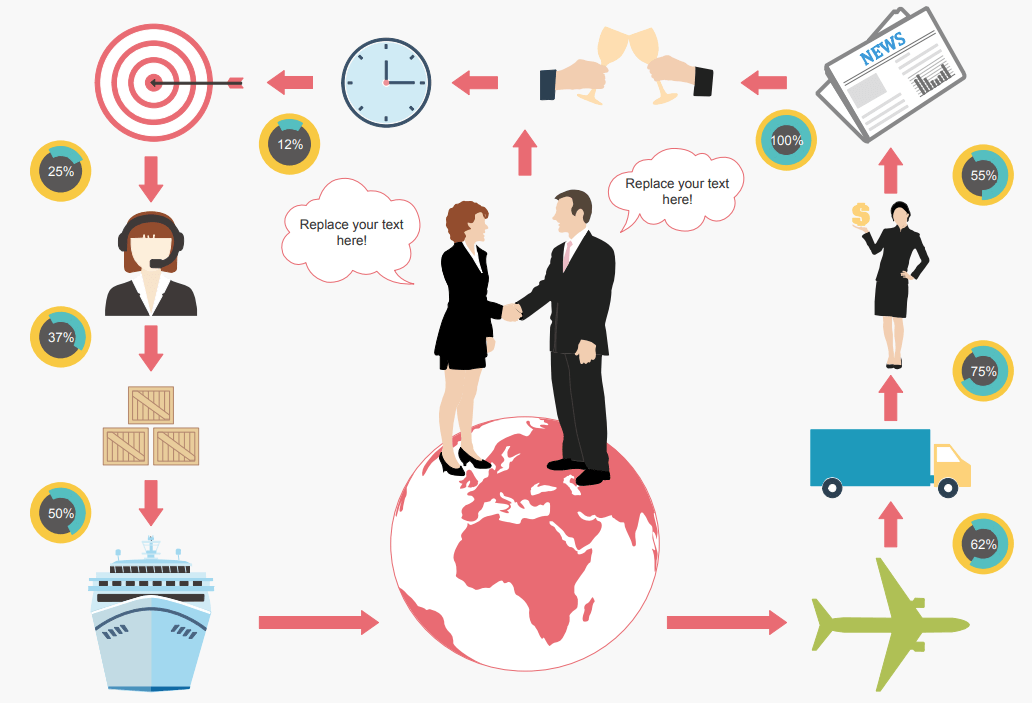
A business process can be any process necessary to make a business function and be successful. Fortunately, we can define the business process on the infographic easily. In the above infographic, a process for measuring business processes is given. The starting point is the process effectiveness, how much the process would be effective in uncertainties, etc. And then, we measure the process efficiency and so on. We can define any of our business processes on the infographic so the employees can understand it easily.
How to Create a Process Infographic?
This section will tell you the process for making the process infographic in a general way. All the below steps will be followed sequentially.
Step 1: Choose a process you want to explain
Before actually making the process infographics, you have to think about what process you will explain in this infographics. Take that process and divide it into multiple steps until the whole complex process becomes easy to understand.
Make the whole maze of the process a linear process that is a process with start and end. For example, if you want to make an infographic on the startup, you will divide the whole process.
- Research
- Idea
- Aspiration
- Process
- Experience
- Time
- Experience
- Income
- Goal
You can also make an infographic relevant to your processes.
Step 2: Target the audience
The most important part of the communication is that you have to be concerned about the target audience. The audience is the people to whom you will explain this process in the form of an infographic.
The audience can be your students, colleagues, employees, or people you don't know. The people near you, like your students, colleagues, employees, etc., are easy to understand, but you have to do a lot to understand the people you don't know.
Step 3: Gather all the data and information
The most important part is gathering all the data and information related to the process. You have to be very careful about the data. Your data and information should be correct and reliable.
Get the information from the most reliable sources that you trust. Get the data from trustworthy internet sites as well as from books.
The best practice is to get the data from the source to produce the information you are making infographics. For example, to raise awareness about the Covid-19, you will get the data from the World Health Organization, Vaccine manufacturers, etc.
Step 4: The title and basic structure
Choose the best title for your infographics that also shows the meta description of your whole infographic. Your title should be concise.
If your data are relevant and you doubt that separating them would break the content flow, put your data in the hierarchical format. Moreover, choose the color of your template that relates to the topic of your infographic. Add more colors, graphics, appealing fonts, etc.
Step 5: Review and remove mistakes
After making your infographic, review it from the start till the end for troubleshooting any mistake. Show it to your seniors. After scanning, publish it. You can give it to your students and explain the process with it. As a manager, you can explain the business process by keeping your infographic on the front and also posting the process infographic on social media.
Knowing your audience is the most important factor of successful communication. Your audience is your power, so you must satisfy the audience for the best results. Pay all your abilities to understand them.
More Free Infographic Templates

EdrawMax
All-in-One Diagram Software
- Superior file compatibility: Import and export drawings to various file formats, such as Visio
- Cross-platform supported (Windows, Mac, Linux, Web)


Edraw Content Team

