Climate Change Infographic
Edraw Content Team
Rising Earth temperature, Ocean levels are rising, global warming is happening at its fastest pace than ever before, wildfires, melting glaciers, drying lakes and rivers, the Ozone layer is damaging, and a lot more terrifying news we hear every day in our life.
All the problems our Earth faces mentioned above, and more problems related to the destruction of nature are due to climate change. So, what is climate change, and why should we care about it? And why it is crucial for future generations that we take action to preserve nature now.
This article will tell you all about climate change and the infographics used to define climate change, some examples of infographics, and how to make them.
What is Climate Change?
The older people living in a particular place for a long time will second that the typical climate of that place is behaving or changing so quickly into its opposite. In a nutshell, climate change refers to long-term shifts in temperatures and weather patterns.
So, why is the typical climate of the world changing so quickly? The only true answer is human behavior. The immense burning of fossil fuels and minerals like coal, oil, gas, etc., is causing the fast production of greenhouse gases, primarily carbon dioxide, into the atmosphere.
The greenhouse gases trap the heat coming from the Sun that causes an increase in the temperatures. Not only rising temperatures, but these gases also cause immense damage to our Ozone layer, and that causes global warming.
Why Use Infographics?
The climate change infographics are the pictorial representation of the Earth's climate. The data on the climate change infographics is collected through satellite and weather predicting stations.
- These climate-changing diagrams vary in forms. In the below section, we will see some of the examples of these diagrams.
- These climate-changing diagrams tell us about the rising sea levels, pollution, genetic diversity, solar radiation, glaciers, the vegetation of the Earth.
- These diagrams tell us how climate change has devastated the nature of the Earth. Some charts also describe how to take measures against climate change.
Advantages of Climate Change Infographics
There are hundreds of benefits of using the infographics of climate change. Some of them are listed below.
- These diagrams increase awareness among world leaders and individuals about the damages that climate change is causing.
- Infographics of climate change give us the data from satellites that are 24/7 monitoring Earth. Using this data, we can perform every step in our ability to mitigate climate change.
- These charts help scientists and engineers invent the tools and technologies that help preserve the nature of the Earth.
- By seeing this data, the regulatory bodies can take action against the parties causing damage to the Earth's atmosphere like extensive use of coal, oil, gas, etc.
Climate Change Infographics
Example 1: Climate Change in Asia and the Pacific
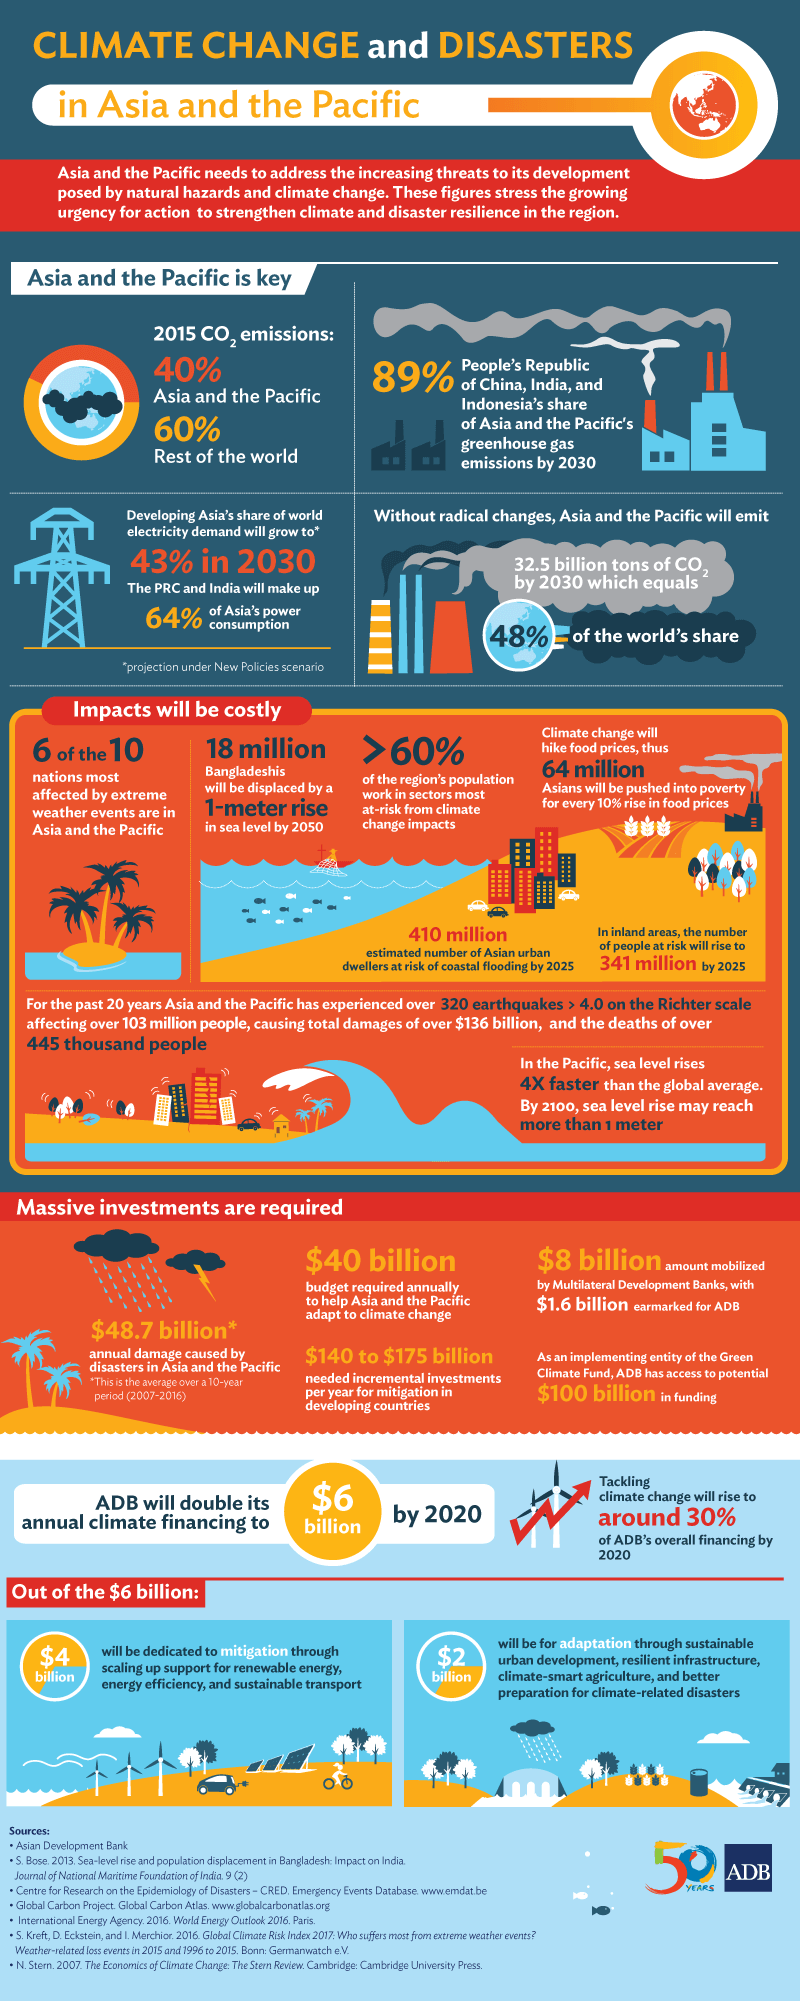
Image Source: www.adb.org
The illustration clearly shows us the data collected from different places, how much damage has been done by climate change, and how humans are causing climate change. The data above is of climate change in Asia and Pacific region areas.
The data says that about 40% of CO2 is emitted from Asia and the Pacific region. The chart also shows how much these climate change-causing factors will increase in 2030 and 2050. The infographic is also showing the effects of climate change in these areas. Like, rising temperatures, rising sea levels, etc.
Example 2: Global Warming
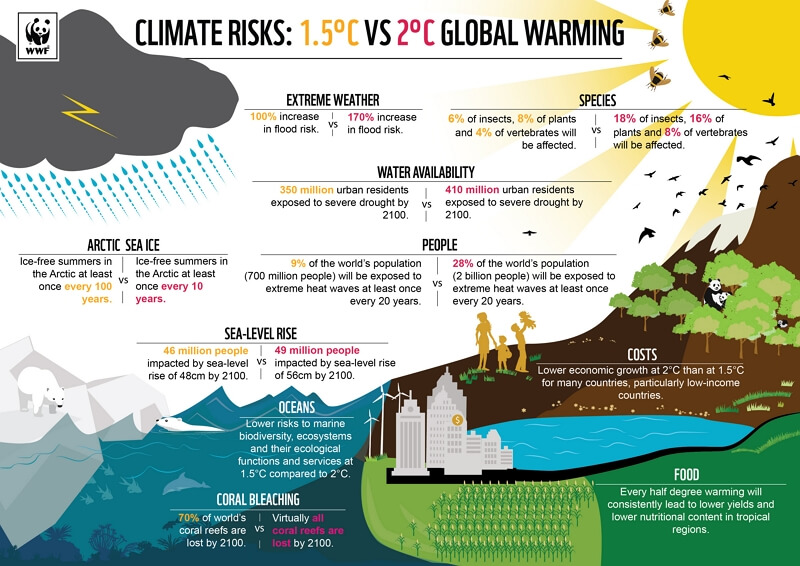
Image Source: www.wwf.org.uk
The diagram shows the climate risks caused by global warming. Due to the rising temperatures caused by climate change and global warming, sea levels are rising rapidly. The data clearly shows that the world is witnessing the hottest summers due to global warming. This infographic also described how the creatures inside oceans are affected. The graph also depicts the drought scale and how the water shortage has increased in urban and rural areas.
Example 3: Air Pollutants
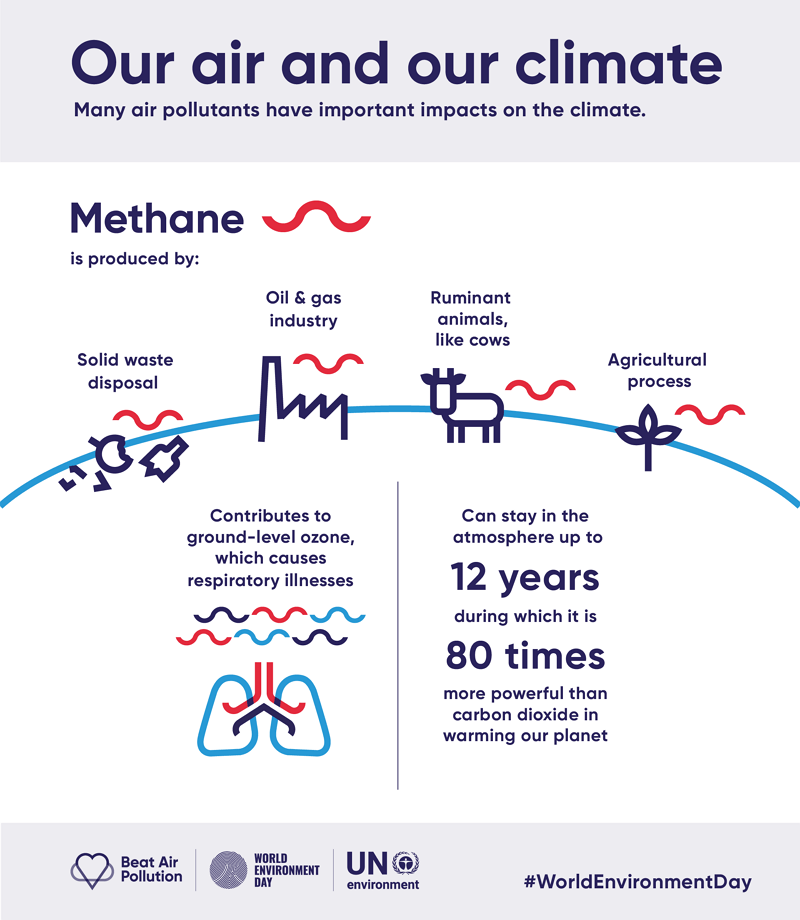
The diagram is all about the air pollution caused by burning fossil fuels like coal, oil, gas, etc. The diagram shows the leading cause of air pollution is methane in the atmosphere. Solid waste disposal, oil and gas industry, ruminant animals like cows, agricultural processes, etc., are the main cause of methane gas production in the atmosphere. Health concerns also show that people of different ages face respiratory illnesses caused by methane. This infographic shows the biggest concern that methane is 80 times more potent than carbon dioxide.
Example 4: Earth's Carbon Cycle
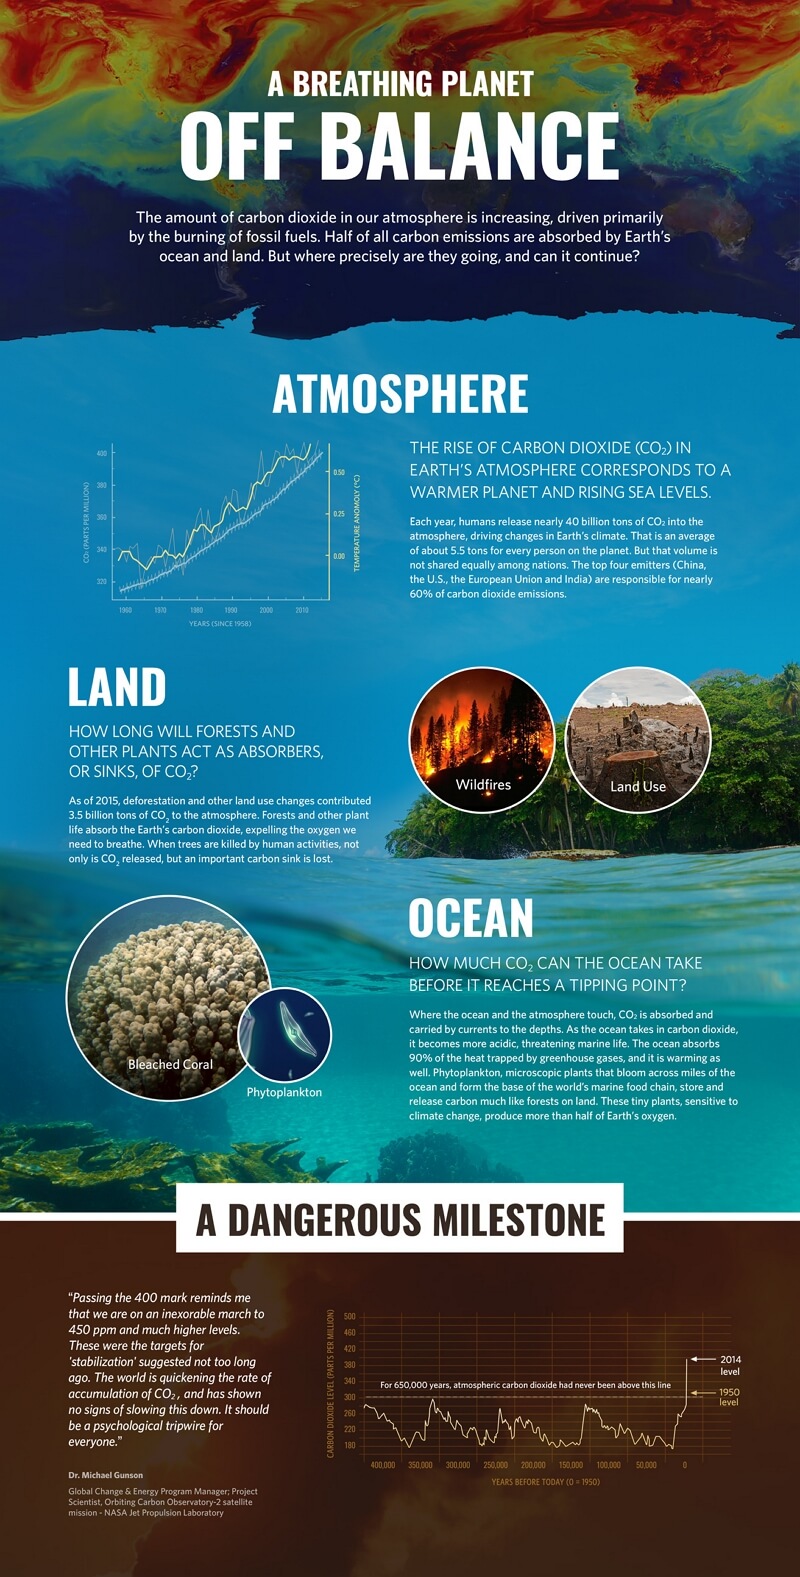
Image Source: climate.nasa.gov
The infographics show us the data about the Earth's carbon cycle. The leading cause of rising ocean levels and temperatures is the imbalance of Earth's carbon cycle. The release of carbon dioxide in the atmosphere has increased more than it was released ten years ago. These hot climates are causing wildfires, drought, giving immunity to various diseases like black fungus, etc. The immense release of carbon dioxide has bleached millions of coral reefs and marine life, which is badly devastated due to it.
Example 5: Climate Change and Your Health
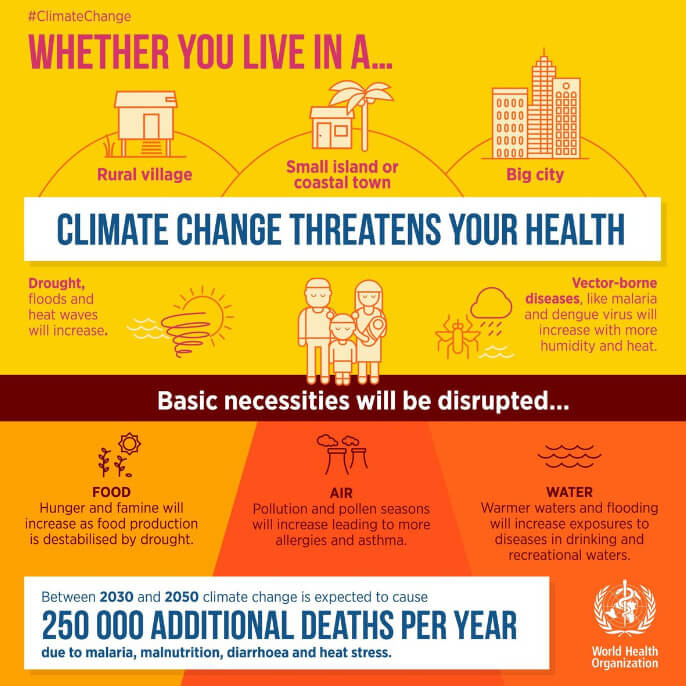
Image Source: www.niehs.nih.gov
This type of infographic shows the deteriorated human health caused by climate change. The data shows that severe weather has caused mental health issues among people of all ages. Immense hot temperatures are the cause of cardiovascular failures. Malnutrition and diarrhea are caused by the water and food supply impacts. The bad quality of water due to climate change causes cancers and tumors. Air pollution is the leading cause of respiratory diseases. Change in vector ecology is causing excellent immunity to viral diseases.
Example 6: Climate Change in Europe's Regions
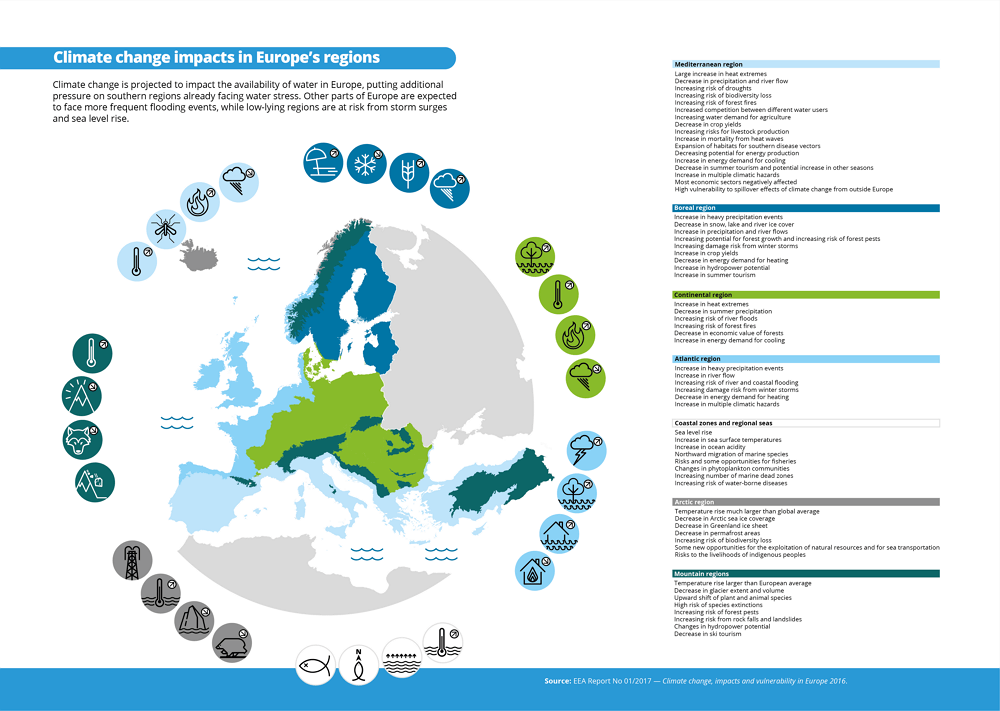
Image Source: www.eea.europa.eu
Climate change has also severely affected the European areas. The infographic above shows the following data. Climate change has badly caused the water shortage in many countries of Europe. A decrease in precipitation and river flow is caused by climate change in the Mediterranean region. The boreal region is witnessing heavy precipitation events. The temperature is badly rising in the Atlantic region. The climate change in the Arctic region is causing the ice to melt at a fast pace, causing a rise in ocean levels.
Example 7: Climate Change and Agriculture
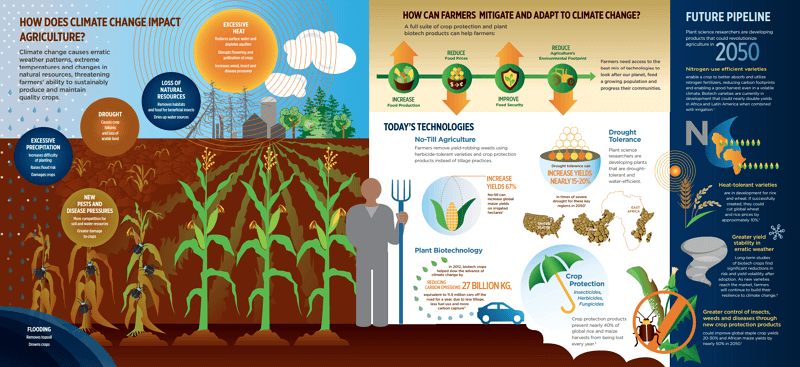
Image Source: croplife.org
The infographic shows that climate change also severely damaged agricultural areas. The rising sea levels and melting glaciers are causing floods in rural areas, causing soil erosion. The immense release of carbon dioxide and methane has caused various crops diseases. Drought and water shortage have annihilated the fertile land so much. Severe hot temperatures have badly affected the growth of crops and various flowers. The destruction of crops is causing food and other resource shortage.
How to Create a Climate Change Infographic?
Step 1: Define the target audience
Defining the target audience is an important aspect of successful communication. So, before starting making the infographics, you have to decide who is the audience you are going to deliver this climate change information to.
The audience is the external normal people who understand everyday language not so difficult and extreme. You are not going to make this infographic for your colleagues or interns.
You have to draw this chart so that the data can be easily understood by normal people who don't understand the science much. Transform all data you have collected into a normal human language.
Step 2: Include visuals
The second step is to gather the relevant visuals to the graphs. The main idea is not to only put the charts in spreadsheet form and broadcast it. It will make people never understand it. You always put a lot of graphics on your infographics. Remember again here that your audience is the normal people.
When you include the graphs, always remember to make them colorful and appealing. The data on them should be placed so that everyone can easily understand the point.
Step 3: Gather the information
The third step is to gather all the information you have to add to the infographics. Here, when we talk about climate change, the information should only be related to it.
- Gather all the data you have collected from various places like satellites, weather stations, etc. Most importantly, your data should be correct and supported by the people above your position.
- Include all the data. Never leave it incomplete. When you are talking about climate change, then the perfect infographics will include SOPs, damages, causes, future predictions.
- The SOPs will cover the mitigations for climate change, and damages will cover the bad effects caused by climate change. The causes will tell how and why the climate is changing terribly. The future predictions will include prophecy that climate change will occur at a faster pace.
- Always explain the overview first, then explain each point in depth with graphs and graphics.
Step 4: Choose the types of infographics
Step four is to choose which type of infographic you will make. There are several infographic types:
- Gather all the data you have collected from various places like satellites, weather stations, etc. Most importantly, your data should be correct and supported by the people above your position.
- Include all the data. Never leave it incomplete. When you are talking about climate change, then the perfect infographics will include SOPs, damages, causes, future predictions.
- The SOPs will cover the mitigations for climate change, and damages will cover the bad effects caused by climate change. The causes will tell how and why the climate is changing terribly. The future predictions will include prophecy that climate change will occur at a faster pace.
- Always explain the overview first, then explain each point in depth with graphs and graphics.
Step 5: The whole organization should own it
Last but not least, getting the stamp of revision on your infographics means that the whole organization should own their part while making the infographics. If something goes wrong, everyone should be responsible for it and not an individual.
More Free Infographic Templates
EdrawMax
All-in-One Diagram Software
- Superior file compatibility: Import and export drawings to various file formats, such as Visio
- Cross-platform supported (Windows, Mac, Linux, Web)


Edraw Content Team

