UML Deployment Diagram Examples
Know it All about UML Deployment Diagram & Create
The deployment diagram is a way of illustrating the hardware and software of a system. It aids in visualizing the processors, nodes, and the linked devices. In UML modeling, these diagrams act as a great way to describe the run time of processing nodes and specify their details for construction purposes.
A deployment diagram is constituted of five elements that have been described below.
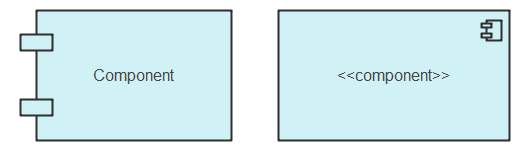
A component is described as the implementation unit block of a system showing the independent and interchangeable parts of that system. It is a group of classes that can be classified based on their type.
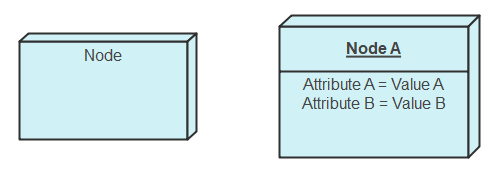
A node is an element that represents a system’s computational resources with the ability to memorize and process the information. They can also be linked to a communication pathway to sketch the network structures. In most cases, a node is named on the hardware device it represents.
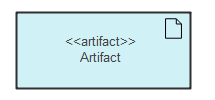
Artifacts are the elements that represent a physical piece of information. These elements act as the physical implementation units that are a result of the development process. Examples of artifacts are executable files, software units, documents, data files, and information libraries.
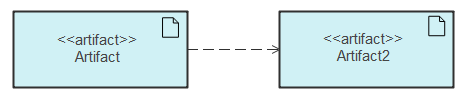
As the name indicates, dependency specifies the model element that depends on another model element. If a change is introduced on the target element, the dependant element also suffers the change. A dashed line with an arrowhead shows them.
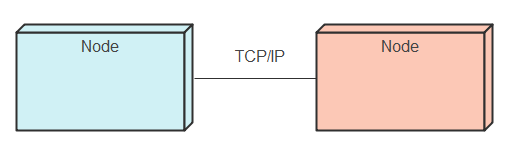
In a deployment diagram, the connection shows the communication path used by the hardware. It also indicates the method of communication.

・ Simple alternative to Visio
・ 26k+ symbols
・ 10K+ free templates
・ 10+ AI diagram generators
Deployment diagrams are a practical way of representing the working of the system. Given below are some diagram examples of common scenarios. Have a look to understand these types of UML diagrams better.
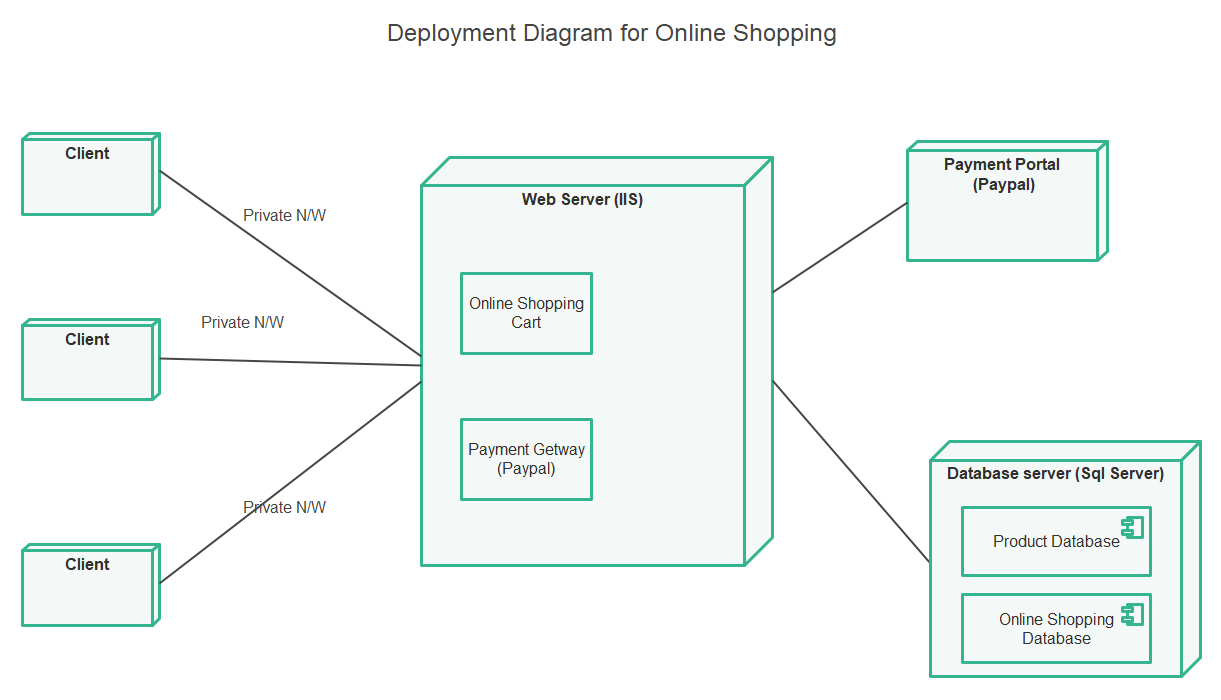
Here is a diagram that represents the deployment diagram for online shopping. There is a database server (SQL Server) and a Web server (II S) connected with each other. The diagram shows how multiple clients can be shopping at once.
After the customer adds things to his cart and finalizes his shopping, he is led to the payment portal. The web server is connected with the database server, which includes the product’s information and the history and information about online shopping.
Source: www.uml-diagrams.org
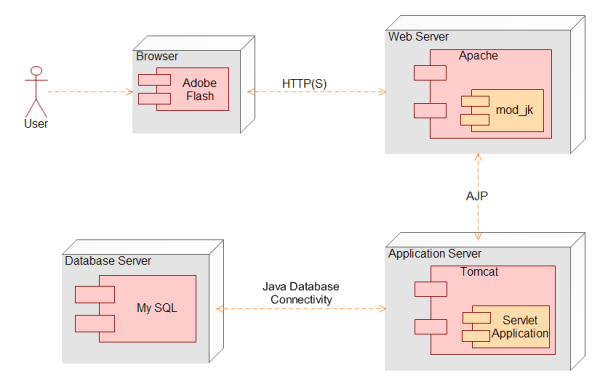
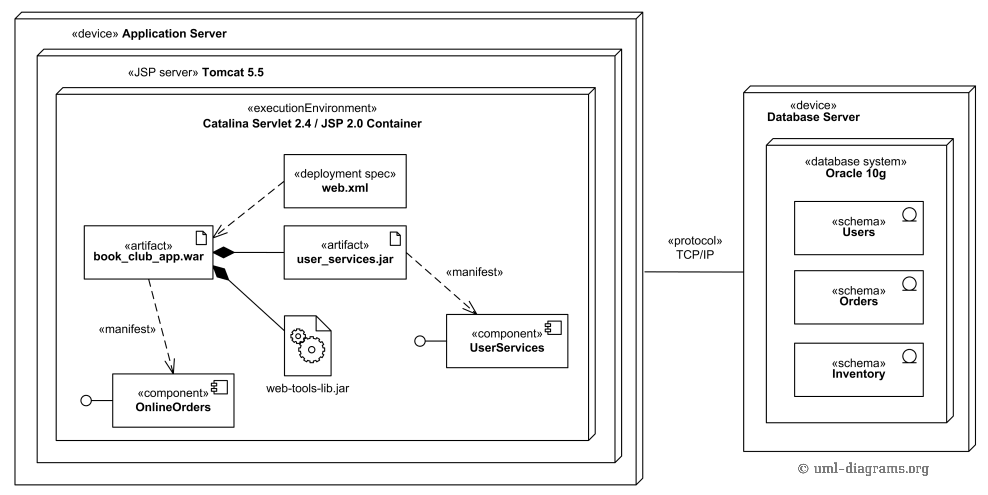
This deployment diagram maps out the working of a web application. The book club war application has been deployed on the Catalina Servlet 2.4 / JSP 2.0 Container, which itself is contained in Apache Tomcat 5.5 Web Server.
The database system is deployed in the database server and contains three artifacts: online order, user services, and inventory. An application server and a database server are connected with a TCP/IP connection. The database system processes the requests of the viewers.
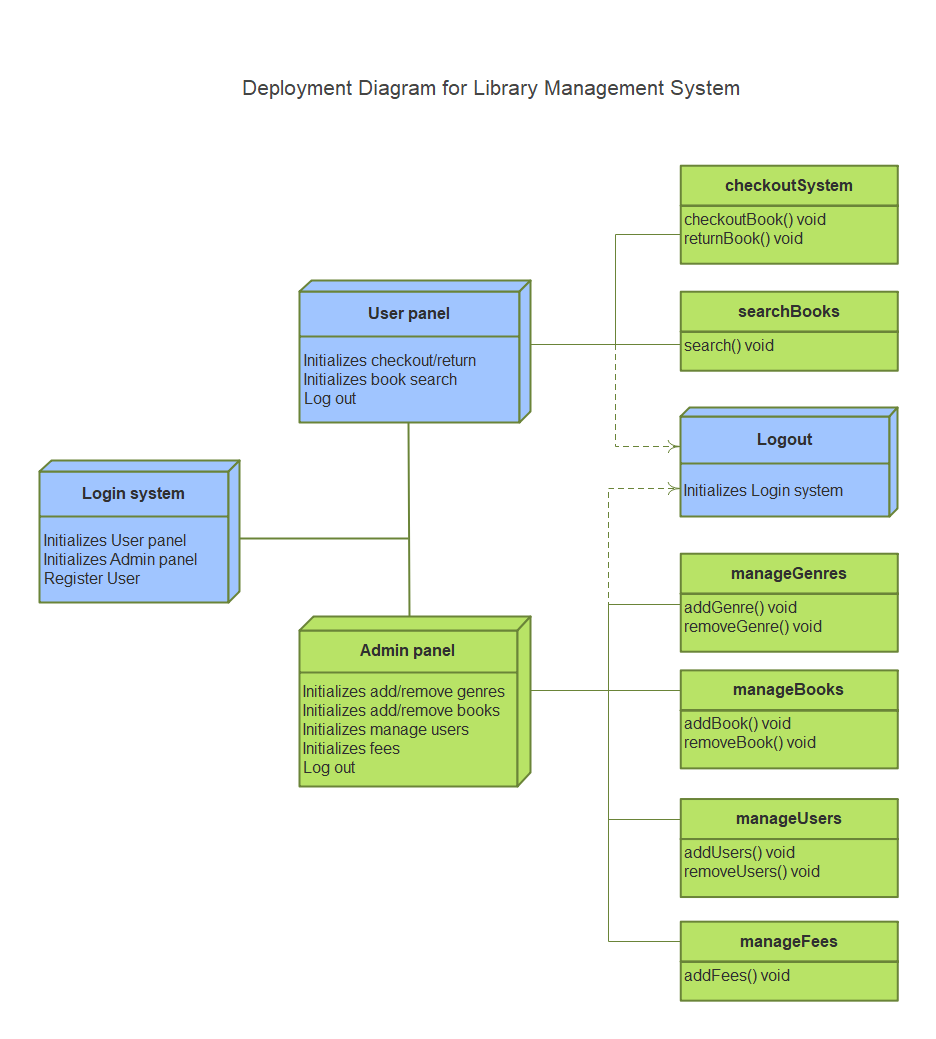
This is a simple diagram that sketches how the library system works. It begins with logging in to the system. The system contains a panel for existing and new users as well as the admin. Both log in to their accounts. While the users are only allowed to check out and search for books, the admin can assign fees, add and manage the library books, add or remove a genre, view and remove users. They both then end at a common point and can log out of the system.
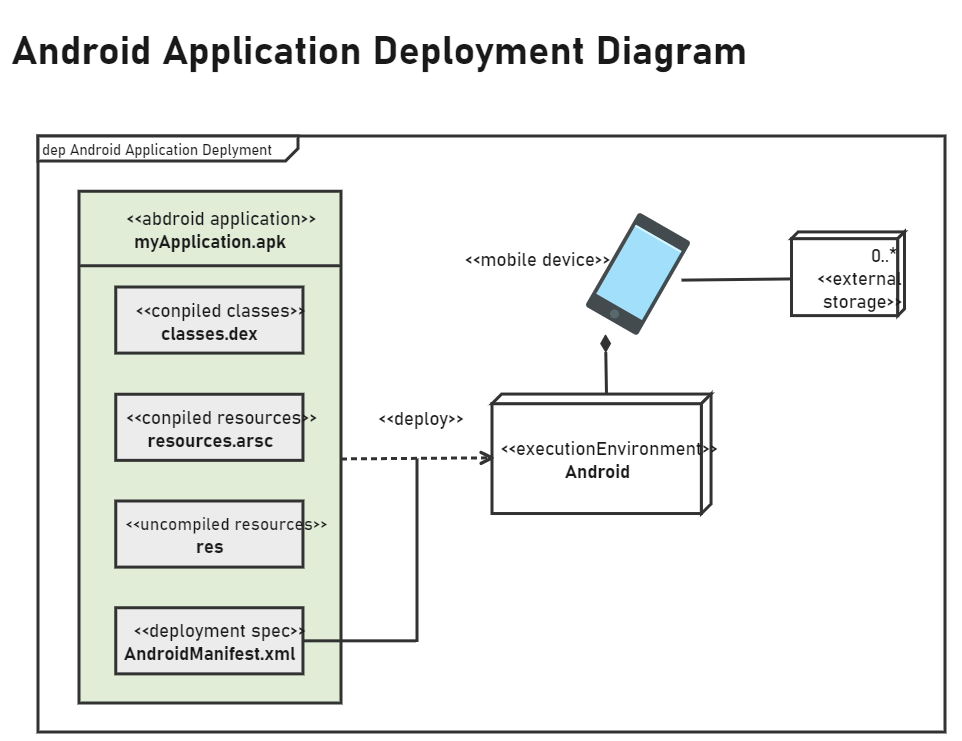
This diagram shows how a deployment diagram is drawn for an Android application. The example uses different types of associations (composition, bi-directional association) to make links between the components and nodes. A dependency relationship exists between the MyApplication.apk and Android component. The mobile phone represents the hardware device, while the Android artifact represents a software node.
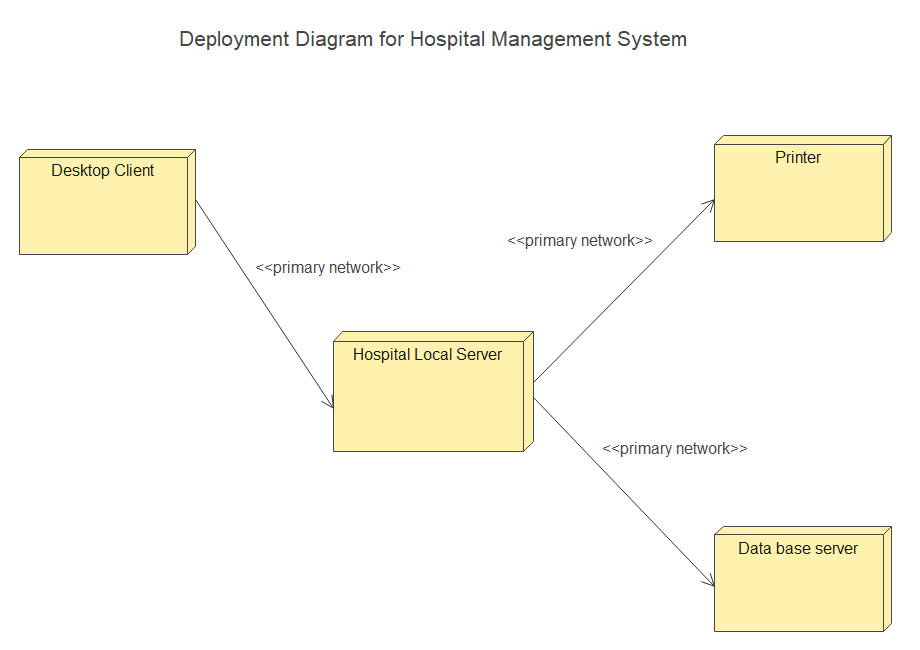
This is a simple diagram with four nodes that shows how a hospital’s management is deployed. It starts with the desktop client node, where the client comes with his query. The request is processed to the hospital’s local server, either printed to a database server or printed out. The << >> represents the profile class that shows how an existing met class acts as a part of a profile.
Source: www.programsformca.com
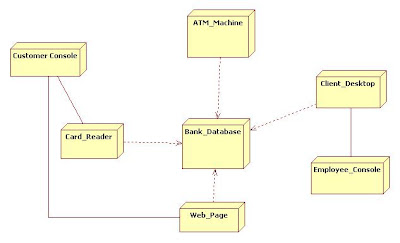
In this deployment diagram for ATM, different associations can be appreciated between the different nodes. The diagram represents how an ATM is directly connected to the bank’s database. When the customer processes his request, the card is read, or he is connected to his bank database through an online system.
The deployment diagram shows how an employee can also check the account details at the client’s request. The diagram shows how each request is dependent on the bank’s database.
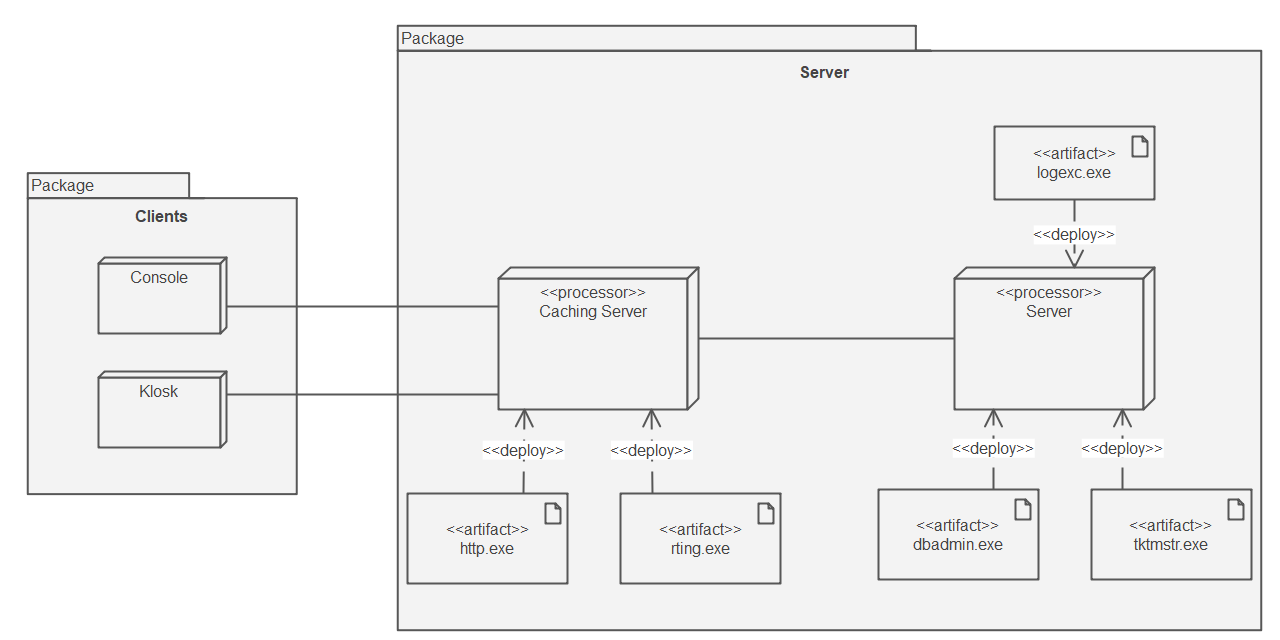
The diagram shows how a client’s requests are processed by a server. The server and caching server are the primary processing nodes bi-directionally associated with the client’s console and kiosk. The rest of the artifacts are dependent on the ‘catching server’ and ‘server’ to process their requests.
Source: creately.com
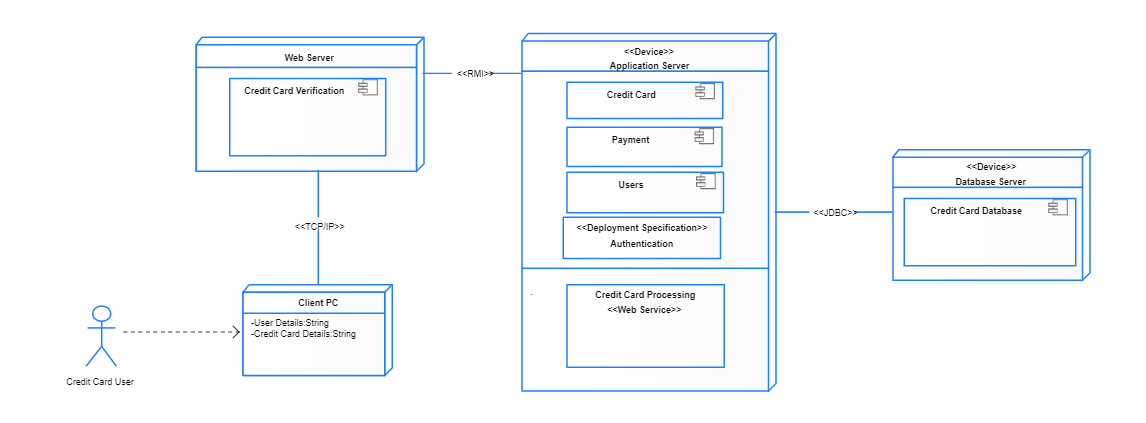
This is a UML representation of how a credit card is deployed. It starts with the user entering his credit card into the machine.
The client PC is dependent on the user since the information varies for each user. Different connections exist between the different nodes of the system, i.e.: TCP/IP, RMI, JDBC. The entire information is processed to the database server where the credit card database is located.
As seen in the examples, deployment diagrams are a handy way of illustrating and understanding the working of a system. It is necessary that the correct diagram be constructed for a scenario, so an accurate depiction of the system is concluded.
Considering creating a deployment diagram? Choose EdrawMax-- it is fast, quick, and user-friendly. With over 280 types of diagrams, a vast array of editing tools, and abundant symbol libraries, making deployment diagrams is just a five-finger thing.
Whether you are a newbie or a tech-savvy person, use EdrawMax to effortlessly create the most interactive deployment diagrams.