Graphics and Charts Examples
> Edraw Example > Graphics and Charts Examples
Easy graphic and charts software with rich examples and libraries. It's easy to draw graphics and charts with the simple drag and drop.
Examples Of Graphics and Charts
Seeking a solution for
maximizing the efficiencies throughout the graphic and charts?
How to make a graphic and chart?
How indeed does one go about it, without seeing examples of
Graphics & Charts? Not likely unless one has good
Graphics and Charts examples.
Free Download
Diagram Software and View All
Examples
The following diagrams are some examples of
Graphic & Charts.
|
|
|
|
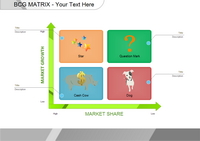
BCG Matrix
|
Process Chart
|
Process Diagram
|
|
|
|
|
Comparison List
|
Basic Column
|
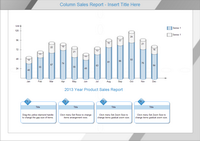
Column Sales
Report
|
|
|
|
|
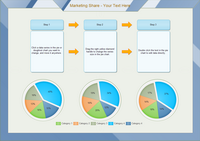
Marketing Share
|
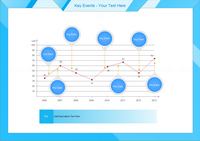
Key Event
|
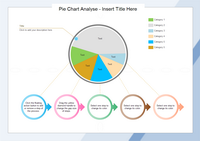
Pie Chart
Analyze
|
|
|
|
|
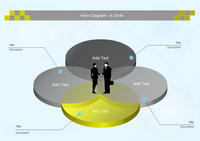
Venn chart with 4 circles
|
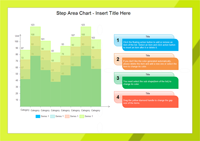
Step Area
|
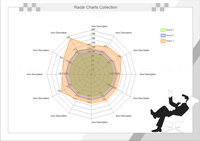
Radar Chart
|
More libraries
Graphic Organizer Software
Venn Chart
PEST Chart Examples
Pyramid Chart Examples
Value Chain Examples
Six Sigma Matrix

Get Started! You Will Love This Easy-To-Use Diagram Software
EdrawMax is an advanced all-in-one diagramming tool for creating professional flowcharts, org charts, mind maps, network diagrams, UML diagrams, floor plans, electrical diagrams, science illustrations, and more. Just try it, you will love it!