Gantt Chart vs. PERT Chart
Both Gantt chart and PERT chart are used as project management tools to help in displaying the tasks for project completion. The things we see in both PERT charts and Gantt charts are tasks, their duration, milestones, etc. makes us think that the Gantt chart and the PERT chart are the same things and they don't have any contrast, but actually, they do contain the differences and yet are the two things.
In this article, we will see what the PERT chart is, what it stands for, its origin, why we use it, and at the same time, we will also see what the Gantt chart and everything related to it is. We will also track the differences between both two charts and what to choose according to our goals.
Contents
What is a PERT Chart?
The term PERT is short for the program (or project)evaluation and review technique. The essential statistical tool in project management that shows how the project or task is going. The PERT chart is an important tool that helps the project managers to see the path on which the project is executing and the time it is consuming to complete.
Pert chart looks like a flowchart. It uses boxes and arrows to show the subtasks and their dependencies.
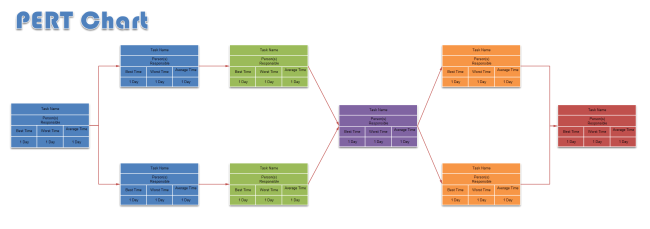
The PERT chart contains the time feature that depicts the time in which the work has to be done. It also includes the milestones and deadlines to show a significant completion of some part of the project. The chart includes the event-oriented technique that shows which event is motivating the task to start and to stop.
The activities and work are represented as arrows, and the events are represented as the nodes in the chart. The chart’s origin falls back to 1950s when the need to simplify the planning of the large and complex project arose for the US Navy. And again, the PERT chart was used in 1968 for the Winter Olympics projects. After these events, the chart became the need for project managers to track the project’s progress.
The PERT charts are mainly used for complex project management where it is necessary to track the progress of the project and take all vital measures to save it from falling onto the wrong track.
What is a Gantt Chart?
The Gantt chart is an important topic of the project management world. It is a project management tool that lets the project managers and other team members track the progress of the project. The Gantt chart is also a statistical tool as it shows the data in the bar forms.
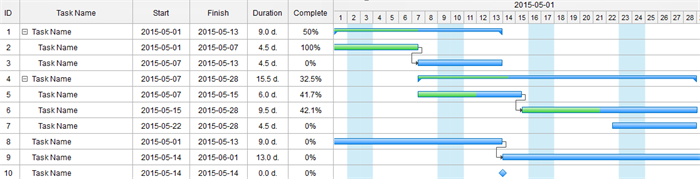
The Gantt chart shows us the progress of the tasks in the form of a horizontal rectangular bar against the time duration bar that is presented above the chart. The milestones are also present in the chart that shows significant success relevant to the task or group of tasks.
In the Gantt chart, you divide the whole project into multiple tasks and list those tasks on the first column of the chart. The dependencies and the resources are listed after the tasks.
The dependencies tell us what task is related to another task and how a task is initializing the other task. The resources are the employee, teams, or tools deployed to complete a particular task.
Henry Gantt, between 1910–1915 invented the Gantt chart, the project’s progress was essential, and hence it is called the Gantt chart. He introduces the chart to measure the abilities and productivity of the employees, and then to further groom it, he adds the graphics on the chart. The chart is used explicitly for the project management to track the resources and project.
PERT Chart vs. Gantt Chart: How to Choose?
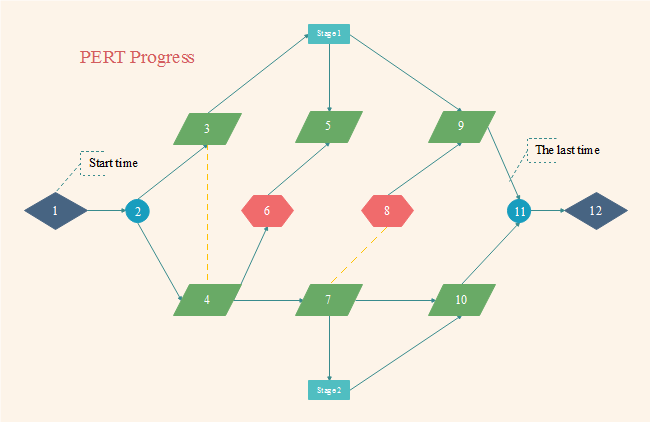
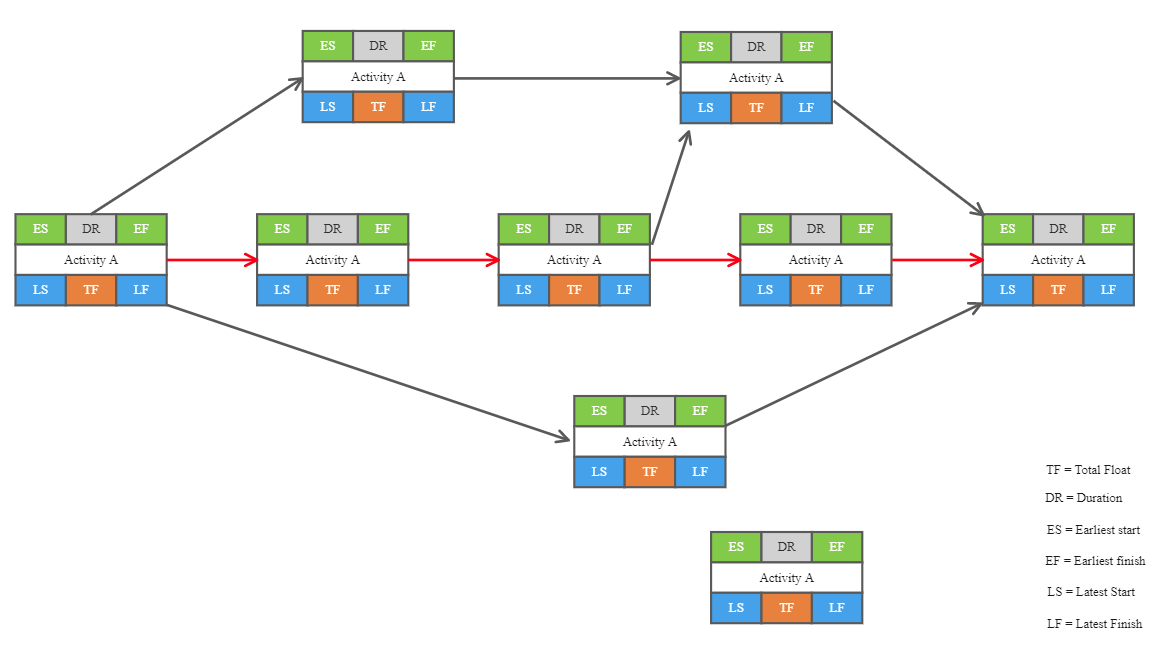
The PERT chart contains the two major components: Nodes and the Arrows. The nodes are the square boxes that show the tasks, the time needed to complete them like the start and finish time, serial number, and the resources deployed to complete the task. The arrows show the dependencies between the tasks simply showing that one task is initializing another.
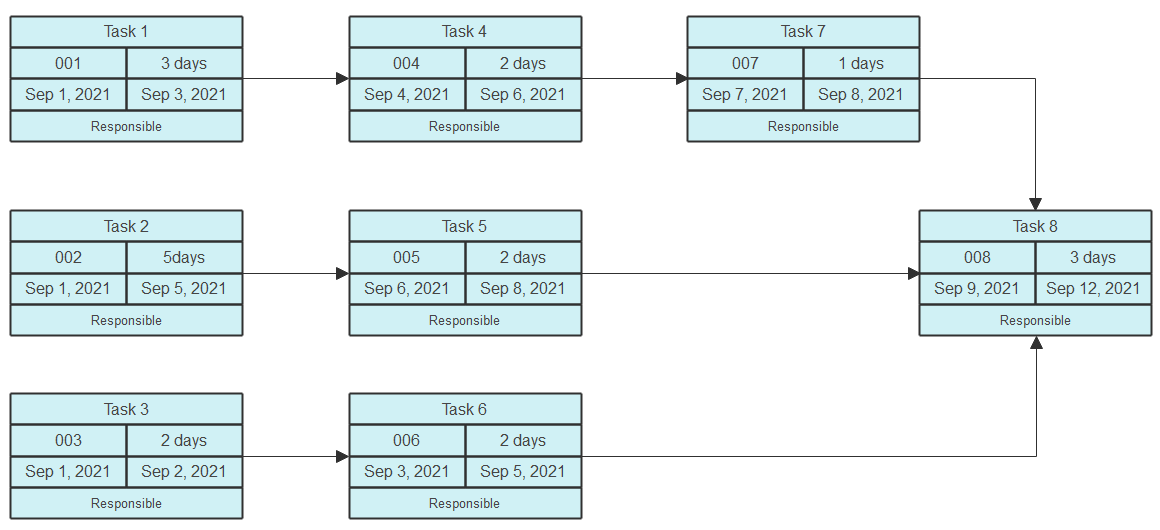
A Pert Chart:
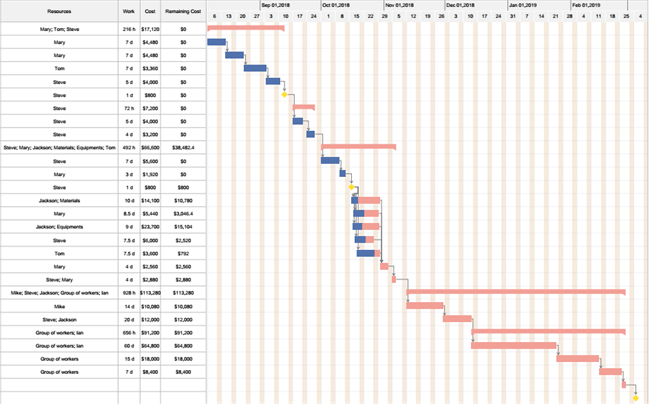
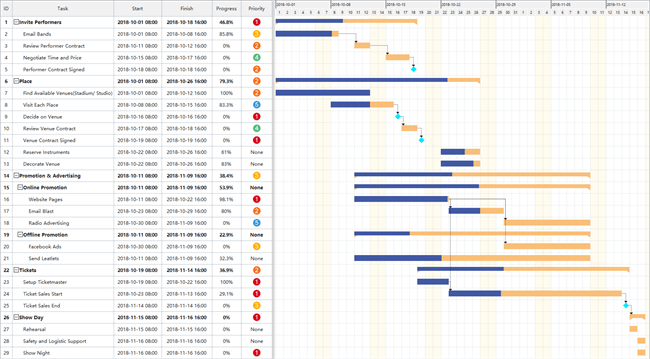
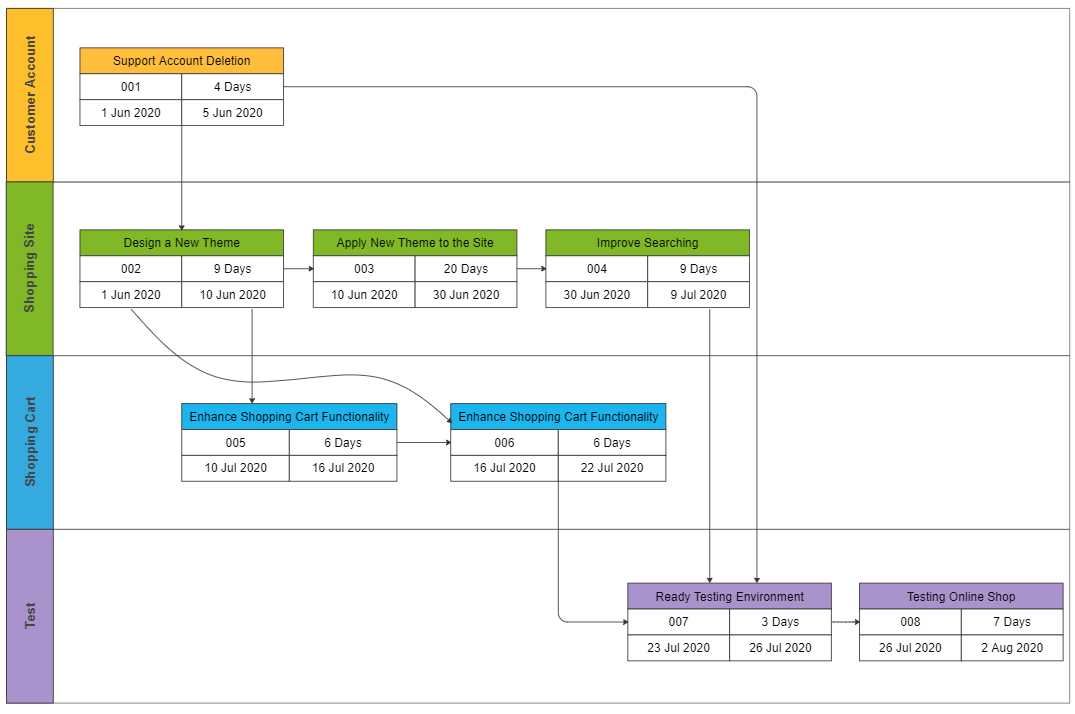
The Gantt chart has the tasks listed down on the first column, and then the dependencies and the resources take the lead in the next column. In the central part, the horizontal bars are presented to show how much work has been done related to the task. On the above chart, the time duration is present against which the progress is compared. The milestones are also set with the bars.
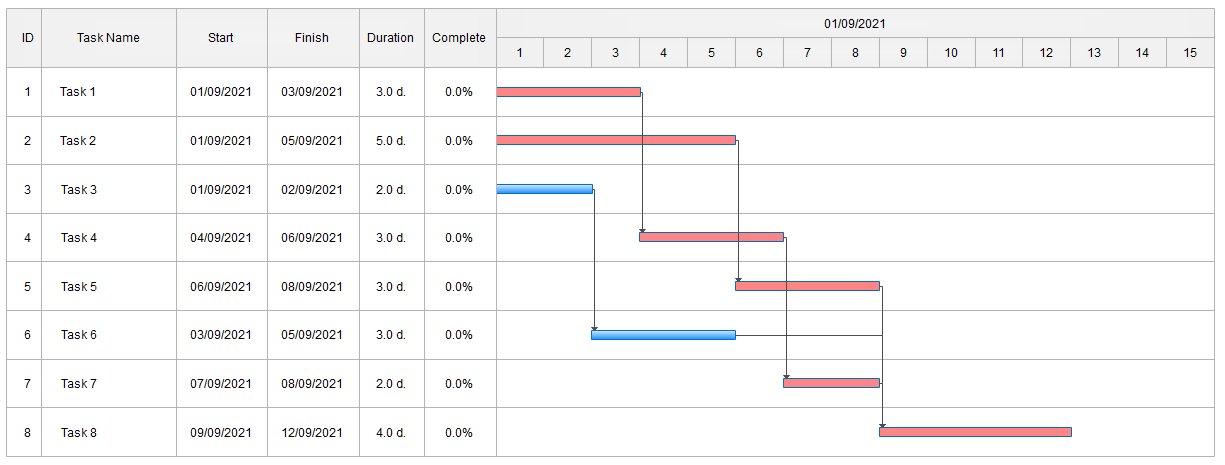
The Gantt Chart version of the PERT Chart above:
When to Use a PERT Chart Over a Gantt Chart (and Vice Versa)
Both PERT charts and Gantt charts are useful tools for project managers to visualize the whole projects. However, they differ from each other in many aspects. One of the differences is that the Gantt chart is more straightforward than the Pert chart. How to choose appropriate charts for different projects?
PERT Chart
- If you want to forecast the time needed to complete the project, you should go for the PERT chart.
- If you want to set essential paths to complete the project before the deadlines.
- If your tasks are an interdependent plus, more complex, then choose the PERT chart.
In the planning phase of a project, it is suggested to use a PERT chart since it presents the relations between each task, along with their dependencies and their estimated completion date.
Gantt Chart
- Go for the Gantt chart when you want to forecast the amount of time to complete a project’s tasks.
- If you want to see the progress of the task and also want to track the resources, then select the Gantt chart.
If the project is underway, a Gantt chart is believed to be a better choice since it can track the whole project. Besides, all of the team members are clear on their responsibilities and due dates, which can help everybody optimize time management.
Key Differences Between Gantt Chart and Pert Chart
So, from the above research, we can find:
- The PERT chart is the network diagram that shows the state and dependencies of tasks, and the Gantt chart is the bar chart that shows the same in the chart.
- The components in the PERT chart are critical path, responsibilities, project duration, while the Gantt chart does not show the critical path.
- The PERT chart is used to track the whole project, while the Gantt chart is used to track the progress of the subdivided tasks from the main project.
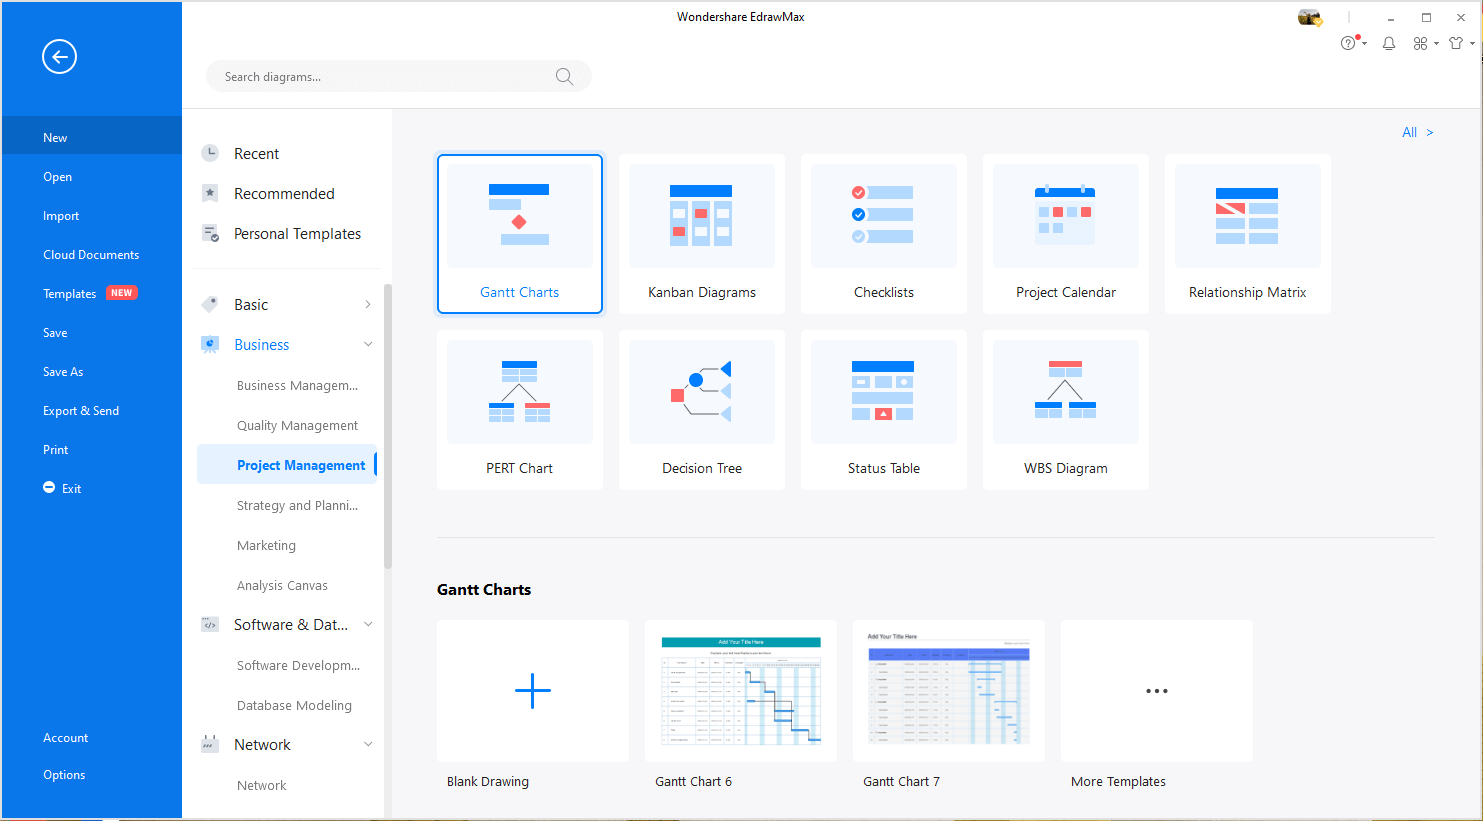
Project Chart Software for both Gantt Chart and PERT Chart
Edraw project chart maker provides templates for both Gantt Chart and PERT Chart. It has even more project management charts such as WBS diagram, timeline, etc. Download it now and create project charts with its vast collection of templates and symbols.

An all-in-one platform for 210+ diagrams.
・ Simple alternative to Visio
・ 26k+ symbols
・ 10K+ free templates
・ 10+ AI diagram generators


Discover More Free Gantt Chart & PERT Chart Templates
Can't wait to create Gantt charts and PERT charts for your projects now? All you have to do is select a template below or go to Edraw templates gallery to find what you want.

Related Articles
Creating Gantt Chart From Data
What Is a Dependency in the Gantt Chart?


