Mental Health Infographic
Edraw Content Team
Mental health has become a bold problem of our society that most people are ignoring. Mental health directly affects everyday life, making things worse if the issue is not addressed quickly.
This article will give you a brief introduction to mental health and its importance in life. We will also tell you what mental health infographics and their examples are, and in the end, we will notify you on how to make a perfect infographic on mental health to raise awareness about it.
Why Mental Health is Important?
According to the most reliable site Mental Health.gov, mental health comprises our emotional, psychological, and social well-being. Our mental health defines how we think, perform, and feel. Most importantly, it affects our decision-making, handling stress, and associating with others.

Our mental health is as vital as our primary organs are, like the heart, lungs, brain, etc. It affects the everyday workings of our life, and so, we have to take all measures to keep it healthy. Mental health is critical in every part of our life, from childhood to old age.
If our mental health is badly affected, we have to pay heavy consequences throughout our lives. Impaired mental health can be due to: 1) biological factors like genes or brain chemistry; 2) our life experiences mainly the bad ones like trauma or abuse; 3)also, our family history of mental health problems.
Some signs of bad mental health
Some of the signs of suffering from impaired mental health are listed below.
- Our sleeping and eating are affected.
- We become more Indoor people and don't like to associate.
- Experience low or zero energy.
- It seems that nothing is essential.
- Unexplained miseries.
- Feel helpless or hopeless.
- Smoking, drinking, or using drugs more than usual.
- Feel unusually chaotic, absent-minded, on edge, angry, upset, worried, or scared.
And there are a lot more than you will get from the above-pinned site. By reading the signs of bad mental health, you will second how it affects your life and work. Usually, bad and unaddressed mental health is a cause of suicides. So, we should use all our ability to tackle this problem and save people from their broken mental health.
Why Use Infographics?
An infographic is nothing but the representation of some data, knowledge, and information in the form of graphics, colors, and graphs. The visual input can easily be processed in a person's mind, quickly understanding the point.
It is the strategy we can use to raise awareness about mental health. Mental health infographic is the pictorial or graphical representation of the mental health data that almost every organization uses today.
Importance of Mental Health Infographics
There are hundreds of benefits of using the infographics of climate change. Some of them are listed below.
- Infographics related to mental health can help us counter the problems produced by mental health. As said earlier, humans can easily understand the graphics, so educating in colors, graphs, and pictures will be the key to raising awareness about mental health.
- We can share our thoughts, research, and prevention tips in the form of infographics rather than telling people the large paragraphs about mental health. Infographics make it easy and boost our production.
Mental Health Infographics
In this section, you will get some practical visual inputs about the mental health infographics. You can take ideas from below and use them to create your infographic.
Example 1: Mental Health vs Mental Illness
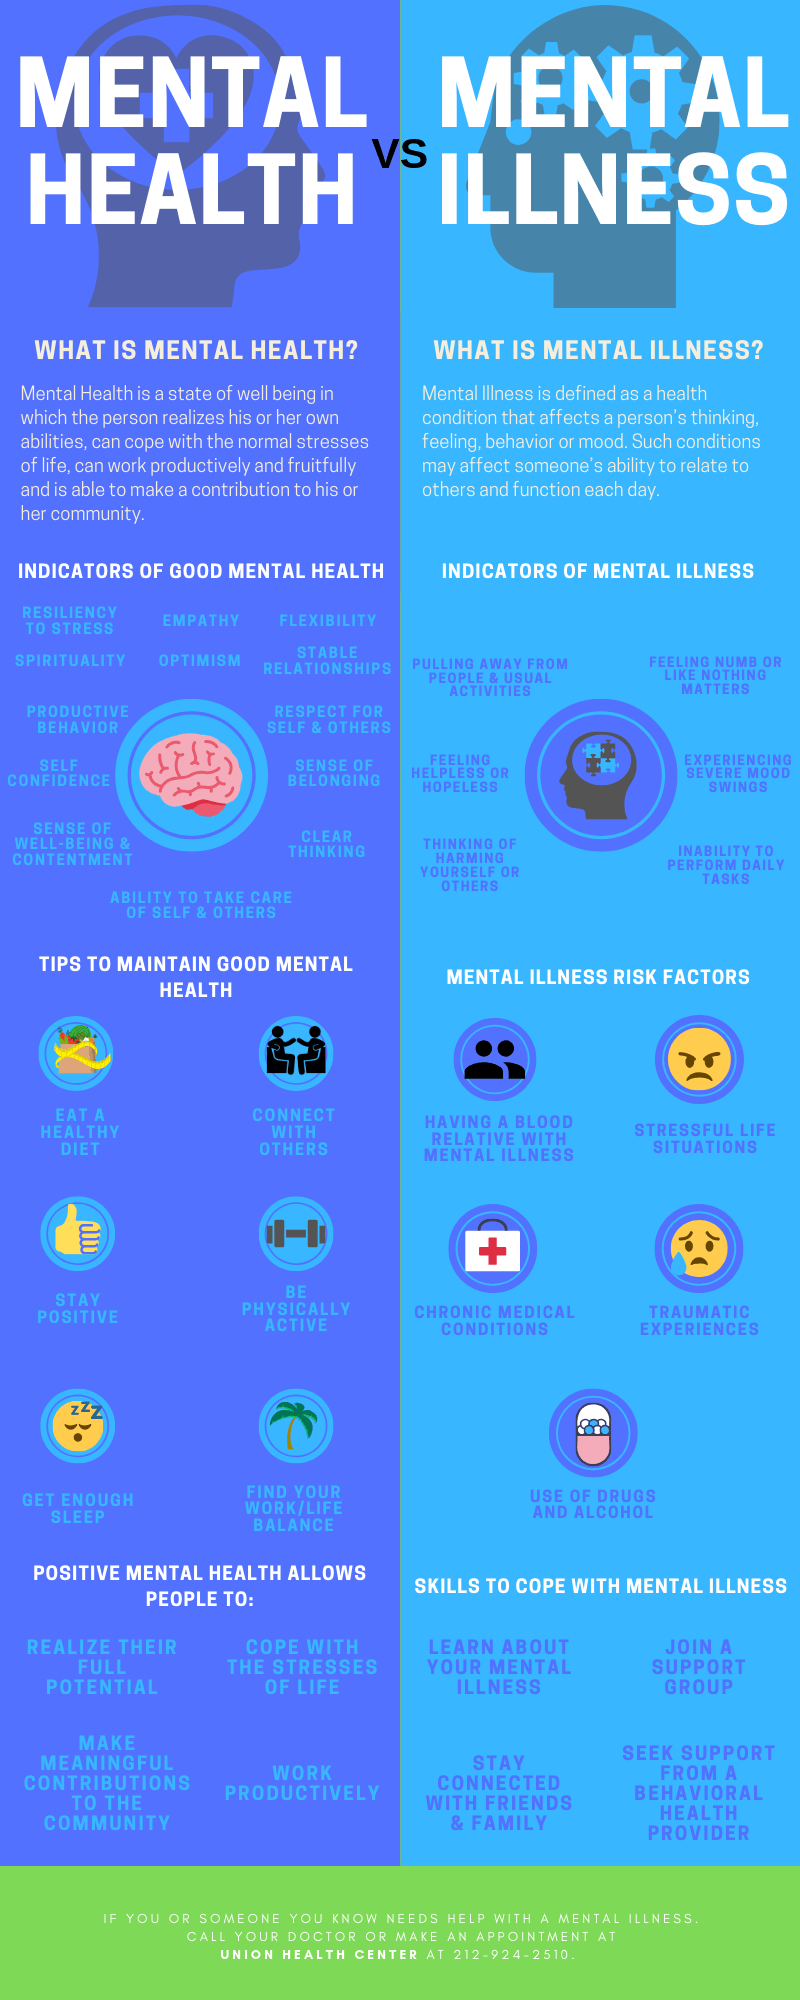
Image Source: unionhealthcenter.org
The infographic tells us the contrast between mental health and mental illness. Mental health is the state of well-being in which a person realizes their abilities; meanwhile, mental illness is a bad health condition that affects their thinking, feeling, behavior and mood. Resilience to stress, empathy, flexibility, spirituality, optimism, etc., are the signs of good mental health. Pulling away from our loved ones, our everyday work, feeling numb, hopeless and helpless, etc., is a sign of mental illness. There are also some prevention tips mentioned in this infographic.
Example 2: Mental Health Awareness Infographic

Image Source: www.psychalive.org
The infographic notified us about the mental health problems in the United States and how to tackle them. In the US, one in five adults has mental health issues. Over 40 million Americans are suffering from this problem. Suicide due to mental illness has become the 10th leading cause of death in the US. Some important numbers are mentioned in the infographic to create contact with the organizations that help people get rid of their mental illness.
Example 3: Mental Health in the Workplace
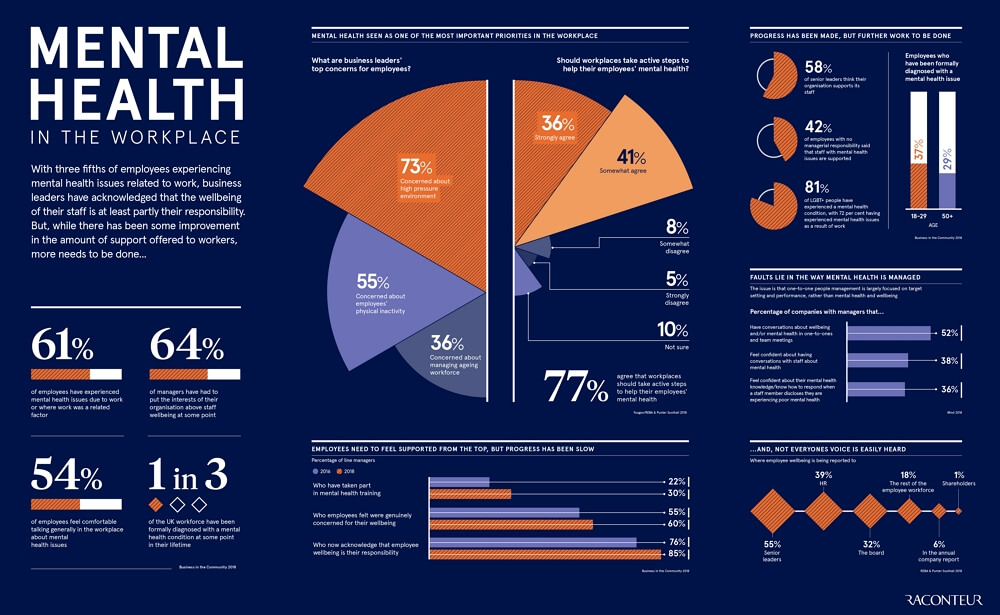
Image Source: www.raconteur.net
Mental health in professional workspaces is also a significant issue that is the leading cause of lowering the production of the business. About 73% of the employees are concerned about a high-pressure environment in a workspace. Over 61% of the employees are facing mental issues. 64% of the managers are putting the company's interest over the well-being of the employees. The graph also shows terrible figures about how rapidly mental illness spreads in offices in developed countries like the UK.
Example 4: Anxiety Disorders

Image Source: blog.uvahealth.com
The above-pinned infographics tell us about the myths and facts of anxiety. Anxiety is the usual problem that everyone faces. The fact is that anxiety disorder is a serious mental illness. Everyone faces anxiety in some part of their life, but daily anxiety is a severe issue. Therapists help people to tackle their anxiety disorders. Anxiety disorders affect one in eight children. A panic attack can feel like a heart attack.
Example 5: Young People and Mental Health
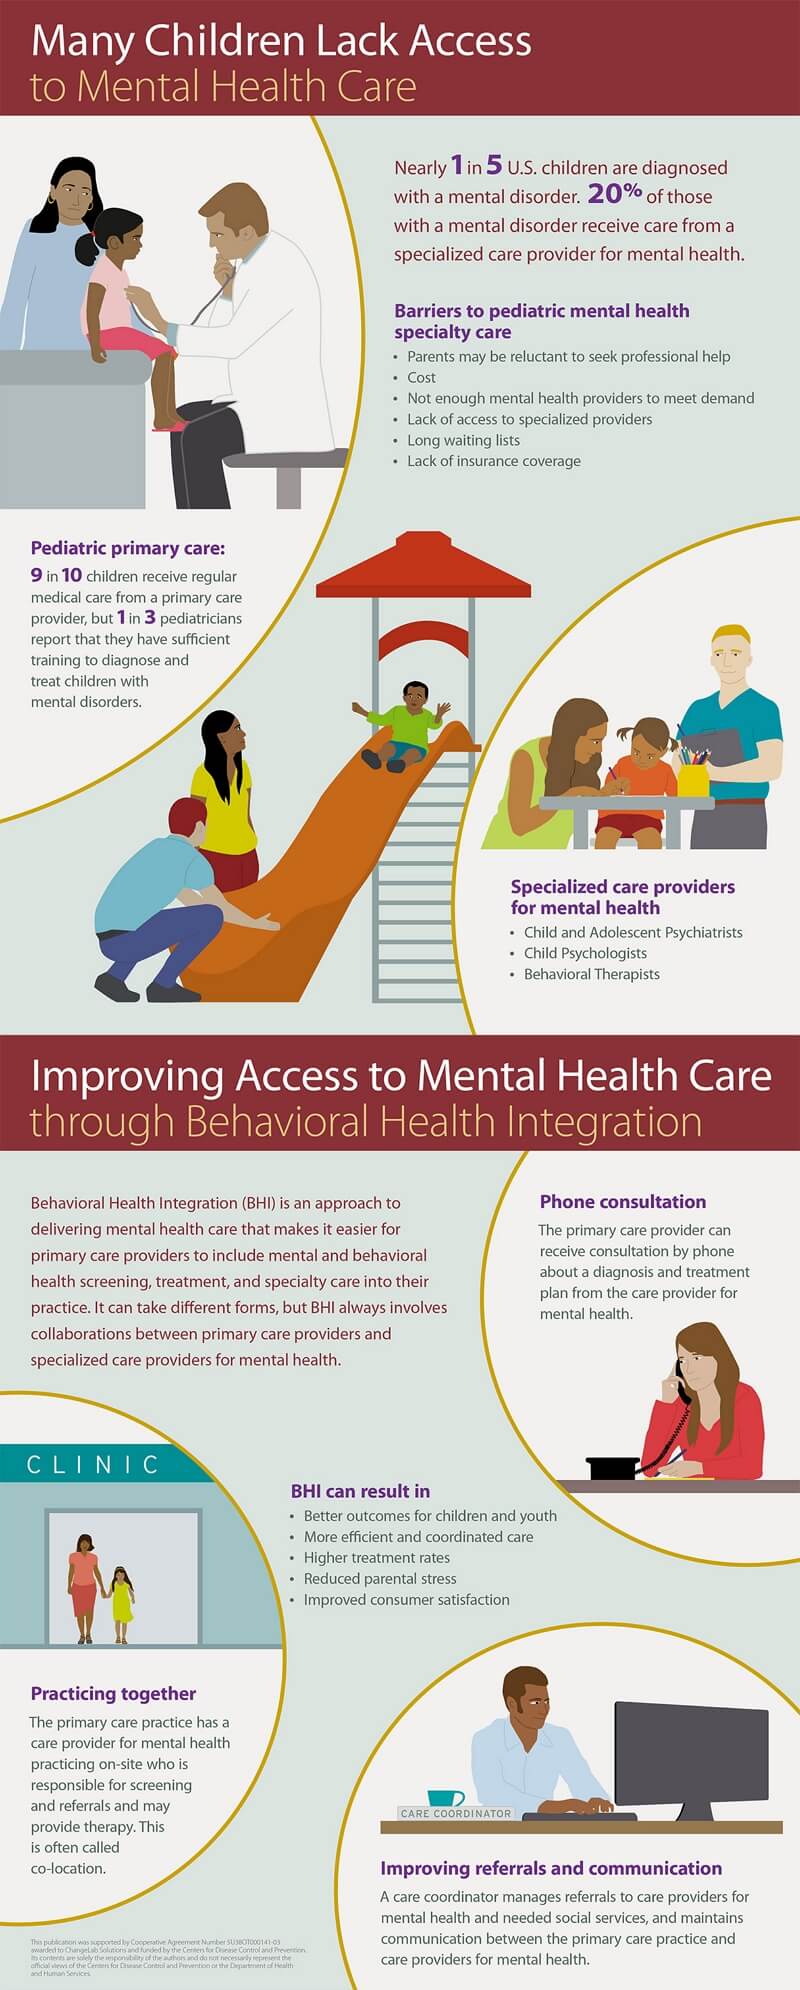
Image Source: www.cdc.gov
The infographic addresses mental illness in children. Nearly 1 in 5 children is diagnosed with a mental disorder. Only 20% of children receive treatment. Some barriers that stop children from getting mental illness treatment include costs, parents, not enough therapists, long waiting lists, etc. Some preventions are mentioned in the infographic that children can receive through phone consultation or Behavioral Health Integration. These preventions can produce the best outcomes if the treatment is given early.
Example 6: Mother's Mental Health
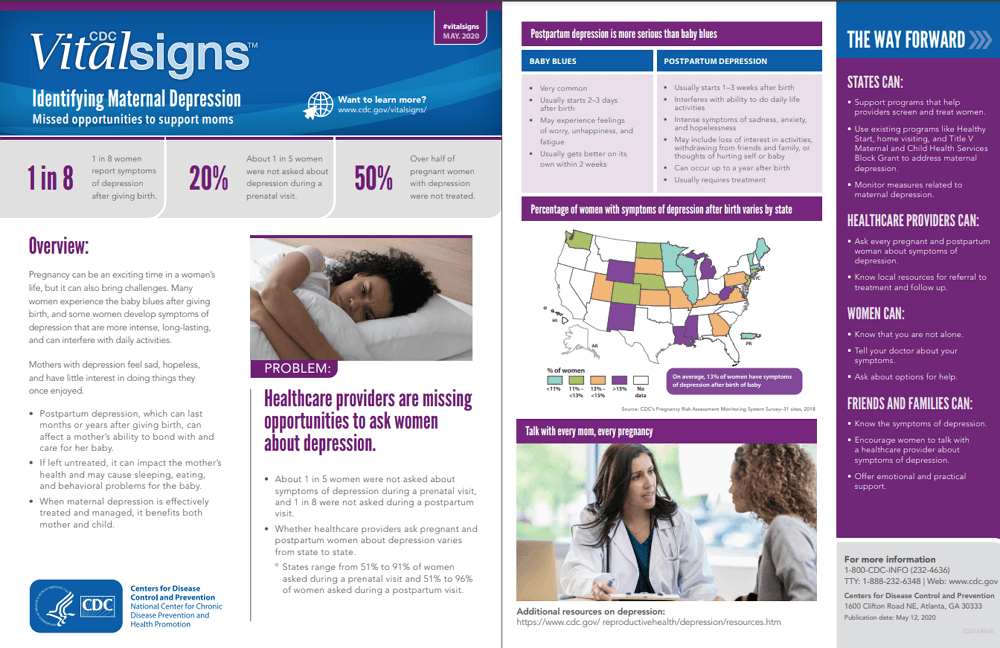
Image Source: www.cdc.gov
The above-pinned infographics tell us about the mental illness faced by many mothers. One in eight ladies faces symptoms of depression after giving birth.About 20% of the women never ask about mental health when seeing the doctor. Pregnancy also brings depression, anxiety, and happiness that needs to be cured. Postpartum depression can affect a mother's ability to care for her baby.It can change the mother's health and cause the baby's sleeping, eating, and behavioral problems.
Example 7: Father's Mental Health
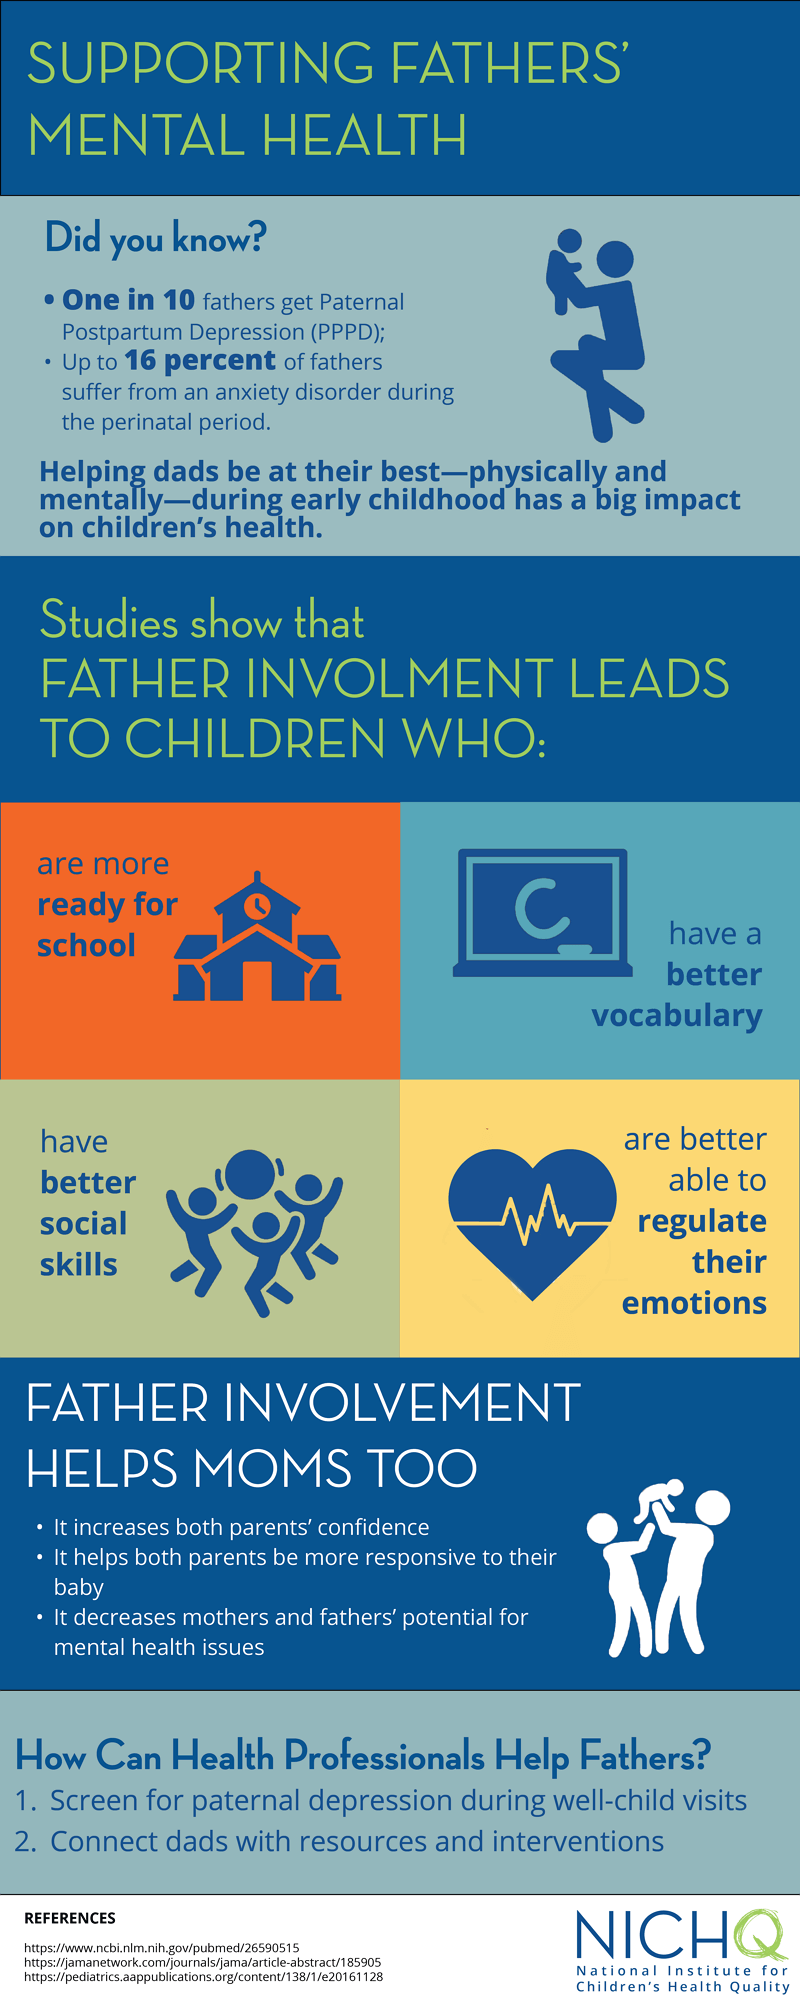
Image Source: www.nichq.org
A man, a father, can also suffer from mental issues. One in ten fathers gets Paternal Postpartum Depression. Up to 16% of fathers suffer from depression and anxiety. Mental illness makes the father absent from the bond between the family. Fathers should get screened for paternal depression during well-child visits.
How to Create a Mental Health Infographic?
This section will tell you how to make an infographic relating to any topic. All the steps below should be followed carefully.
Step 1: Target the audience
Before you start making an infographic, you should get familiarized with the target audience to whom you will deliver this infographic. See if your target audience is inside your organization or they reside outside of your organization's premises.
If they belong in your workspace, then set your tone that they understand well, but if they live outside, you must take all steps to know them. Trying to know your audience before starting the conversation leads to successful communication.
Step 2: Select the topic and title
Now, you should select the best topic for your infographic. But before choosing the title, you should understand the type of your infographic, from where it belongs. There are hundreds of kinds of infographics.
It would be best to understand the type to make a topic title. Your topic or title should be the meta description of your whole infographic. Make your infographic that people understand quickly. Never use difficult words for your topic and title.
After selecting the title and topic: 1) Get the template and theme for your infographics; 2) Make your infographic look colorful and appealing; 3) Add more graphics to it. You can get the templates from the internet from various sites.
Your content and theme or template should be relevant. You can use the well-known infographic maker called EdrawMax to make your infographics look complete and perfect. The application is packaged with hundreds of infographic-making tools.
Step 3: Gather all your data
The most important part of making an infographic is to insert your data. Your data or information is the crucial tool to make your infographic successful.
Always get your data from the most reliable sites on the internet. You can also take help from the book or consult those organizations that tackle issues relating to your infographics.
For example, to raise awareness about climate change, you will always consult the weather stations and forecasters, or if you want to give the process of making something, you would see the books related to them, etc.
The data should be collected by different people and not only by anyone. Everyone should be responsible for where they are getting data from.
Step 4: The structure of the infographics
Always be concerned about the structure of your infographics. If your data is related to other information, insert the data and graphs in the hierarchical order. Always add the data in the correct format. Use fonts that people understand easily.
Add more graphics as you can. Use more statistical graphs and make them more colorful. Insert more numbers or figures in your infographics because they easily make people understand the content.
Don't include large paragraphs. Make your points short and easily understandable.
Step 5: Recheck and share
Before publishing the infographic, go through it once more to remove mistakes and issues. Get it reviewed by your seniors, and then print it. Also, if you will also post them on social media, then understand the size configurations of different social media sites.
More Free Infographic Templates

EdrawMax
All-in-One Diagram Software
- Superior file compatibility: Import and export drawings to various file formats, such as Visio
- Cross-platform supported (Windows, Mac, Linux, Web)


Edraw Content Team

