Rich Standard Shapes Let You Draw Easily
In many cases, a single shape speaks better than a thousand words. To document and explain complicated data, system or process, clear flowcharts or diagrams is one of the best ways to present them. Requiring little skills and efforts to create high-quality professional graphics, Edraw will become your efficient assistant. Rich Standard Shapes Let You Draw Easily!
Unlike other graphics design software that provides users with a blank screen and drawing tools and expect them to draw, Edraw users can draw from lots of standard shapes that are specifically designed to create the type of diagram they need. Users organize the information and Edraw does the rest.
Smart Shapes
Edraw includes plenty of shapes and examples for diagramming. You can download the full version and view all shapes.

An all-in-one platform for 210+ diagrams.
・ Simple alternative to Visio
・ 26k+ symbols
・ 10K+ free templates
・ 10+ AI diagram generators


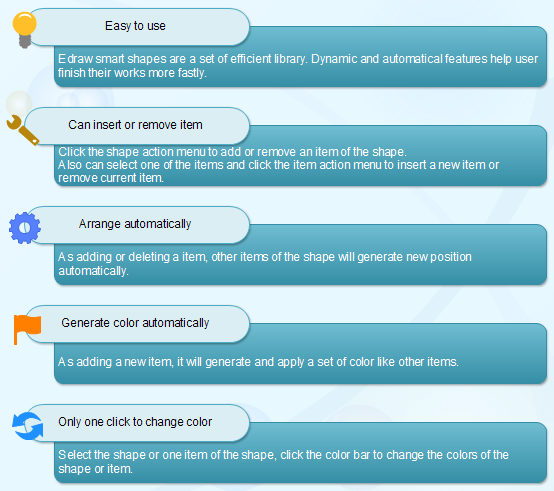
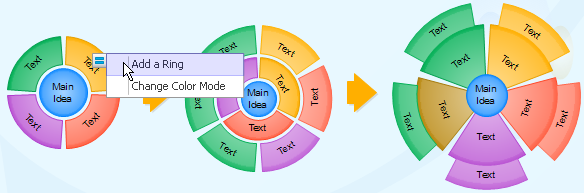
In version 6.0, we have added a series of smart shapes which encompasses the shape action button for changing the shape's appearance and style. These smart shapes are widely applied in list shapes, process shapes, mind map shapes, circular shapes and project management shapes. They are smarter than the office smart art shapes. The following is a simple example of changing shapes.
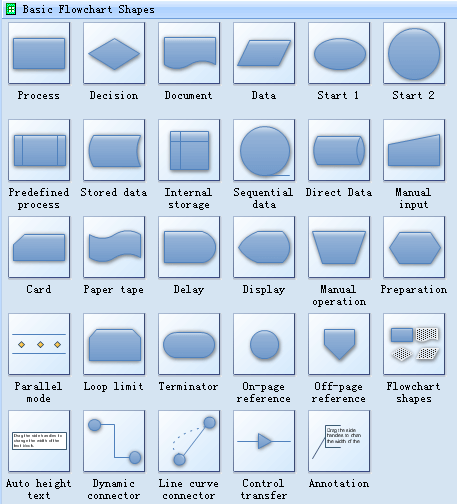
Standard Flowchart Shapes
Flowcharts use special shapes to represent different types of actions or steps in a process. Lines and arrows show the sequence of the steps, and the relationships among them.
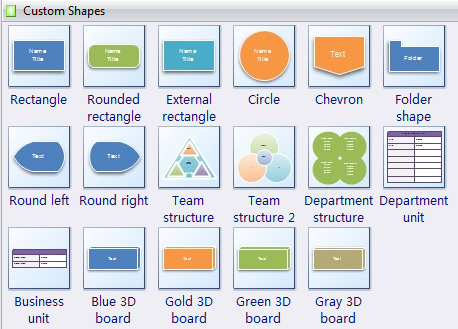
Organization Chart Shapes
Use it to create Organizational charts; visualize company Organizational chart, hospital Organizational chart, hotel Organizational chart, corporate organizational chart etc. No other Organizational chart software gives you all these benefits at such reasonable price!
Arrow Shapes
Lines and arrows show the sequence of the steps and the relationships among them. You can use them in any document.
![]()
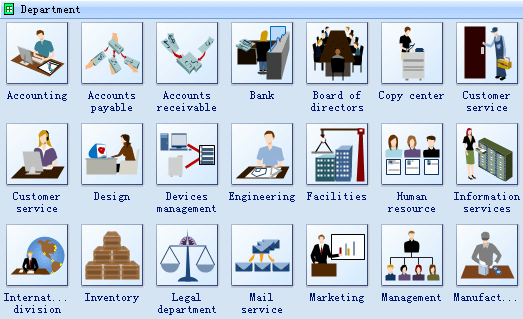
Work Flow Diagram Shapes
Work flow relationships are where work is done by different departments in a fixed sequence. That means one department needs to finish its job before the work can be continued by another department. The development and maintenance of these work flow relationships is very important for managers because they are dependant on the preceding areas for his or her own work and is responsible to the managers and workers in the further stages of the chain.
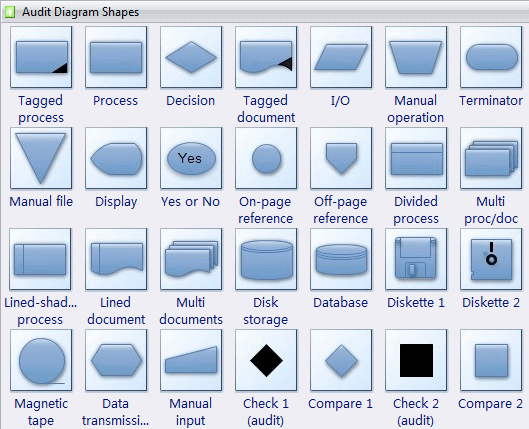
Audit Flow Diagram Shapes
Flowcharts use special shapes to represent different types of actions or steps in a process. Lines and arrows show the sequence of the steps, and the relationships among them.
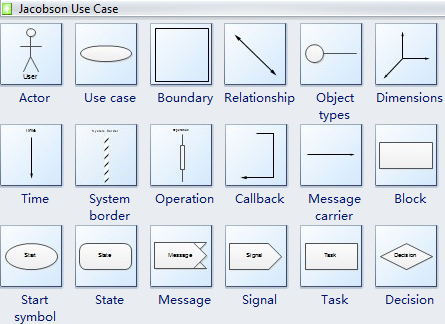
Software Design
UML defines nine types of diagrams: class (package), object, use case, sequence, collaboration, state chart, activity, component, and deployment.
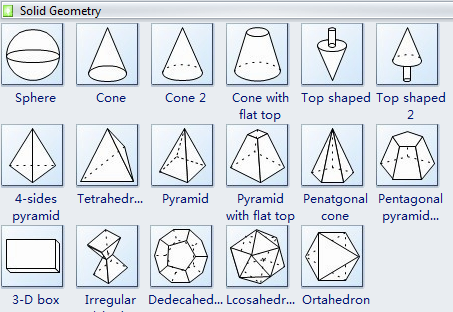
3D Block Shapes
Some 3D Block shapes can be used in any document, containing 2-D geometric shapes and directional lines for feedback loops and for functional decomposition, hierarchical, data structure, data flow block, and data block diagrams.
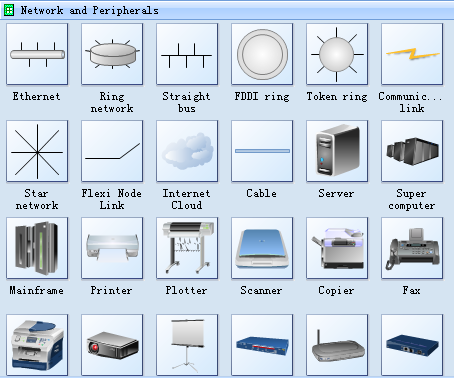
Network Diagram Application
Draw detailed Computer Network Diagrams, Designs, Schematics, and Network Maps in no time! Pre-drawn shapes representing computers, network devices plus smart connectors help create accurate diagrams and documentation. Besides, there are special libraries of great detail, accurate shapes and computer graphics, servers, hubs, switches, printers, mainframes, face plates, routers etc. for Computer Network, Telecommunications, Wireless Internet, Power, Storage and other equipment.
More Drawing Shapes
3D Layout Network Diagram Shapes
Process and Instrumentation Drawing Symbols
Industrial Control Systems Symbols


