Component Diagrams
Part 1: What is Component Diagram
A component diagram is used to model a static implementation view of a system, i.e., the components that help make the system's functionalities. It can show the implementation details and helps to guarantee that planned development covers every project angle.
Component diagrams have evolved a great deal through the years. The first version of UML included physical components like documents, database tables, files, and executables. In short, they had all physical elements with a location.
Later in UML 2, more conceptual elements made their way to component diagrams like a business process, an interface for user interaction, and other parts of the system with a genuine relationship.
Part 2: Purpose and benefit
Component diagrams give a visual view of the organization of different system components and their dependency or relationships with each other. They help model implementation detail and take a review to check if the planned development covers all the requirements.
Component diagrams are very popular in the component-based development paradigm of software development. In this paradigm, component diagrams identify the different components to carry out the required tasks.
In the object-oriented paradigm, the component diagram is used to group classes together based on a shared purpose to give a visualization software development project at a high-level abstraction.
The most popular uses of component diagrams are:
- Visualize component-Based-Development.
- Describe Service-Oriented-Architecture
- Show the structure of the code.
- Show the relationship between components within the system while hiding specification detail.
Since these diagrams are simple and easy to understand, they are widely used in the industry. Other benefits of component diagrams are:
- They are standardized and straightforward to understand.
- They precisely represent the implementation of the system.
- They are instrumental while designing devices with an input-output socket.
- They support reusable components that eventually helps in reducing overall development cost.
- Support easy and centralized modification and updates.
Part 3: Component Diagram Symbols
Component diagrams are simple and very easy to draw. They have a few basic symbols, i.e., component, interface, dependency, and port.
Component
A component is the building block or a logical unit block of the system. It encapsulates the contents of an entity. This entity is a type of class but with a higher abstraction than the classes.
The symbol of a component looks like a small rectangle. It is represented as a rectangle or as a smaller rectangle with a symbol in the upper right corner to help distinguish it from a class. It can take many forms like;
- A rectangle with the name of the component.
- A rectangle with the component icon
- A rectangle with the stereotype text or icon
Interface
An interface shows how components are connected and interact with each other. It describes a group of operations used or created by components. The used operations are called required interfaces, while the created ones are called provided interfaces.
The symbol of a component looks like a small rectangle. It is represented as a rectangle or as a smaller rectangle with a symbol in the upper right corner to help distinguish it from a class. It can take many forms like;
Dependencies
Dashed lines represent dependencies with an arrow on one hand. These lines link one component with another, and the arrow shows the direction of dependence.
Port
Ports are shown by a square along the edge of the system or a component. A port exposes required and provided interfaces of an element. It represents when the component delegates the interfaces to an internal class.
Ports are represented by a square along the edge of the system or a component.
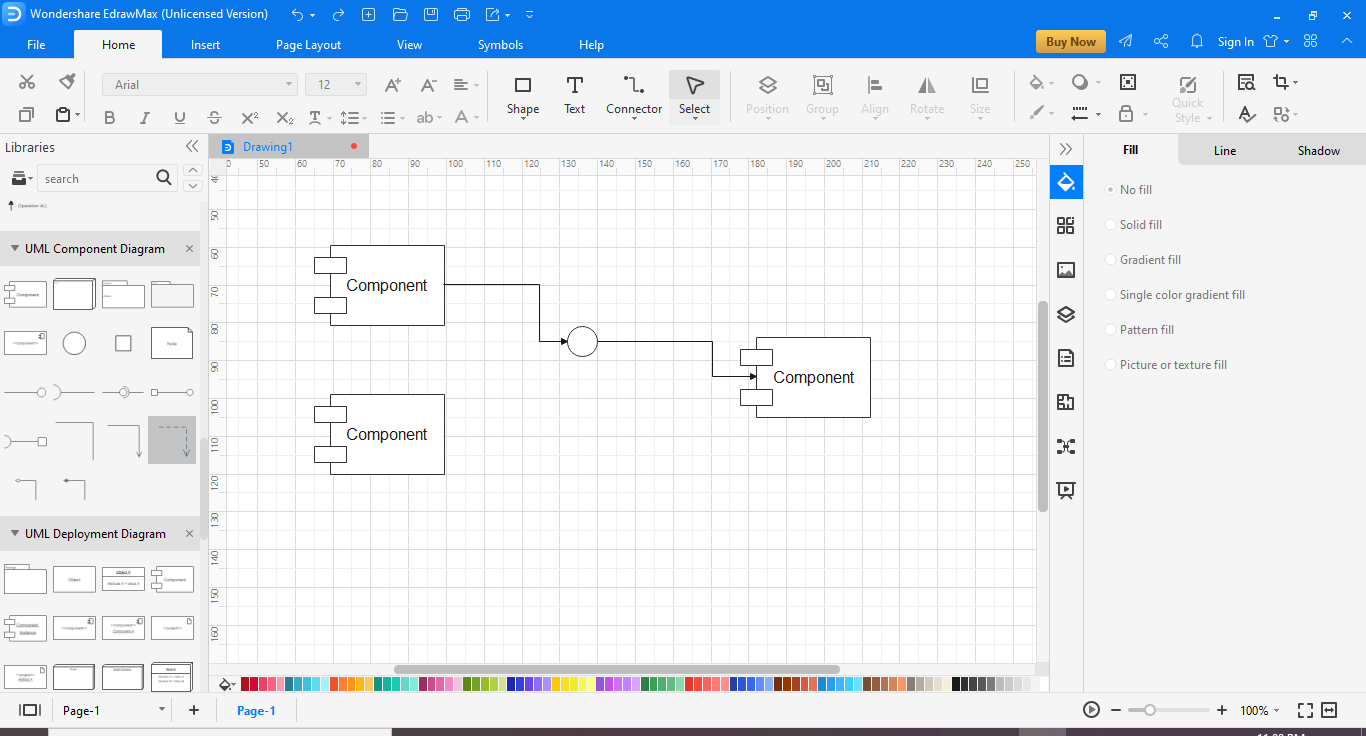
Part 4: How to create a Component Diagram in EdrawMax
You can use EDrawMax for creating all types of component diagrams. To make the task easier for you, you can use the recommended templates of component diagrams from the EDrawMax template library.
Here are the steps for the creation of component diagrams.
Step 1: Start the EdrawMax program.
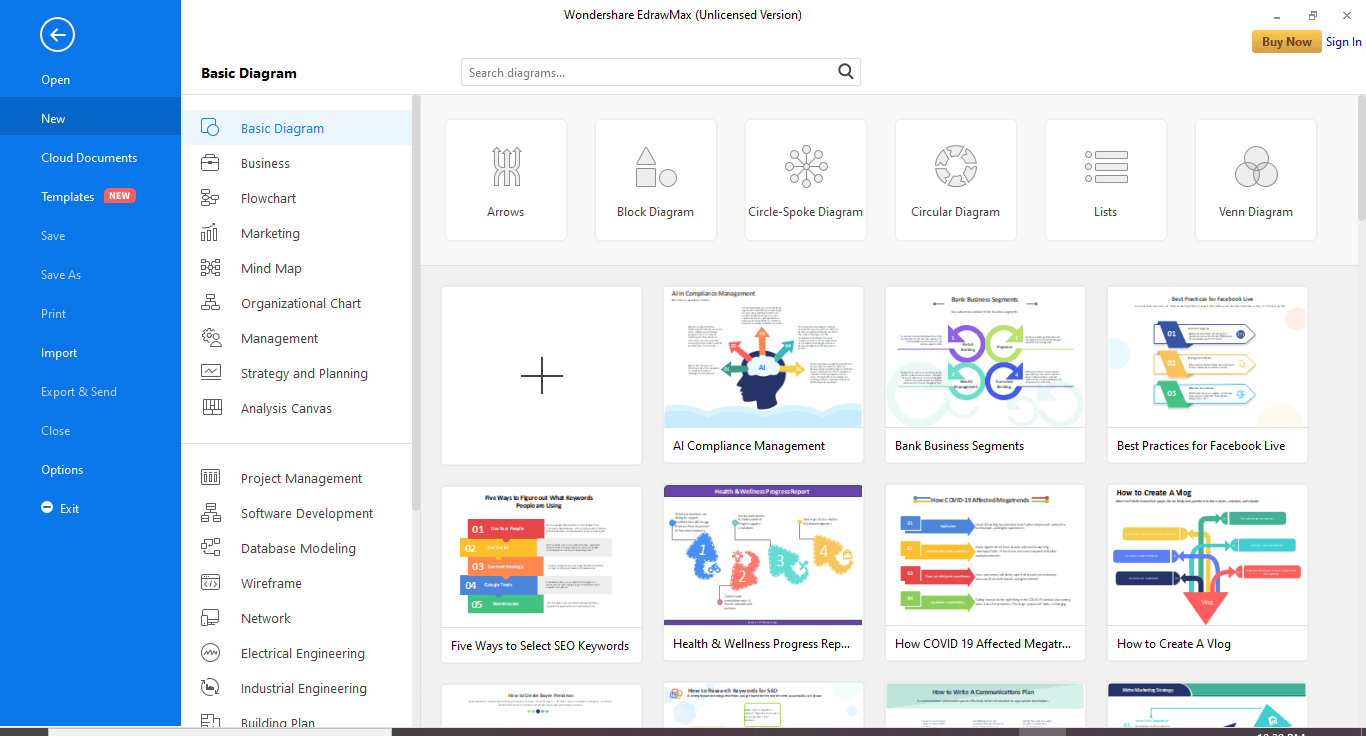
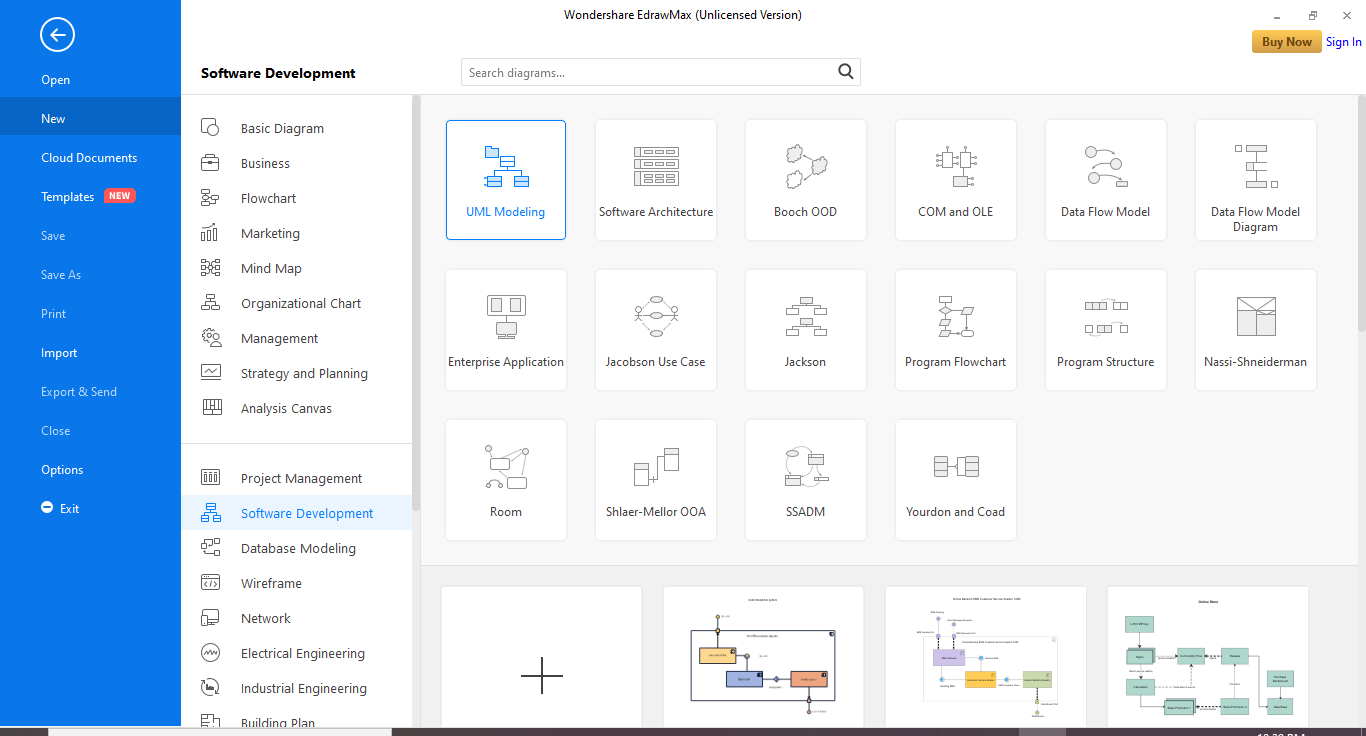
Step 2: Go to New>Software Development and select the UML modeling tile.
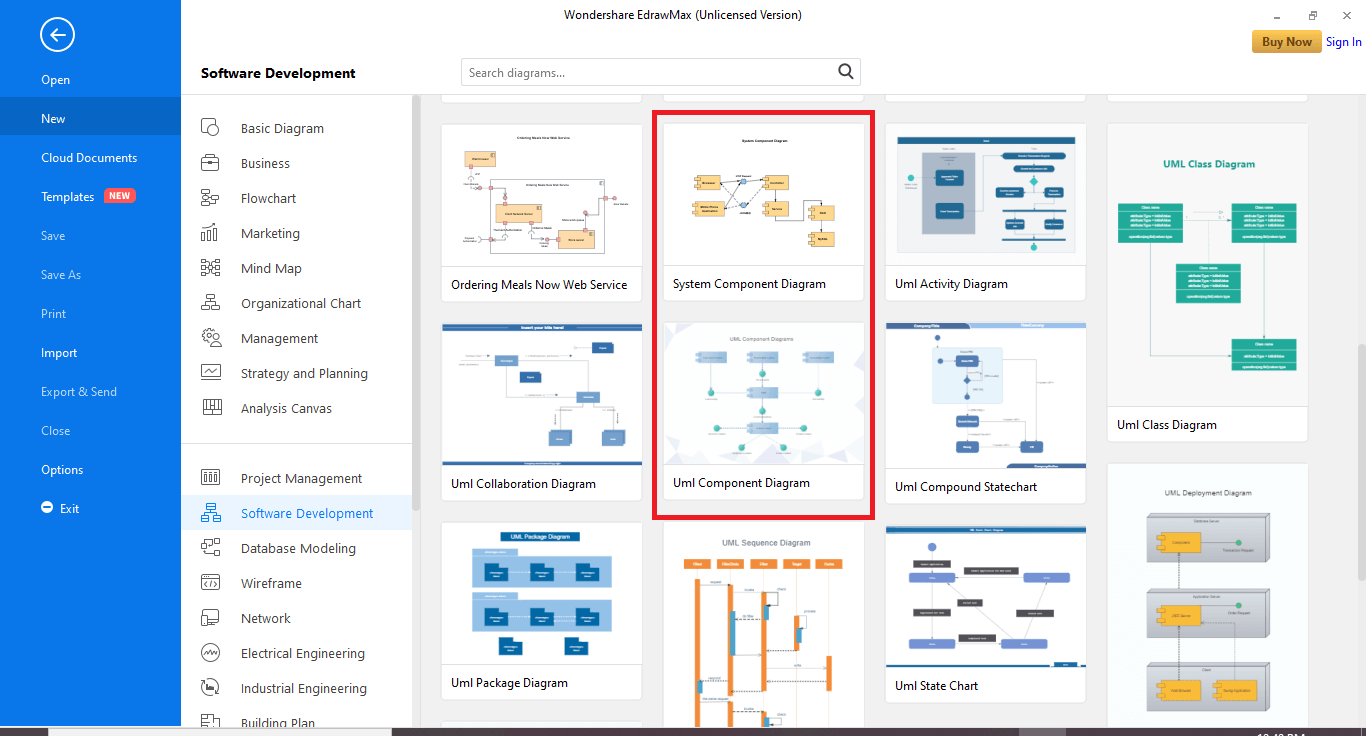
Step 3: In the bottom pane, you have two options for component diagrams. One is system component diagrams, and the second is UML component diagrams. Select the one you need and move ahead with personalized modifications.
If you want to create the component diagrams from scratch, then follow these steps instead.
- Start the EdrawMax program.
- Go to New>Software Development and select the UML modeling tile.
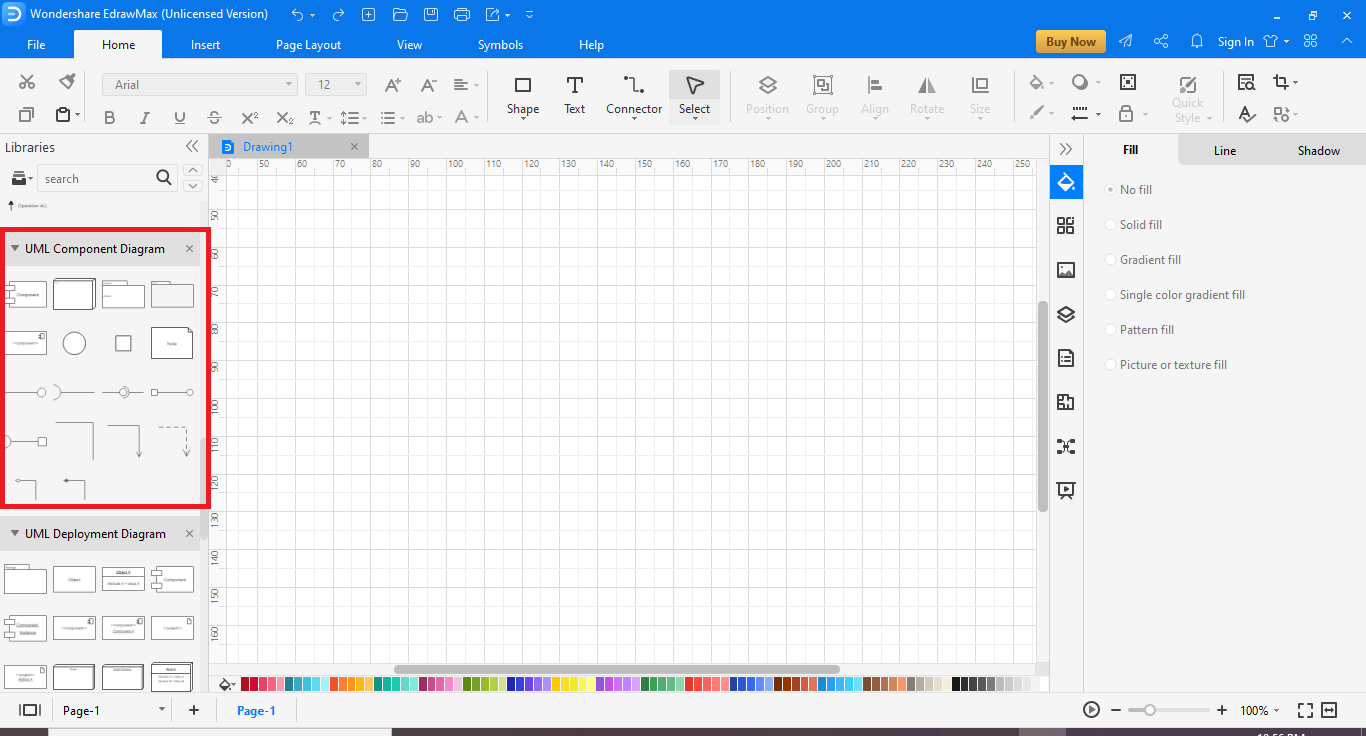
- Now in the bottom pane, click the plus symbol tile.
- You will have a canvas available on your screen. Select the components from the UML Component Diagram portion from the left-hand pane.
- Drag the required symbol on your canvas and create your component diagram.

An all-in-one platform for 210+ diagrams.
・ Simple alternative to Visio
・ 26k+ symbols
・ 10K+ free templates
・ 10+ AI diagram generators


Part 5: Tips for creating Component Diagram
- The level of abstraction in your diagrams should be carefully designed for the group's needs that will use this. For example, you may use a high level of abstraction by showing only the component names for taking client feedback. While for the developers, you will need more details about components and relationships.
- Use precise and concise names and descriptions.
- Try to make clear and clean diagrams with no crossing lines and stacked components.
- Colors and notes can make your component diagrams more legible.
- Making multiple diagrams may help immensely. You can create one with high-level abstraction. And then a few detailed ones for different audiences and required detail levels.
Part 6: Examples of Component Diagram
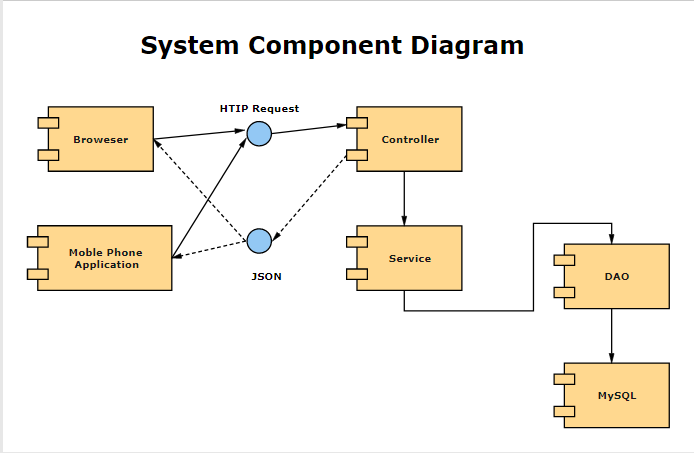
This is a component diagram with six components and shows the structure of JSON requests and HTTP requests. The components are browser, mobile phone applications, controller, service, Data Access Objects, and MySQL database. Full circles show the provided interfaces.
This component diagram shows a high-level abstraction that is a good fit for showing the bird's eye view of a system. This is a good view for showing the relationship for all the stakeholders. Though it has some technical concepts like DAO and MySQL database for a non-technical audience, more details can be omitted, and the relationships can be discussed in isolation.
EdrawMax is suitable software for creating both system component diagrams and UML component diagrams. You can use this software for creating all kinds of component diagrams and represent the abstract visualization of a system or a part of a system.
Read Also:
Fast UML Diagram Software for Linux - Get Free UML Diagram Shapes and Templates


