Use Scatter Plot in Six Sigma
Scatter Plot
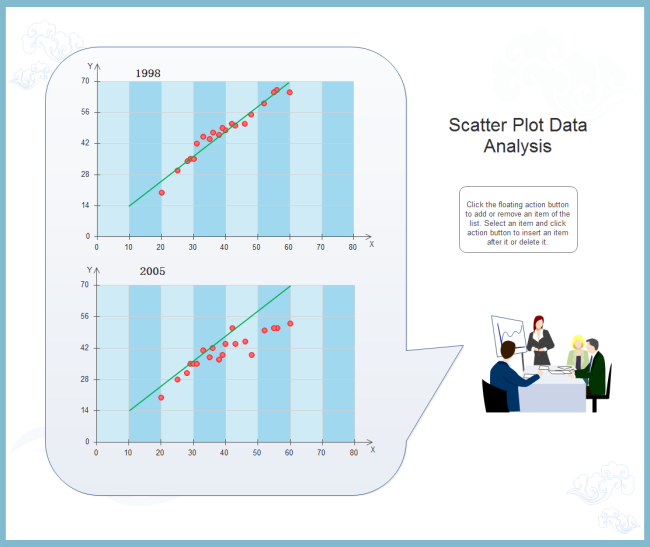
A scatter plot, also called scatter chart or scatter graph, is a type of mathematical diagram displaying values for two variables for a set of data, and make predictions based on the data. It consists of an X axis (the horizontal axis), a Y axis (the vertical axis) and a series of dots. Each dot's position represents its individual X and Y axis values. It's an awesome tool with the ability to show nonlinear relationships between variables, which is widely used in six sigma plans.
Discover More Six Sigma Tools and Templates
Scatter Plot Correlation Analysis
Scatter diagrams have become an indispensable tool for analyzing problem in six sigma program. With scatter plots are commonly used to show how the variables relate to each other. This is called correlation. There are three types of correlation: positive, negative, and no correlation.
- Positive Correlation: A positive correlation is a relationship between two variables such that their values increase or decrease together. Such as the example above, when the x value increases, so does the y value.
- Negative Correlation: A negative correlation means that there is an inverse relationship between two variables - when one variable decreases, the other increases, the vice versa.
- No Correlation: There is no apparent relationship between the variables.
Scatter Plot Line of Best Fit
A line of best fit is a straight line that best represents the data on a scatter plot, which helps make prediction based on past data. This line may pass through some of the points, none of the points, or all of the points. When drawing the line, you want to make sure that the line fits with the trend of most data.
More Scatter Plot Templates
Edraw is a professional scatter plot mapping tool coming with standard built-in value stream mapping symbols and presentation quality templates. All templates in Edraw are customizable. It's easy to change colors, theme and effect to achieve great results. A group of nice pre-defined themes allow you to instantly personalize your drawing with a professional look, fast and effective. Try a ready-made template from the template page to assist with your scatter plot designing process.
More Six Sigma Tools in Edraw
Edraw is an all-in-one visualization software containing flexible tools for different needs. Besides Scatter Plot diagram, Edraw also provides solutions for SIPOC diagram, Cause-Effect Diagram, Value Stream Mapping, Brainstorming, QFD, Affinity Diagram, Scatter Plot, and much more to help finish your six sigma. Among the best diagramming tools available, this software is perfect for experienced diagram designers or those who are just getting started.
Download a free trial and see first-hand how quickly and easily you can create effective and great-looking DMAIC diagrams.
Read More:


