Gantt Charts for Production Planning
What Is Production Planning?
With the development of science and technology, production planning is used in almost industries around us, such as agriculture, clothing and cosmetics etc. Production planning involves not only planning of production but also of manufacturing modules in an enterprise. By making use of resource allocation including work of employees, materials, manufacturing equipment and production capacity, production planning serves different consumers in different industrial fields.
Production planning determines and arranges facilities and activities needed for the future production. A production plan is made periodically for a specific time period, it can comprise the following activities:
- Determining the required product mix and factory load to satisfy customers needs.
- Matching the required level of production to the existing resources.
- Scheduling and choosing the actual work to be started in the manufacturing facility.
- Setting up and delivering production orders to production facilities.

Why Use Gantt Chart for Production Planning?
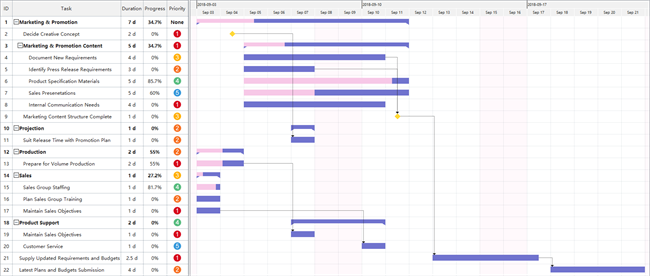
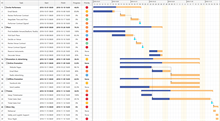
In the process of production planning, the planner needs to fix the production goals and to estimate the resources which are required to achieve these goals. A Gantt chart visualizes the production planning by listing the tasks in a breakdown structure on the left and the progress bar and time span on the right. Its drag-and-drop functionality provides a far more dynamic range of planning and real-time impact on tasks. Common benefits of applying Gantt charts to production planning are as below:
- Forecasts the problems that may arise in the production process and adjust to deviations to ensure on-time delivery.
- Assign tasks with accurate time distribution to schedule the whole production precisely. Bottleneck response, line rerouting, and material substitution are possible in real-time.
- Task dependency enables workers to adhere to and carry out the plan with clear and sequential arrangements.
- Stakeholders are able to estimate the investment, respond to bottleneck problems and know the production progress in real time.
- Cost to production is lowered by strict budget on work, equipment, and material resources, thus removing causes of wastage.
- Accurate calculation of material usage and load promotes cost effective material planning.
How to Create Gantt Chart for Production Planning
Preparations before Creating a Professional Gantt chart for Production Planning
In order to develop production plans, the production planner or production planning department needs to work closely together with the marketing department and sales department. They can provide sales forecasts, or a listing of customer orders. The following preparations are necessary to improve efficiency of production planning:
- Identify the goal of production planning.
- Estimate available resources for the production capacity.
- Reduce design waste.
- Improve functionality and performance of manufacturing machines.
- Pay attention to employees' training.
Choose a Professional Gantt Chart Software
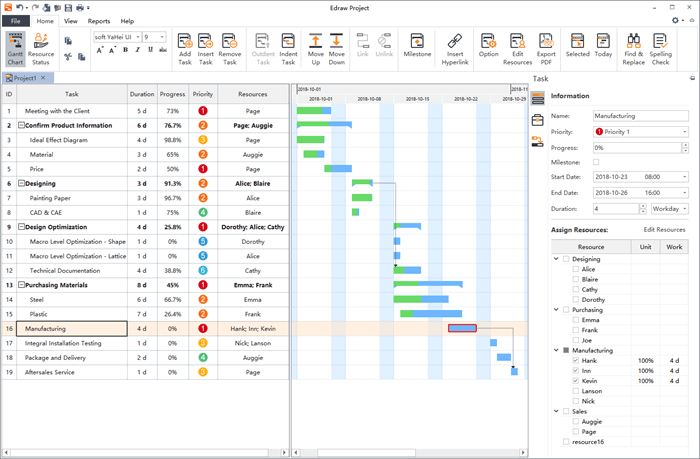
Edraw Project: a professional interactive Gantt chart tool
- Visualize how projects evolve over time
- Schedule, mange, and track your projects in real-time
- Provide various Gantt chart templates and easy-to-use
- Easy to estimate project costs and manage budgets
- Compatible with MS office files (e.g. Microsoft Project)
- Collaborate with team members effortlessly
Applying Edraw Gantt chart software to production planning prepares a detailed plan for achieving the production goals economically, efficiently and in time. Horizontal axis bars representing timelines, duration, start-end date, and the completion times of tasks that are involved. The Reports options of Edraw Project allows the product planner to generate reports on the production from different perspectives, analyze, visualize and share important information with stakeholders. It gives an overall picture of production palnning work breakdown and task reporting relationships, so that the planner could gain insight for budget planning and work resources allocation.
Edraw Project Features Introduction
Watch Edraw Project features introduction in the following video. Learn how to quickly create Gantt Chart with Edraw Project.
Gantt Chart Examples
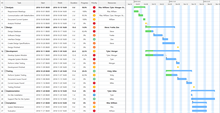
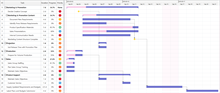
To help you understand how Gantt charts benefits production planning, here are some gantt chart examples made by Edraw Project. You may get inspirations in production planning from these examples. Click on the picture or the text below to download and customize the example for free.
|
|
|
| Develop New Software Gantt Chart | Launch New Product Gantt Chart | Plan a Show Gantt Chart |
Conclusion
From what has been described above, you may have a basic understanding of what production planning is, the advantages of using Gantt charts for production planning, and how to create Gantt charts for production planning. If you hope to deliver your production plan with planned efficiency and coordinating work resources, using Gantt charts would be a nice try!


