KPI Dashboard Creator
KPI Dashboard Software
KPI, short for Key Performance Indicator, is a quantifiable measure used to assess the progress achieved towards a specified goal. It can be used to measure all sorts of processes within a business, like sales, market, finance, production and projects. It's not only useful for company CEOs and team leaders to keep track of performance, but also meaningful for viewers to make better decisions through the data presented. To create a KPI dashboard, a great range of charts and diagram types can be used, such as pie chart, column chart, status table, and gauges charts. Edraw, an all-in-one diagramming tool, provides a fast and effective way for making excellent KPI dashboards.
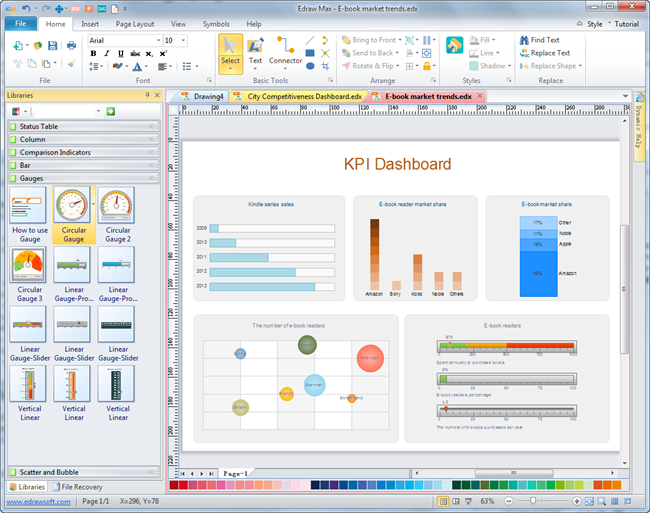
Download a free trial and see first-hand how quickly and easily you can create great-looking KPI dashboard.
KPI Dashboard - Use Smart Pie Charts
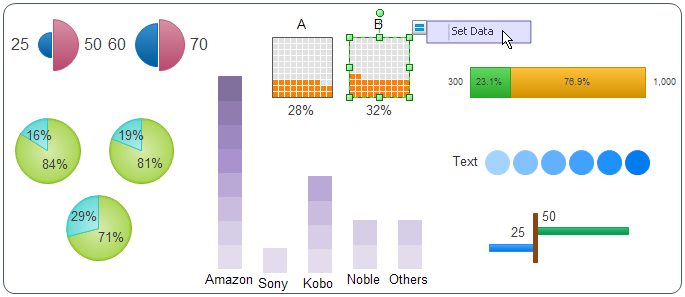
With a pie chart,you will have a clear and comprehensive view of the proportion seach part takes. It's a commonly used tool for KPI dashboard. The following pie chart shows the percentage of each sales person achieves in a total sales amount. Through this pie chart, managers can easily evaluate the performance and behavior.
Edraw pie chart maker offers smart pie chart templates allowing you to create pie chart with only a few clicks. Its friendly interface, extensive symbol libraries and handy templates make the creation experience not only convenient but also entertaining.
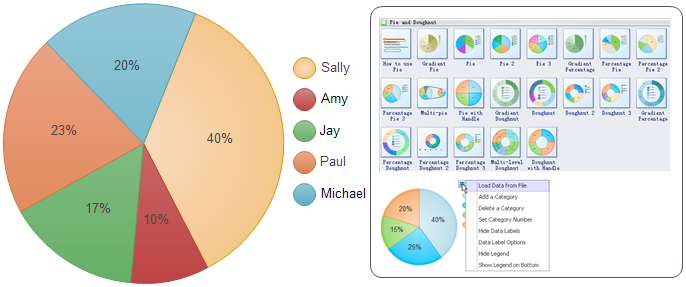
Tutorial: How to Create Pie Chart
KPI Dashboard - Use Column Chart
A column chart is a chart with rectangular bars of lengths usually proportional to the magnitudes or frequencies of what they represent. As each column in a column chart is easily comparable to its adjacent columns, it is easy to see a trend in the KPI being measured using this type of chart.
In Edraw, there are different styles of pre-made column chart templates allowing you to choose in the column chart library. You can even create a column chart through importing a data file, which is amazingly fast. It does save a large amount of manual work and endless adjustments of graphical elements. Try it and experience the magic of this software.
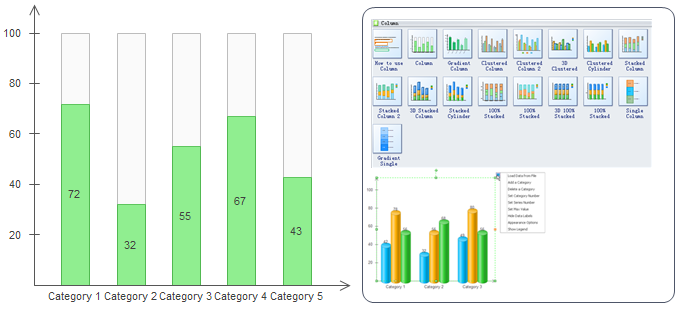
Tutorial: How to Create Column Chart
KPI Dashboard - Use Gauges Chart
You can display key performance indicators (KPIs) in a single radial gauge or linear gauge. Edraw helps you create presentation-quality gauges chart with pre-made templates. The templates are designed with smart functions. Through the action button, you can easily set range number and data, hide data label, remove chart legends with a single click.
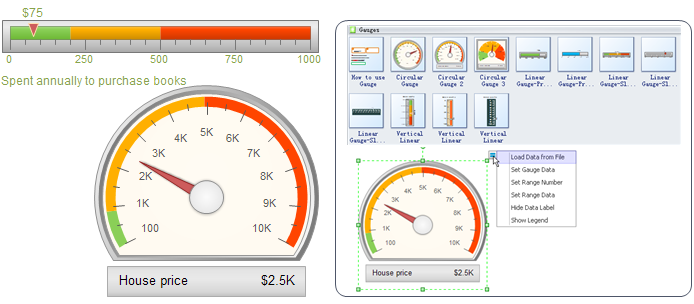
Tutorial: How to Create Gauges Chart
KPI Dashboard - Use Comparison Indicators
Add comparison indicators for your KPI dashboard automatically to show the status. Edraw includes a library of different comparison indicators for your KPI dashboard design. All the indicators have smart behaviors. When you change the data, the shape will change accordingly, very convenient. Download and check it out.
Tutorial: How to Create Comparison Chart


