6 Most Popular Charts Used in Infographics
We know how important charts are for infographics, as most data are visualized through charts. Good charts can illustrate data in an attractive and easily digestible way. How to select the chart that best suits your scenario? Today let me share with you 6 cool charts that are frequently used in daily infographic design.
1. Pie Chart
Pie charts appear quite often in infographics, as they are quite useful when showing percentages of a whole. It's best to use pie charts when you want to show differences within groups based on one variable. In infographics, pie charts come in a lot of variants and styles. See below:

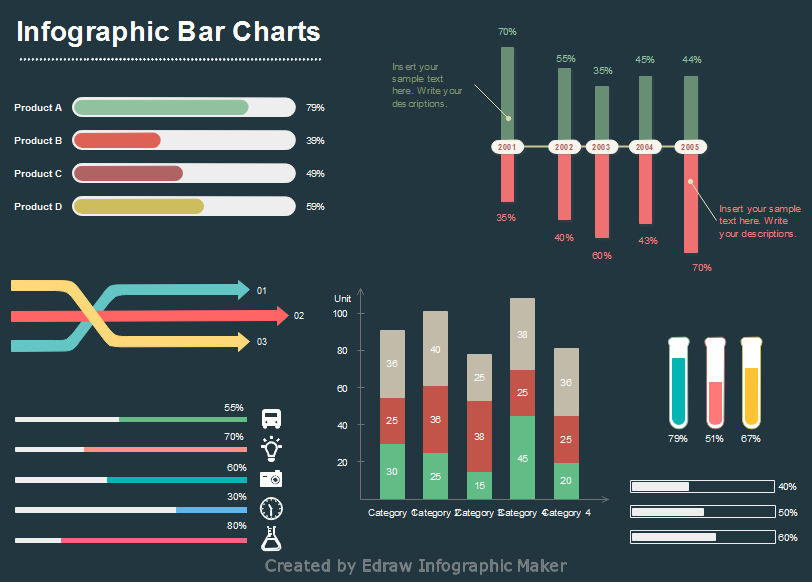
2. Bar Chart
In bar charts, the length or height of the bar is equal to the quantity within that category. Therefore, you can use bar charts to compare data across categories. In infographics, the "bars" can be with different looks. Also, people tend to remove the X/Y axis so that the bar chart look more clear and straightforward.
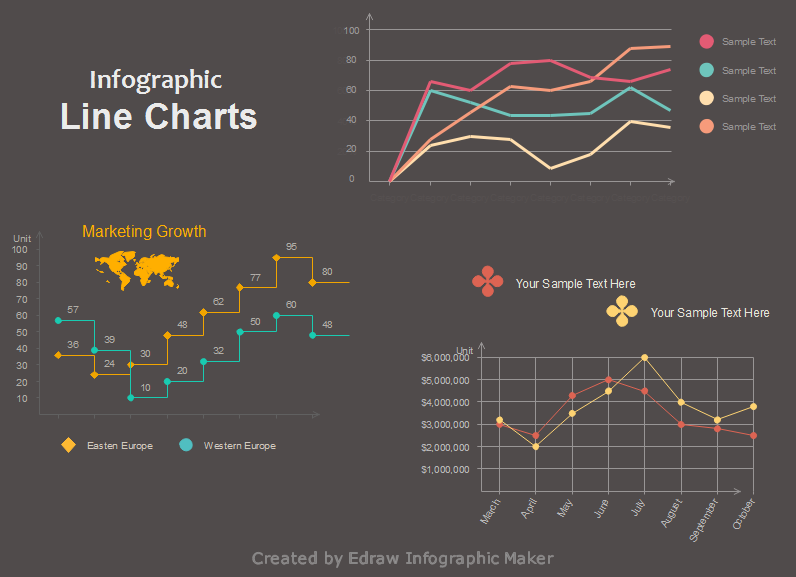
3. Line Chart
A line chart is used to visualize a trend in data over time. It can also be used to compare changes among groups over the same period of time. In infographics, line charts are taken as the best tool to display trends. Sometimes you can use "markers" to show data points, while sometimes not.
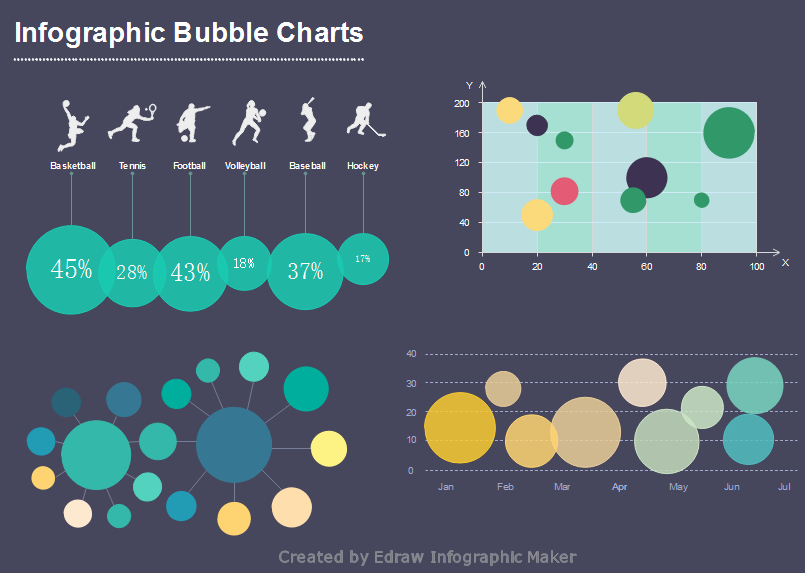
4. Bubble Chart
Bubble chart, as a variation of scatter chart, has 3 numeric-data dimensions - the X-axis data, the Y-axis data, and data represented by the bubble size. It's often used when you want to compare three sets of data. For example, it can visualize the relationships between projects in dimensions of cost, value, and risk. Besides data visualization, infographics uses bubble shape for more purposes, such as presenting brainstorming ideas, displaying relationships, or highlighting a quote.
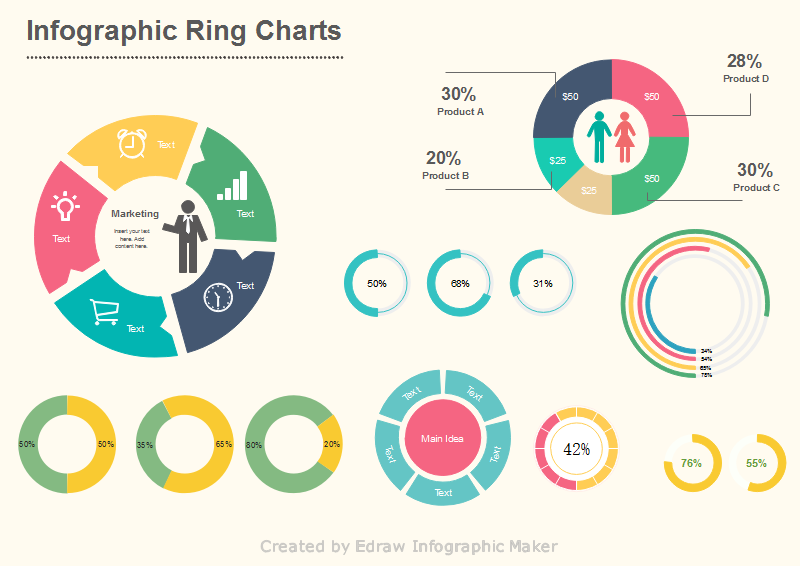
5. Ring Chart
Ring charts are extremely useful graphs in infographic design. You can always find ring charts in infographics. The most popular ring charts are doughnut charts and circular charts. Doughnut chart is a circular statistical graphic, which is divided into slices to illustrate numerical proportion. Circular chart is a type of diagram for displaying procedures or hierarchical relationships.
6. Icon Chart
Icon chart is the chart made of icon. It's free style pictogram, so it can be whatever you like. Icon chart is not ideal to display complicated data. It's usually used when you want to convey a single data point. The icon you choose needs to be related to your infographic topic. For example, if you want to add a bar chart to a medical infographic, you can use the test tube shape instead of the ordinary rectangular bars. This would make your infographic more vivid and straightforward to the topic you are presenting. Below are some icon chart examples:
![]()
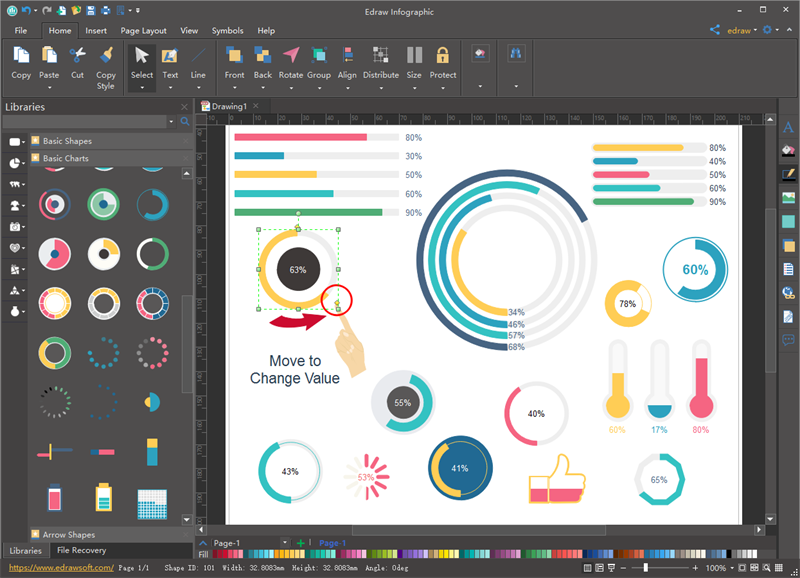
Explor More Charts from Infographic Software!
Experience a faster infographic design with the infographic software. All charts and graphs in the program are easy to customize. It saves you tons of time than using Photoshop or Adobe Illustrator.
Create Stunning Infographics with Edraw Infographic
- Easy-to-use and beginner-friendly
- Various stylish ready-made templates to get started quickly
- Beautiful clipart and numerous symbols to freely customize
- Seamlessly compatible with a variety of file formats
- Export, print, and share your amazing infographics with ease
You Might Also Want to Read:
Six Top Benefits of Using Infographics
7 Tips to Make Your Infographics Stand Out
10 Practical Infographics Layout Templates


