Gantt Chart Templates
As a project manager, you always want to have a piece of deep knowledge about your ongoing project. It is a significant headache that many project managers tolerate. This headache can be minimized if you understand your project and who is responsible for it.
The Gantt chart can suffice you in your project management. In this article, we will see what the Gantt chart is, go through some Gantt chart templates that you may see to take a guide from. We will also show the process of making it, and in the last, we will find the best software to make a Gantt chart on.
Contents
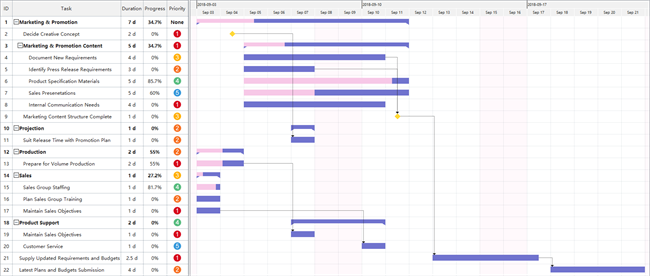
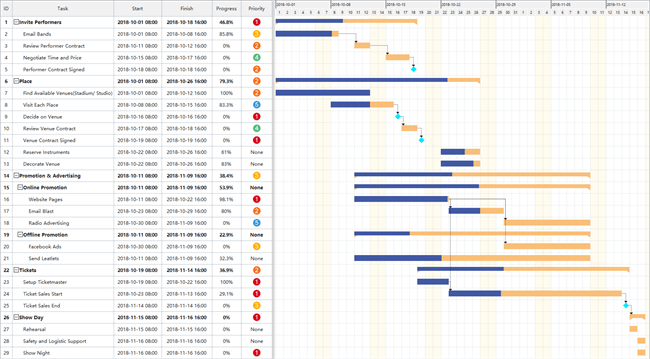
Free Gantt Chart Templates

What is a Gantt Chart?
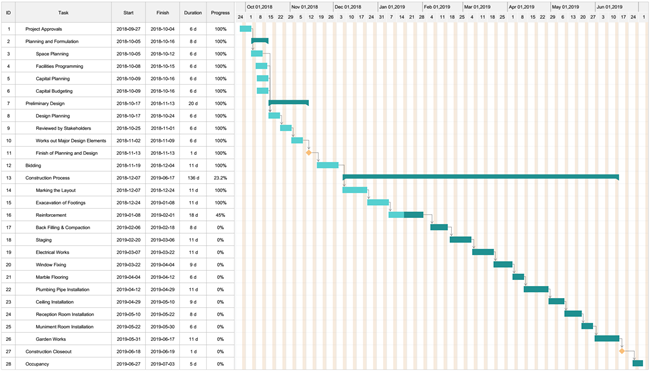
The Gantt chart is the most essential and helpful tool in the project management area. If we say that the Gantt chart is like a dashboard or a tracker system, there is no wrong.
The Gantt chart is the tool extensively used by project managers to track the progress of their ongoing project. The chart tells them all the bits and bytes of the project.
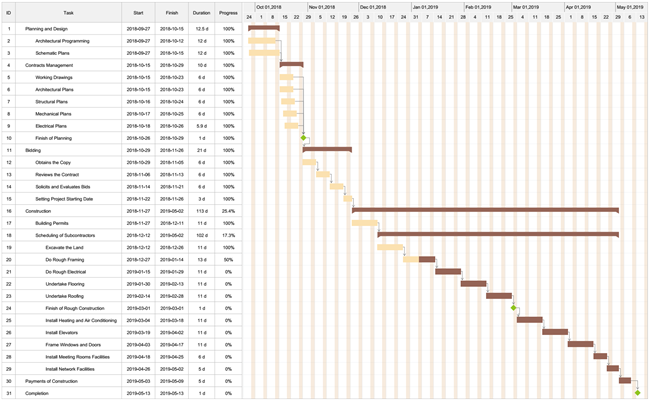
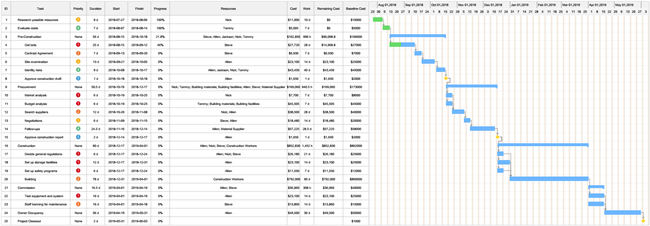
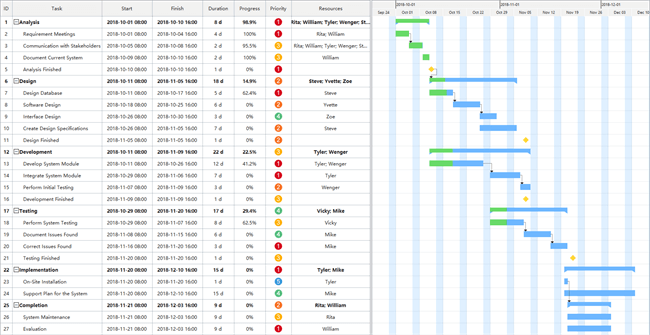
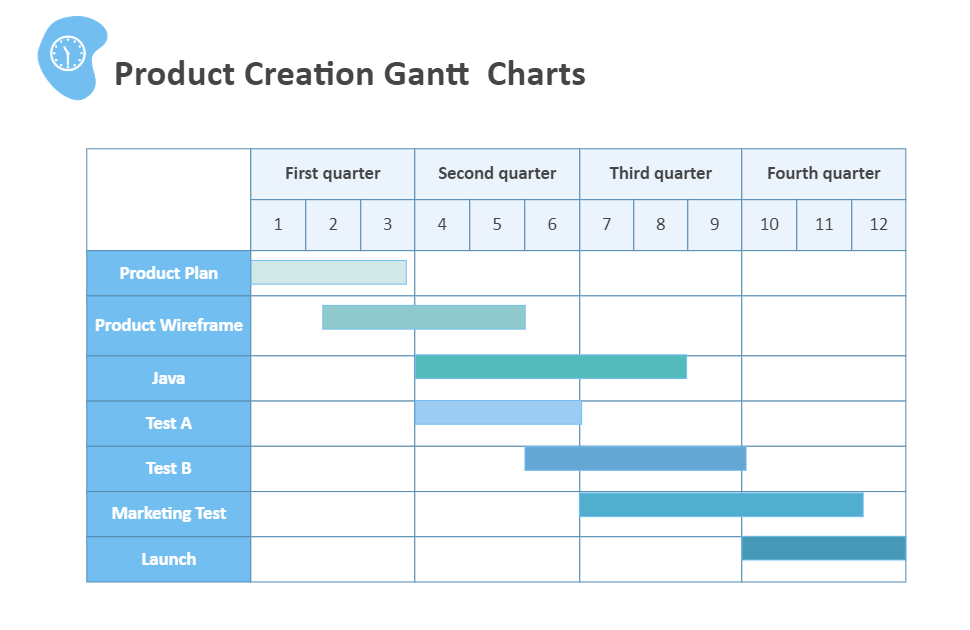
- The resources, tools deployed on the project, the tasks and their dependencies, the time duration, etc. In a Gantt chart, you divide the whole project into multiple tasks and deploy the resources to complete it.
- The tasks are always listed on the first column of the chart, and then you list the task dependencies that show which task is related to another task.
- In the central column, after the recourses and dependencies, you map the bars corresponding to every task that displays how much work has been done relevant to that task or group of tasks.
- The time duration is pinned on the top of the chart by which you compare the task duration and set the milestones.
Where are Gantt Charts Used?
The Gantt charts are heavily utilized in the project management areas. The managers and the team use them to schedule and plan the project, set the deadlines and milestones, and know who is responsible for what task.
The chart is also used to track the project's progress and see if the project is going on the path that was planned in the first place.
Importance of Using the Gantt Chart Templates
The Gantt chart is a vital tool in project planning, managing, and scheduling. It is good to use the templates readily available on the internet or provided by the software you are using to make a Gantt chart for this heavily essential and professional purpose.
It will save you a lot of time, and you will be saved from minor or severe mistakes as you just have to grab the template from the internet and customize it using software to make it look like what you want.
Using templates will make your chart look appealing and clean, and easy to use for tracking the project.

An all-in-one platform for 210+ diagrams.
・ Simple alternative to Visio
・ 26k+ symbols
・ 10K+ free templates
・ 10+ AI diagram generators


How to Make a Gantt Chart Template?
In this section, we will know how to make a Gantt chart template, plus some tips to make them perfect. Follow the below steps to make a good Gantt chart.
Gather the information
The very first step is to gather all the information about the project. When will the task start, and when the tasks would end? What are the milestones, the time duration, resources, task dependencies? Gather each and everything.
Make the chart
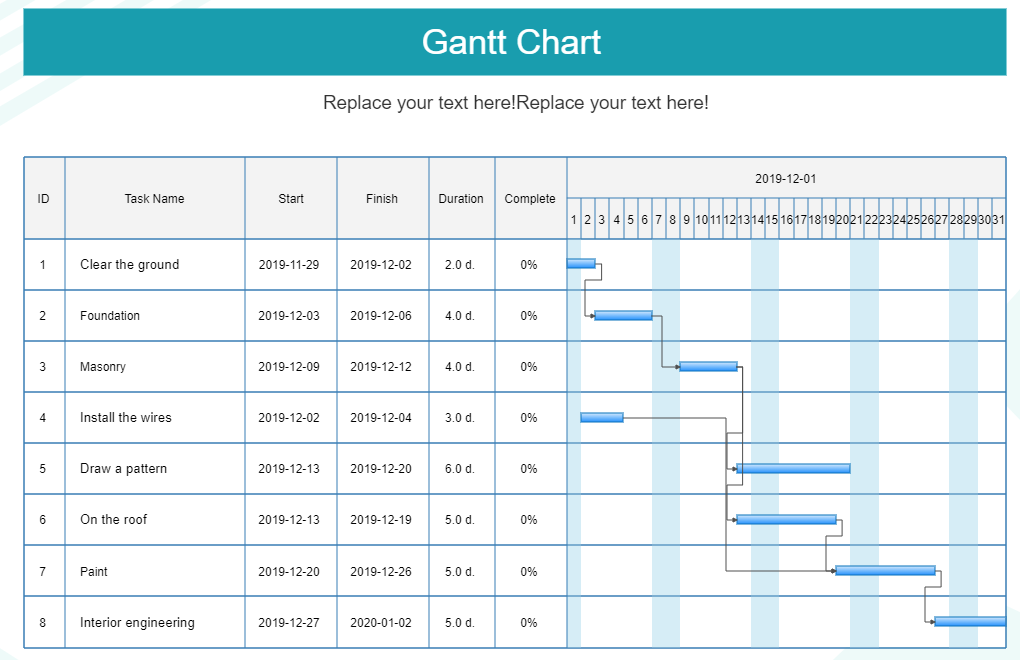
Grab a chart provided by the software you are using to make a Gantt chart. Make three columns on the left of the chart, and this is the most preferred way to represent the Gantt chart.
In the first column, list down all the tasks related to the project. Then in the next column, write down all the task dependencies that are simply the relationship between the task, and then write down the resources or tools used to complete the task.
The Main Column
Now is the time to make the project tracker. After adding the tasks, dependencies, and resources columns, make a comprehensive column and in that column, add the bars corresponding to every task or group of tasks in the project.
In those bars, you are supposed to write the percentage of how much task is completed, but before this, add the time duration bar above the central column, and in that column, write down all the time you decided to complete the task.
You will add the percentages by comparing the time bar and also set the milestones with tasks.
In fact, EdrawMax also supports our users to import the project data that is stored in Excel files and generate their own Gantt charts in minutes. You can watch the video below and learn more details!
Tips for Making your Gantt Chart Look Good
Here are some tips to make your chart correct that will save your chart from going wrong.
- Ensure about the time: Always set and plan the task completion time by estimating everything correctly. Always include the holidays, sick leaves, or any emergency, so always plan the time by keeping such things in mind.
- Information in balance: Information on the chart is good, but everything seems perfect in balance so, always map the information on the chart according to need and for feasibility. Don't add too much information on the chart, as it would look like a maze.
- Keep the chart update: Never make a chart and then forget it. Keep your chart dynamic. Update it regularly while working on the project.
- Add Graphics: If possible, then also add some images on the chart, make it colorful to make it appealing to use.
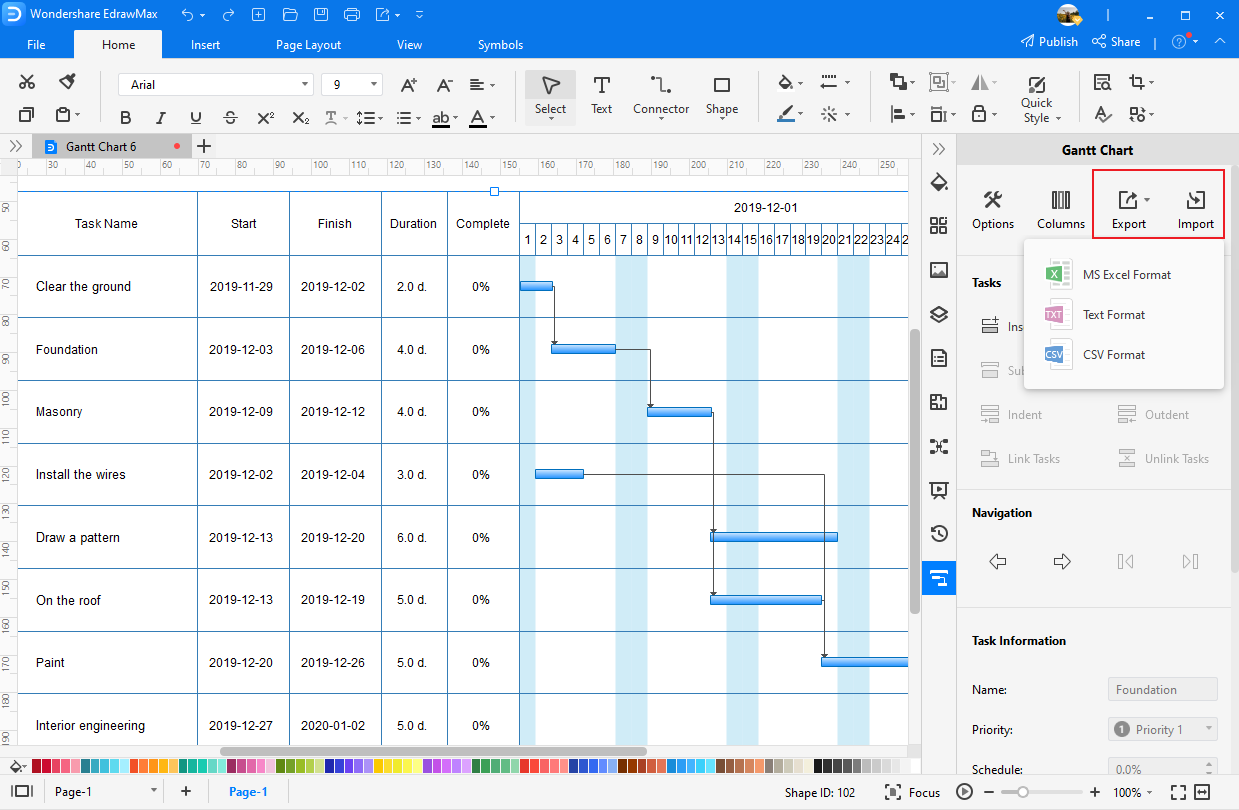
Gantt Chart Templates for Word, PowerPoint, Excel and PDF
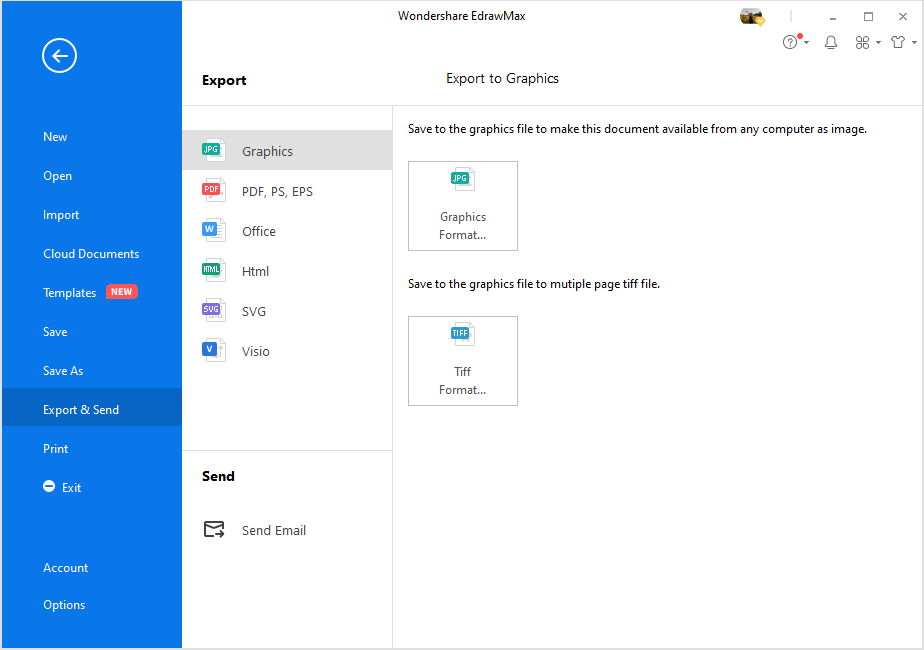
EdrawMax allows users to export Gantt charts as a number of file types, including Word, Excel, PowerPoint, PDF, PNG, JPG, and Visio. Below are some steps to do this task.
STEP 1: Launch the EdrawMax desktop-based application or EdrawMax Online . Complete the login formality if you are in a web-based application.
STEP 2: Navigate to the File above the main window. On that page on the left side, you will see the options listed.
STEP 3: Below, in the options, click Export & Send. Then select the format in which you want to import or export your project and then import or export.
Tips: To export the data of the Gantt chart, you can select the Gantt chart and go to the Gantt Chart pane. There you will find the menu and what kind of file types you can choose for the exported data.
Use EdrawMax for Gantt Chart Creation
For this highly professional and important chart, always urge yourself to use efficient tools like EdrawMax to make Gantt charts that will save your time and make you avoid mistakes. EdrawMax is a well-known diagram-making software that contains five thousand plus diagram-making symbols that will make your diagram perfect.
The software contains hundreds of pre-generated templates that you can use to boost your production. You are also allowed to import or export your projects on any platform allowed by the software. Most importantly, you can use EdrawMax for free and all the templates listed above can be downloaded and edit for free in EdrawMax as well.
Related Articles
Gantt Chart Advantages and Disadvantages for Project Management
What Is a Dependency in the Gantt Chart?
Who Uses Gantt Charts - Explore the Most Popular Roles


