Featured Fishbone (Cause and Effect) Diagram Templates
Introduction to Fishbone Diagram
The cause-and-effect diagram, also called "fishbone" or the "Ishikawa diagram" (named after its inventor), permits identification and organization of a list of factors causing a problem or affecting variation in a desired outcome. The fishbone diagram is essentially a pictorial display of a list. Each diagram has a long arrow pointing to the name of the problem or issue. The branches off the arrow represent main categories of potential causes. Smaller branches, representing sub-categories are then drawn off of each major branch. Refer to Ultimate Fishbone Diagram Tutorial for a complete guide.
General Characteristics of Edraw Templates
Generally, fishbone diagrams made by Edraw are characterized by:
- Perfect layout with all lines paralleled and evenly spaced.
- Clear classification of all factors.
- Easy adding and deleting of lines and text for the attached connection points.
- Instant change of theme through which color, line and fill styles can all be enhanced with 1 click.
- Flexible presentation aided by the function supporting modification in full-screen mode.
Each Template's Uniqueness
Check out each template's uniqueness through illustrations.
Template 1 Lab Results Delay
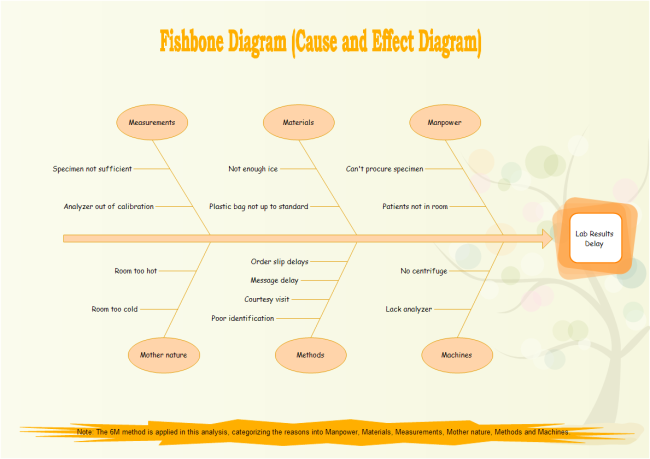
Creative rectangle shapes are used to present the problem - Lab Results Delay. This shape can be easily changed through the function of Replace Shape on Home tab. Another merit of this template is the Callout shape which is very flexible for adding a description or other information. The beautiful background really glorifies the fishbone diagram, matching with the color perfectly.
Template 2 Why Children Are Lack of Reading Interests
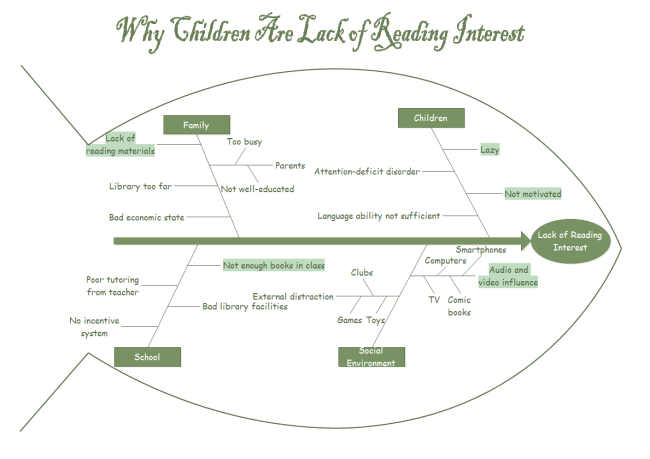
The title of this template is Vector text which can be adjusted by dragging its selection handles. A fish frame shape is used to make it quite vivid. Important information is highlighted. All shapes are connected and perfectly distributed.
Template 3 Low Market Share
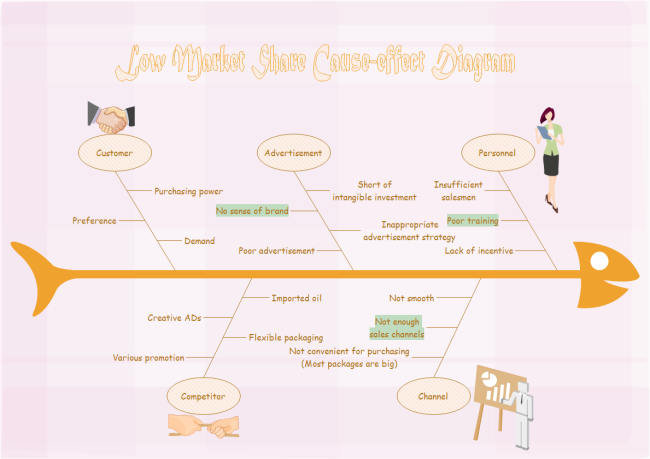
The unique part of this template is that some ideas are visualized by clipart. Readers can understand the concept at a glance in this way. The crucial information is also highlighted.
How to Modify Templates
- Click the picture to download the template you need (both eddx and PDF formats are available).
- To delete a category or cause, choose it and then press Delete key.
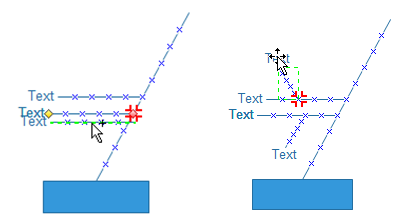
- To add an element, drag it from the library pane; connect it to its upper level (the connection points turn red when they are connected). You don't need to worry about the distance because Edraw has thoughtfully distributed them evenly.
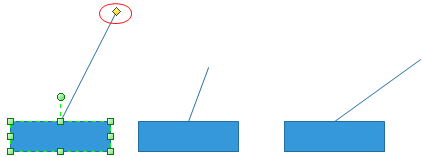
- The category shape has one yellow control point. Drag it to change the line length and direction.
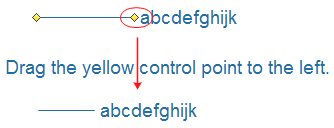
- The cause shapes are designed with two yellow control points: one for adjusting line length and the other for moving line. When a certain cause includes much text, you can decrease the line length so that the diagram won't look too cramped.
When it's finished, you can easily print or export the diagrams to PDF, Microsoft word, excel, ppt formats, or save them as images. Click here to see how to make an effective cause and effect with Edraw.
More Fishbone Diagram Examples
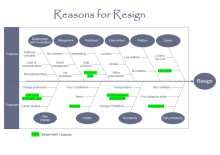
This is an example about the causes for employee resign. All the reasons are divided into two parts with a cross-functional shape: reasons from the perspective of employer and reasons from the perspective of employee.
The title of this template is highlighted by Vector text, which can be adjusted just like other Edraw shapes. A fish frame shape is used to surround all causes, making the diagram more vivid.
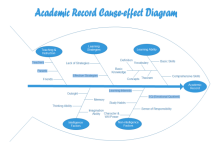
This is a relatively simpler fishbone diagram with limited number of causes. Thus, its layout is easy, locating all reasons on the left of the category shape, looking neat and organized.
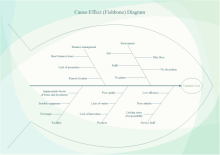
To make the fishbone diagram more aesthetically attractive, a background can be added just like the left example. More background shapes with diversified styles are available.
Discover why Edraw is an excellent program to create cause and effect diagram. Try Edraw FREE.
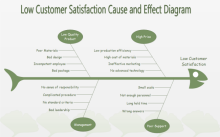
Lost Customer Analysis Fishbone Diagram
5W1H Method for Cause-effect Analysis

