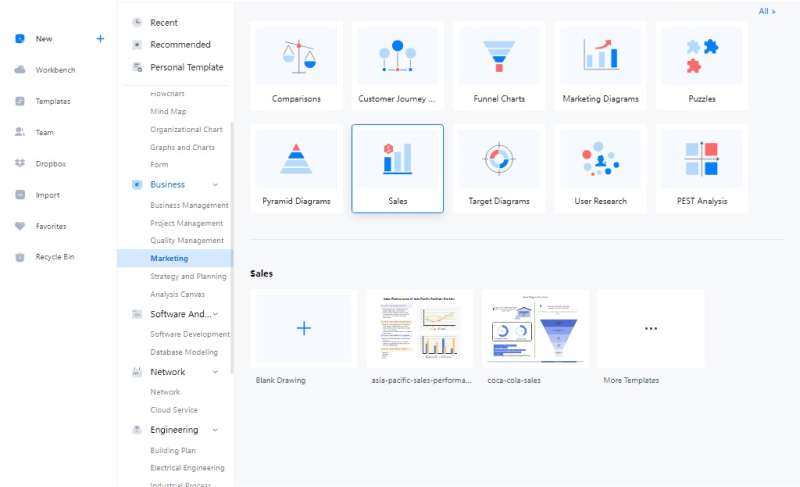
Elizabeth has researched various software programs before adopting EdrawMax for her team. Many factors have influenced her decision. She is truly amazed at the wide range of symbols, various types of charts and graphs, and the well-stocked library of templates.
Because of its extensive features list, they have adopted EdrawMax Online as their preferred drawing and diagramming solution. They can use premade templates for making progress at a fast pace, the symbol library is very well stocked, and the intelligent adjustment on the canvas adds excellent value for the team.
She mentioned that her team can now clearly see sales outcomes using different visual representations like graphs and charts. They can import data from spreadsheets and convert them into visuals. This insight helps them manage the company's budgets, expenses, growth strategies, and resource management effectively.
Also, more accurate sales forecasting and management are helping them to make better decisions and anticipate potential issues early.
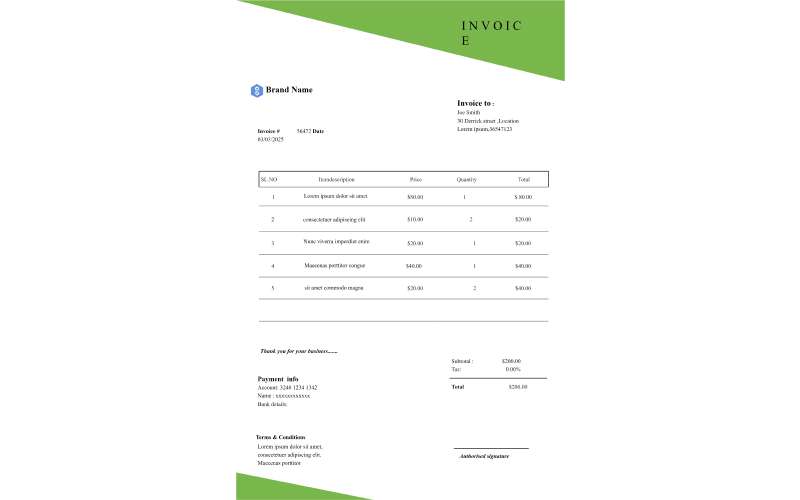
Record-keeping Using Invoice
Elizabeth's team members have always been wary of manual data entry as it is time-consuming and error-prone. Secondly, another time-consuming task was double-handling and excess communication during sales deals. Now, they have automated sales processing using the import of data options, invoice templates, and cloud storage. They import the data into the invoice template, fill it in, and email it to all stakeholders. Since the file can be exported in PDF, a portable format, no compatibility issues arise. They also save the invoices in cloud storage under their respective folder, where all stakeholders can access and reference them.
 Source:EdrawMax Template Community
Sales Presentations
Elizabeth manages different types of presentations in her portfolio. She has to present to potential clients to increase the business. Then there are presentations where she teaches and trains her team. Visual aids in presentation and the option to add text in a clean layout allow her to make different presentation styles to attract her customers and involve her team in presentations.
She loves making presentations in EdrawMax as it is very well stocked with layouts, visual data representations, clipart, symbols, and shapes. Also, once she is done with the design of her presentation, she can present it right from the EdrawMax interface without switching to any other software.
 Source:EdrawMax Template Community
Sales Graphs for Revenue Boost
Sales graphs and charts provide a coordinated and holistic approach. This process helps the sales team to gain the best actionable insights. This insight increases awareness and supports strategic engagement to generate the required results.
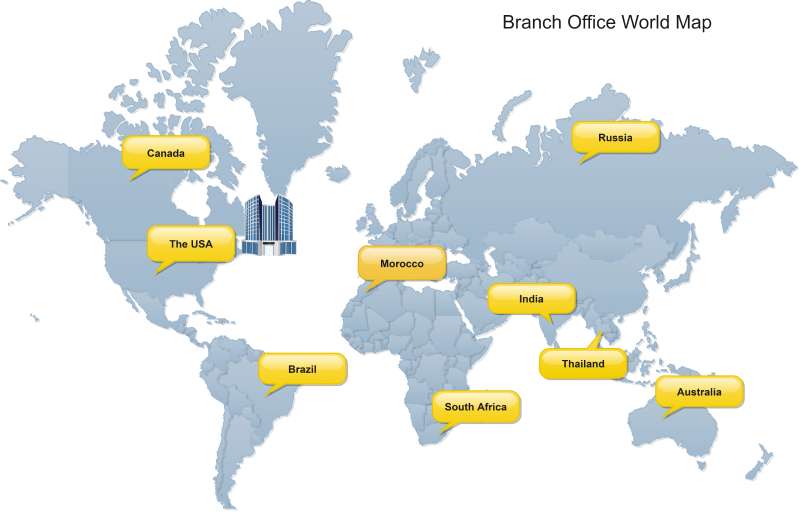
Elizabeth also builds account maps to identify key relationships between stakeholders and find the most efficient path for a sales deal. These maps help her learn about the players involved in the deal and then choose the best sales processes and practices.
 Source:EdrawMax Online
The Results
Process Automation in invoicing, data import, and reporting.

Attractive and influential presentations using templates, clipart, and import of visual data.

Data analytics made easy using concise statistics in the forms of graphs and charts.