Customer Story

Power of Diagrams in the Manufacturing Industry

EdrawMax accelerates the growth and production of government and enterprise clients around the world.

Meet Anne Robinson
Name Anne Robinson
Industry Textile Manufacturing
Role Plant Manager
Needs
We need proper and perfect diagrams for our process planning, design, and fault detection.
Anne Robinson is plant manager in a leading textile manufacturing company. She is keen to introduce innovation to improve efficiency in the process and increase productivity and throughput.
EdrawMax Customer Story

Challenges and Problems You Are Facing in Work or Study

Improved Communication

Communication supports coordinating the efforts of a team throughout the manufacturing process. Better communication between team members and stakeholders helps in reducing risks, improves productivity, cohesion, and engagement.

Fault Detection

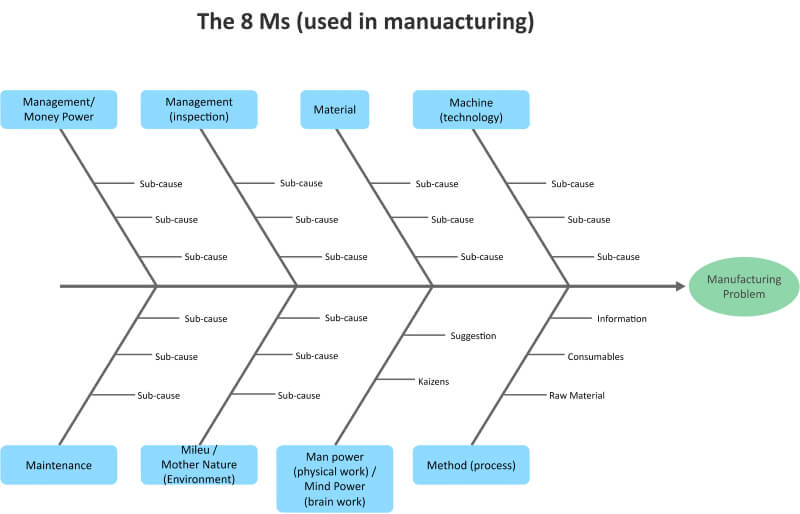
A well-designed diagram of plant, process, and machines supports early fault detection and root cause isolation. When the diagrams are not present, the process of fault detection depends on hit and trial.

High Efficiency

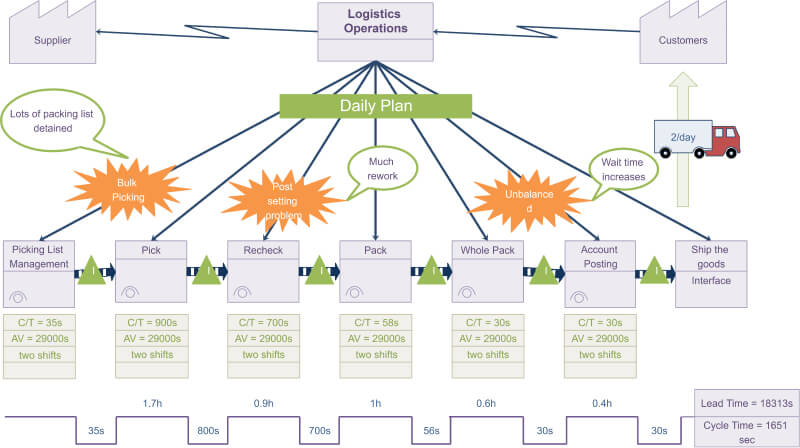
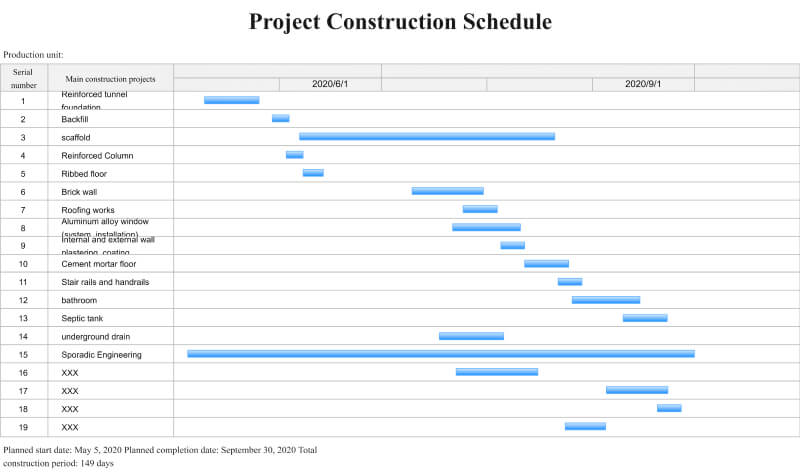
Proper planning and design are key factors contributing to high efficiency. Diagrams improve efficiency because there is standard job distribution, audit, an emergency plan, and also prediction of faults to preempt the undesirable events.

The Solutions
Anne Robinson discovered EdrawMax Online through a seminar on workplace efficiency organized by an HR training company. They use various diagrams to improve efficiency, communication and fault analysis, and detection. Anne thinks they have saved a lot of time and effort by using various comprehensive diagrams drawn in EdrawMax. She loved that once her team was done with the drawing, they could easily export it into different formats like PDF, JPEG, Visio files, and others to distribute throughout the company. It saved them from a lot of trouble and compatibility issues. EdrawMax is an excellent tool for manufacturing plant managers and their teams. Its strength lies in its comprehensive support for various drawings, charts, and templates. Since it has a very easy layout and anyone from Anne's team could use it without any software or IT background.
Fishbone diagrams for Problem Solving
Anne uses fishbone diagrams to highlight the problems and the relationship between process variation and their potential sources in a quality improvement plan. They brainstorm the problem and the causes of the deviations to see where there is the most room for improvement. The brainstorming sessions help every stakeholder contribute and come to a conclusion leading to a solution. Fishbone diagrams help in identifying root problems rather than just symptoms. It is very effective in collaborative exercises. It helps in identifying alternative causes that provide innovation to the fault analysis. Sometimes, a fishbone diagram can get very complex, with many branches and many causes of the problem.
EdrawMax Customer Story - Fishbone diagrams for Problem Solving
Source:EdrawMax Template Community
Material Flow Using Value Stream Mapping
Different industries need to strive for continuous improvements to increase their competitiveness. Anne uses value stream mapping for reducing waste to conform to lean methodology. This waste includes printing paper, overproduction, unnecessary movement of products and materials, and extra processing. VSM creates an implementation plan to properly use available resources to ensure that materials and time are used efficiently. Value Stream Mapping is a powerful planning tool to optimize the results and eliminate waste.
EdrawMax Customer Story - Material Flow Using Value Stream Mapping
Source:EdrawMax
Scheduling Using Gantt Chart
Gantt charts create a responsibility allocation tool for the team to follow. All tasks are clearly outlined, and everyone knows their responsibility. Resources can represent machines or people. This responsibility allocation also provides a means to audit the performance of employees and other resources to see if everything and everyone is performing up to the mark. The Gantt chart helps production staff plan, control and optimize the production plan. Gantt chart takes materials, resources, and workforce into account and schedules their use. Anne thinks using Gantt charts has helped them make the best use of available resources, minimize work in progress, and optimize throughput times for production orders.
EdrawMax Customer Story - Scheduling Using Gantt Chart
Source:EdrawMax Online
The Results
Reduced waste of resources and workforce. Value Stream Mapping is a powerful planning tool to optimize the results and eliminate waste.
Early fault detection in process variation and identification of potential sources in a quality improvement plan.
Planning, control, and optimization of the production plan are possible using the Gantt chart.
Exploring the template library is like opening a treasure box. We found many relevant templates that could help us in improving in our process, resources management and efficiency. It saved a lot of effort and gave us a quick start.

Ready to Upgrade Your Business?

Our team will be happy to discuss plans, products, and services with you.

Contact Sales For Individuals
Recommended Reading
Edraw Diagram Maker
EdrawMax Helps You Design Like A Pro | EdrawMax Customer Story
Edraw Diagram Maker
EdrawMax Supports Strategic Planning | EdrawMax Customer Story
Edraw Diagram Maker
Bring Innovation to Product Design | EdrawMax Customer Story