Bar Charts for Better Data Analysis
What Is Bar Chart
A bar chart or bar graph is a chart with bars whose lengths are proportional to quantities. Bar charts can greatly benefit data annalists for its visualization nature. For those time-crunched viewers, bar charts help them "get the picture" at one glance quickly.
How to Use Bar Chart to Analyze Data
Bar charts provide a visual presentation of categorical data and are also very useful for recording discrete data.
They can also be used for more complex comparisons of numbers with grouped bar charts and stacked bar charts. In a grouped bar chart, for each categorical group there are two or more bars. These bars are color-coded to represent a particular grouping.
You can simply compare different objects in terms of quantity, or you can also analyze their proportional relationship by showing their percentage to the whole.

Make Bar Charts with Automatic Software for Data Analysis
With Edraw,youdon't have to spend tons of time drawing bar charts by hand any more. It is automatic vector-based diagramming software with comprehensive drawing and formatting functions. All basic chart types are included with abundant pre-drawn templates with smart button which support auto generation of shapes. Edraw's competencies lie in its agility, expertise and technology. See how amazing it is right now.
Download Bar Chart Software
Bar Chart Symbols
Edraw software offers you plenty of special bar shapes including simple bar, gradient bar, bar, 3D bar, cylinder bar, stacked bar, 3D stacked bar, stacked cylinder, 100% stacked bar, 3D 100% stacked bar, 100% stacked, single bar. They are all vector format supporting zooming in or out from 10% to 400%. These shapes feature in their smart functions allowing fast generation of new shapes. See more about them in Bar Chart Symbols.
Bar Chart Templates and Samples
Create a customized bar chart easily from well-designed templates or samples. Enter any data, customize the chart's colors, fonts and other details, then download it or easily share it in various formats.
Bar Chart Sample - Sales Report
Here shows an elaborately-made bar chart example, which is editable, printable and sharable.
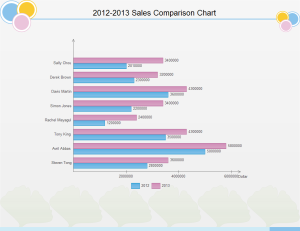
Bar Chart Example - Sales Comparison
An editable example of sales comparison bar chart is provided on the right. Use it to present your own bar charts.
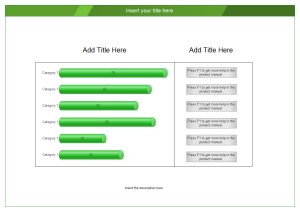
Presentation Templates for Showing Data Analysis
After creating the bar charts, you can add them into beautiful presentation slides to show your analysis better. Here are some free unique presentation templates.
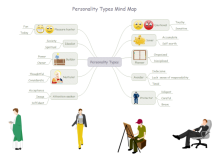
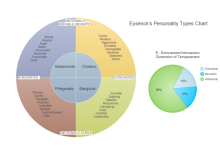
In Edraw, you can create more kinds of diagrams to demonstrate information visually, such as mind map, circular diagram and matrix diagram and so forth.
|
|
|
|
|
|
In conclusion, bar charts help to make the data you collect more accessible, understandable and meaningful. To analyze data more effectively, try the easy data analysis solutions offered by Edraw. Things will become as easy as pie.


