5W1H Method for Cause-effect Analysis
Introduction to Cause and Effect Diagram
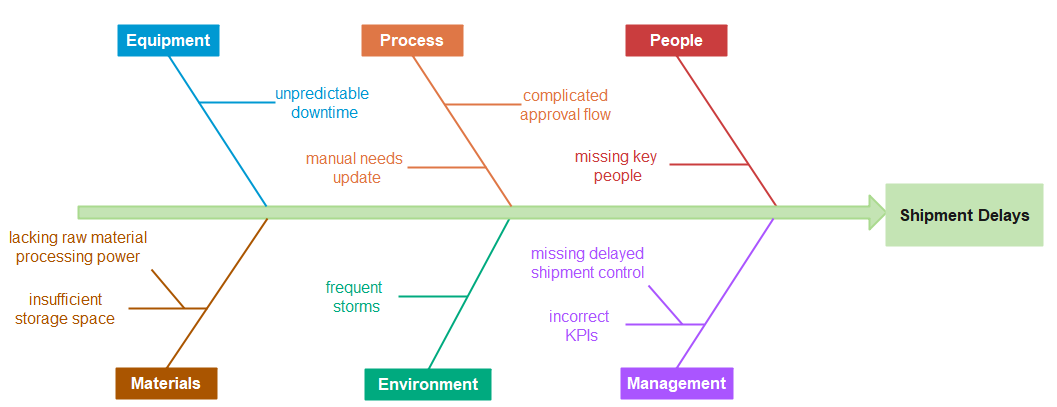
What's a cause-effect diagram?
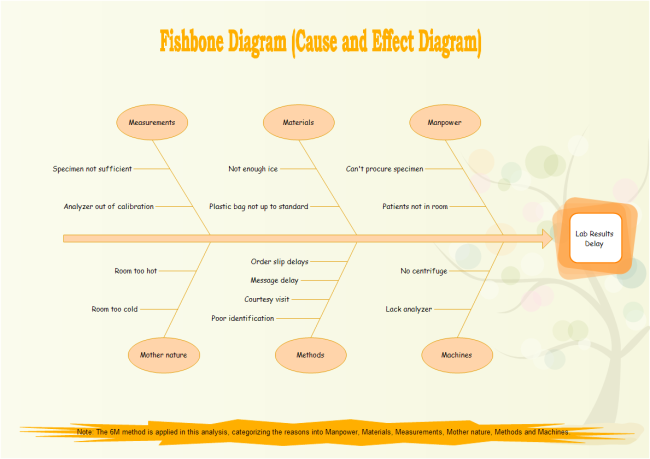
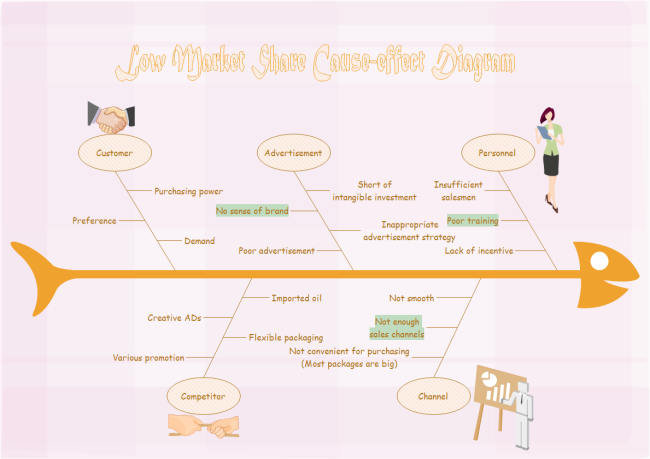
The cause and effect diagram is also called the Fishbone Diagram. It is composed of a single effect and multiple causes. The head of the fishbone represents the problem/effect, and the body shows various causes that contribute to the overall effect or problem.
Fishbone diagrams are often used in project planning sessions to identify all of the components that go into any workflow process. (often categorized as Manpower, Machinery, Materials, Methods, Measurements, Mother-nature and Manpower) Once these components are identified, it's a lot easier to look at each one and see where problems or inefficiencies are creeping into the process.
Why a cause-effect diagram is important?
1. It boosts creativity through a brainstorming process.
2. It is useful in brainstorming sessions to focus conversation.
3. It provides a visual graph of the problem and potential categories of causes.
4. It allows various categories of causes to be explored and uncovers bottlenecks in a certain process.
5W1H Method for Cause-effect Analysis
There are many skills and techniques for better cause and effect analysis. For instance, the 6M method (Manpower, Machinery, Materials, Methods, Measurements, Mother-nature, and Manpower) is effective in finding out and categorizing major reasons. Another useful way is brainstorming, through which more causes can be figured out. The simple 5W1H method can also be adopted to ease the analysis process.
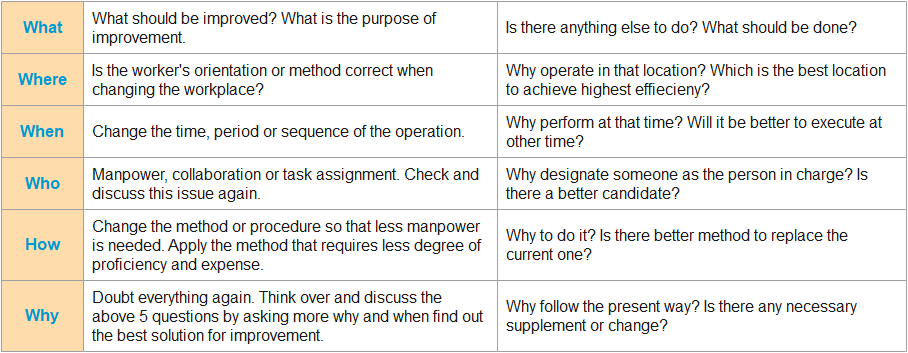
The first W is What. What should be improved? What is the purpose of improvement? Is there anything else to do? What should be done?
The second W is Where. Is the worker's orientation or method correct when changing the workplace? Why operate in that location? Which is the best location to achieve highest efficiency?
The third W is When. Change the time, period or sequence of the operation. Why perform at that time? Will it be better to execute at other time?
The forth W is Who. Manpower, collaboration or task assignment. Check and discuss this issue again. Why designate someone as the person in charge? Is there a better candidate?
Then, it is about How. Change the method or procedure so that less manpower is needed. Apply the method that requires less degree of proficiency and expense. Why to do it? Is there a better method to replace the current one?
The last W is Why. Doubt everything again. Think over and discuss the above 5 questions by asking more why and then find out the best solution for improvement. Why follow the present way? Is there any necessary supplement or change? Here is a table of the detailed introduction of this method.
Best Solution for Cause-effect Analysis
The best solution to carry out cause and effect analysis and draw fishbone diagrams is to use all-in-one diagramming software - EdrawMax. It has an intuitive user interface and a simple drag-and-drop feature to make draw diagrams easily and quickly. With inbuilt shapes, abundant ready-made templates, and various formatting tools, it is easy for you to create and customize beautiful cause and effect diagrams.
You can also use EdrawMax to analyze with the 6M method and 8Ps method, which both are popular techniques in the business and management fields.

An all-in-one platform for 210+ diagrams.
・ Simple alternative to Visio
・ 26k+ symbols
・ 10K+ free templates
・ 10+ AI diagram generators


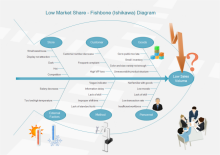
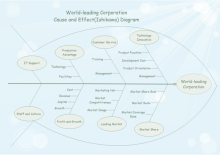
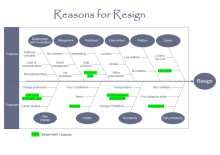
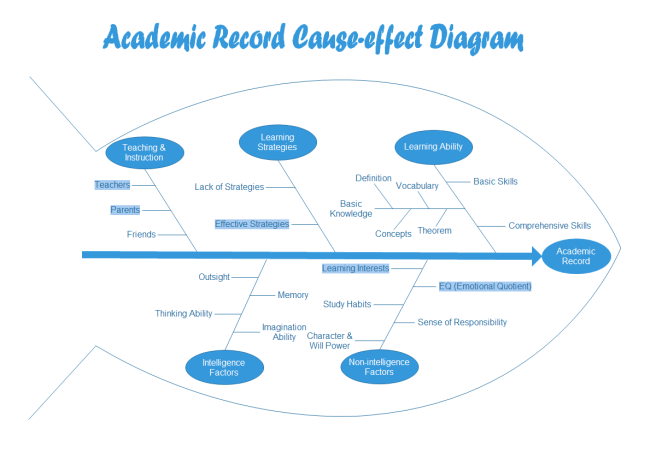
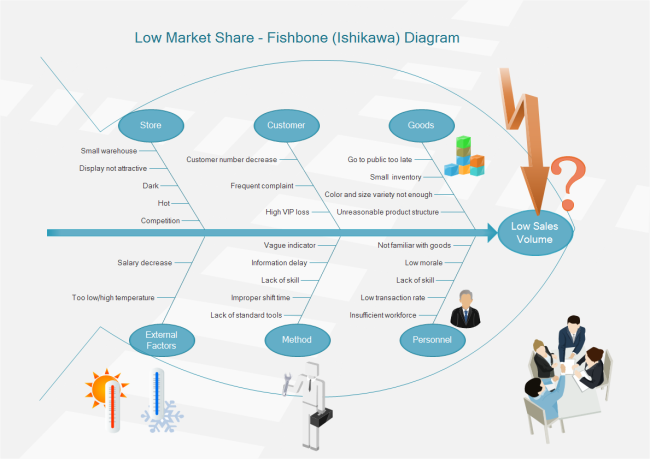
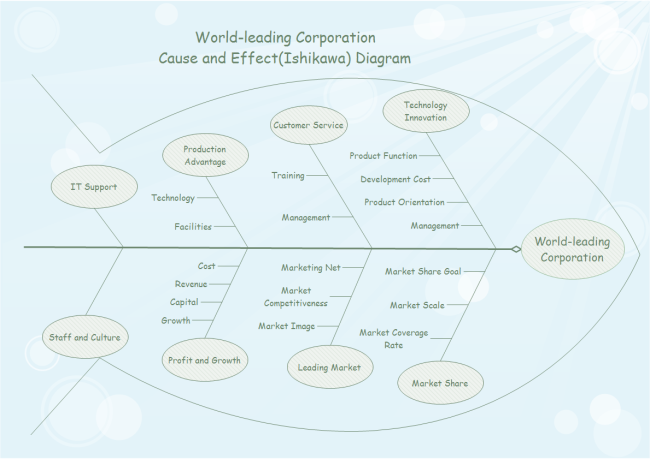
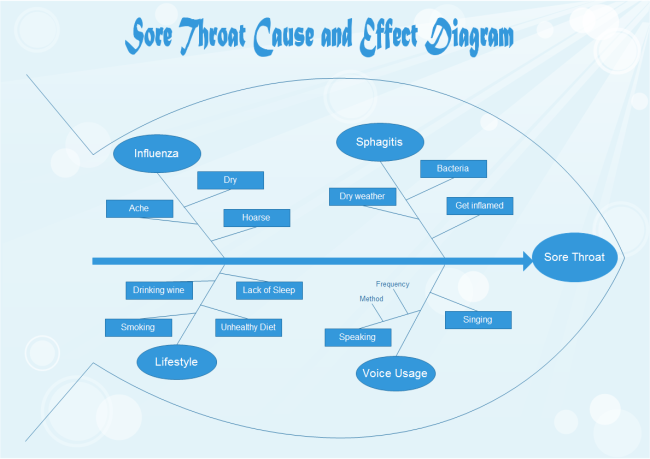
More Fishbone Diagram Examples


More Related Articles


