Decision Tree for Decision Making
While working in a company, there are instances where, as an administrator or holding any other leading position, you are required to make decisions based on the statistics that you have. Likewise, there might be other situations where you don’t have access to much of the data, and you must depend on your predictions based on the little information that has been provided to you. This is where a decision tree comes into play.
With that being said, the following sections talk about what a decision tree is, what its benefits are, how to draw one, and what are some best practices that you may want to follow while drawing such a chart.
Part 1: What is a Decision Tree?
In layman’s language, a decision tree is a graphical diagram that is used to predict an outcome using the Boolean (Yes or No) method. These outputs are based on the type of inputs you add to the illustration. In other words, if you have some data or statistics, you can use that information as an input while preparing a decision tree and can easily predict what output you can expect if you prefer taking one route of the solution over the other.
Part 2: Purpose and Benefit of Decision Trees
The purpose of a decision tree is to assess the outcome based on the type of decision you make. Because a typical decision tree may have multiple conditions, and each condition may end up giving you an entirely different result altogether, you get to know which approach you should take in the best interest of the company you are working for.
The major advantage of preparing a decision tree is that you can avoid many mishaps with the help of the predictions that it comes up with. For instance, with a decision tree, you can know that trying a particular medicine on a patient may make the case critical while using a different medication could heal them.
Learn abouthow to perform a situation analysis.
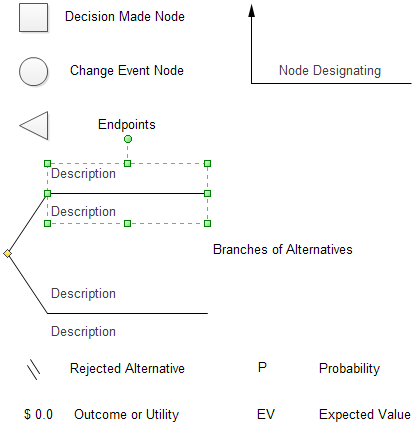
Part 3: Decision Tree Symbols
Decision tree has a set of standard graphic symbols and conventions for describing elements. Commonly used decision tree symbols include decision-making nodes, chance event nodes, endpoints, branches, and double-hatch marks.
Part 4: What to Do before Creating a Decision Tree?
As you might have noticed, with too few icons, it’s simple to prepare a decision tree. However, there are a few ingredients that are still needed before you start with the creation process. These elements are listed below:
- Data or Statistics
- Understanding of Symbols
- Diagramming Tool
As mentioned earlier, a decision tree is based on the inputs that you add to the diagram. Therefore, it is imperative to collect as much data as you can to feed the chart. This will help you predict the outcome accurately. The more information a decision tree has, the more precise the outcome will be. It is also noteworthy that a decision tree can have multiple inputs.
It is essential to have a thorough understanding of most, if not all, symbols and icons involved in a decision tree. With the correct use of shapes, your chart will become easy to read and understand not only by you but also by the senior authorities of the organization.
Although the decision trees can be prepared manually on a piece of paper, using an efficient tool like EdrawMax by Wondershare makes your chart creation task pretty simple. With the pre-built libraries populated with the relevant shapes and icons, you can save a decent amount of time that you would otherwise have to spend drawing them individually from scratch.

An all-in-one platform for 210+ diagrams.
・ Simple alternative to Visio
・ 26k+ symbols
・ 10K+ free templates
・ 10+ AI diagram generators


Part 5: How to Create a Decision Tree?
EdrawMax is a dedicated diagramming tool that is populated with several industry-specific categories. These industry types include Buildings and Constructions, Software Development, Organizational Chart, Mind Mapping, Flowchart, and many more. When you choose an industry to start with, a relevant built-in library with all the related shapes and icons gets loaded along with the template.
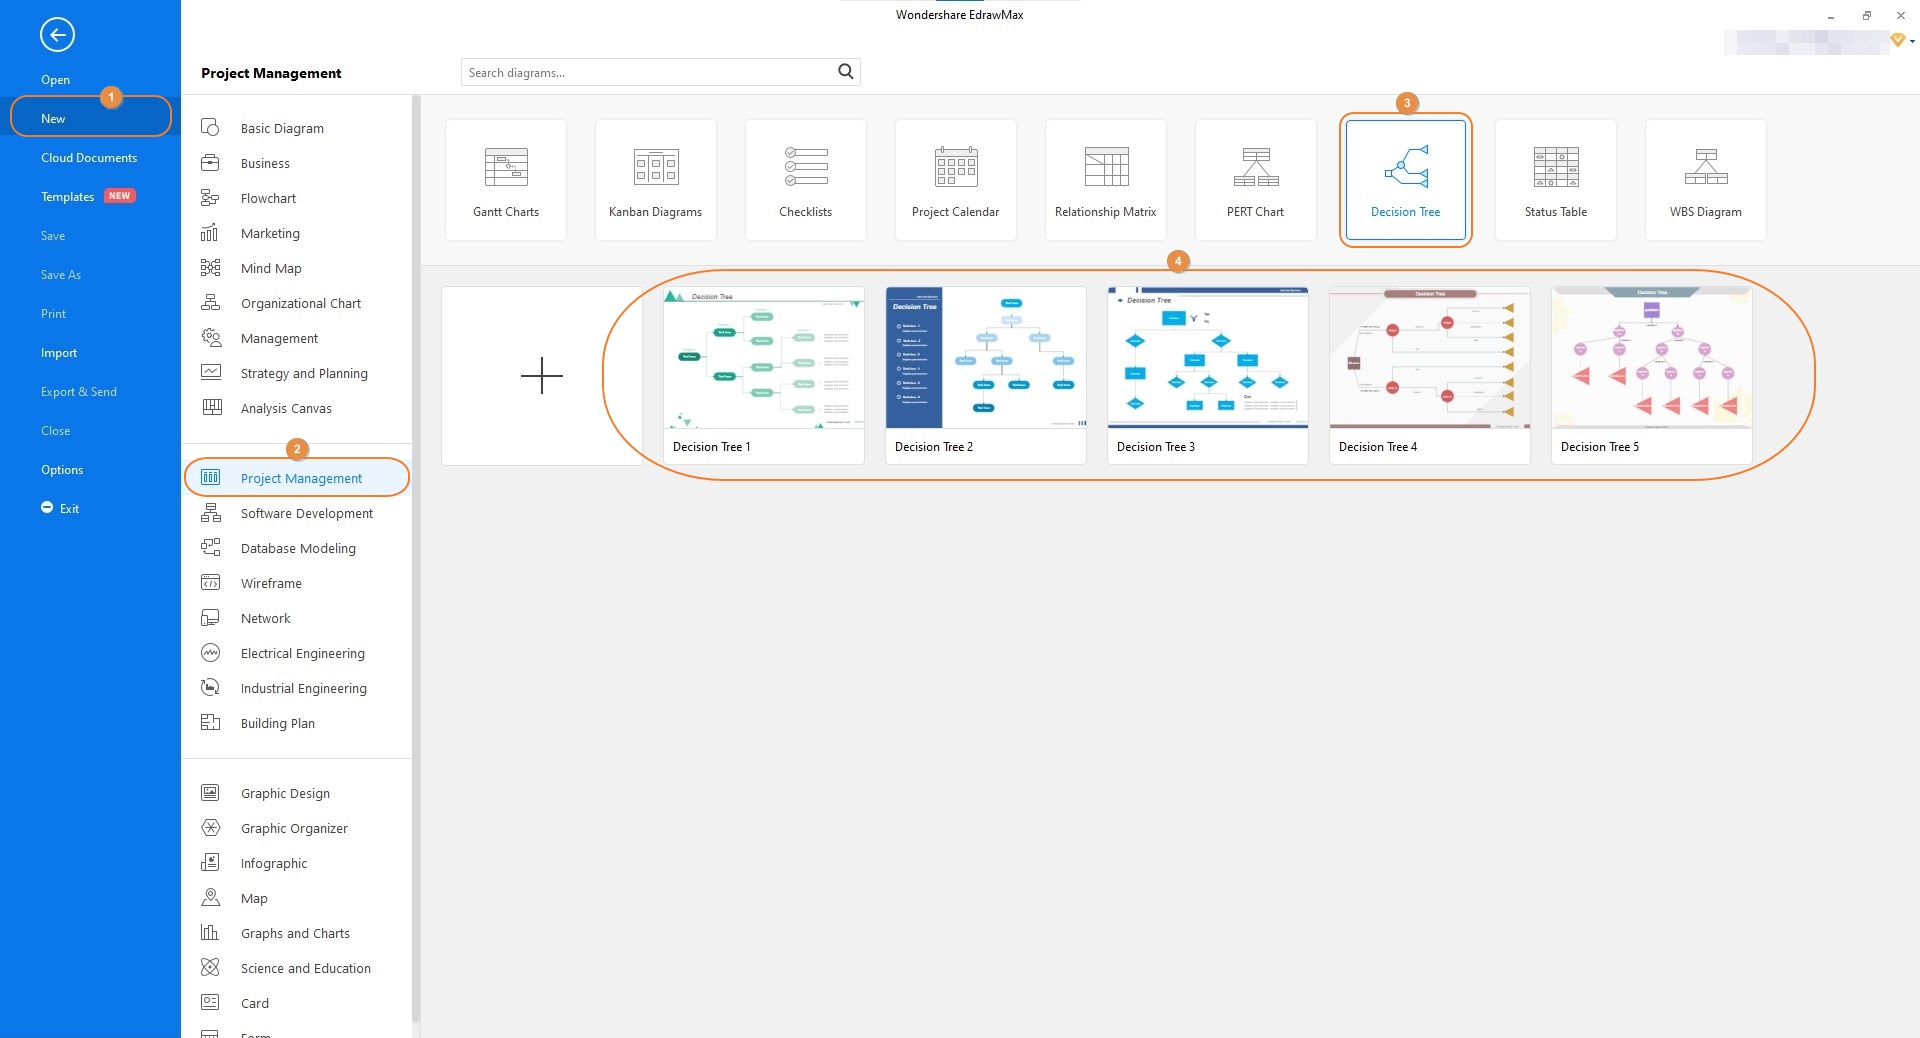
Step 1: Pick a decision tree template
After downloading and installing EdrawMax on your PC (a Windows 10 computer here), launch the program and sign in with your Wondershare account. Next, make sure that New is selected in the navigation bar at the left, click to select Project Management from the center pane, and then click Decision Tree from the upper row of the right window. From the lower section, click the template that goes best with the scenario you are planning to prepare a decision tree for.
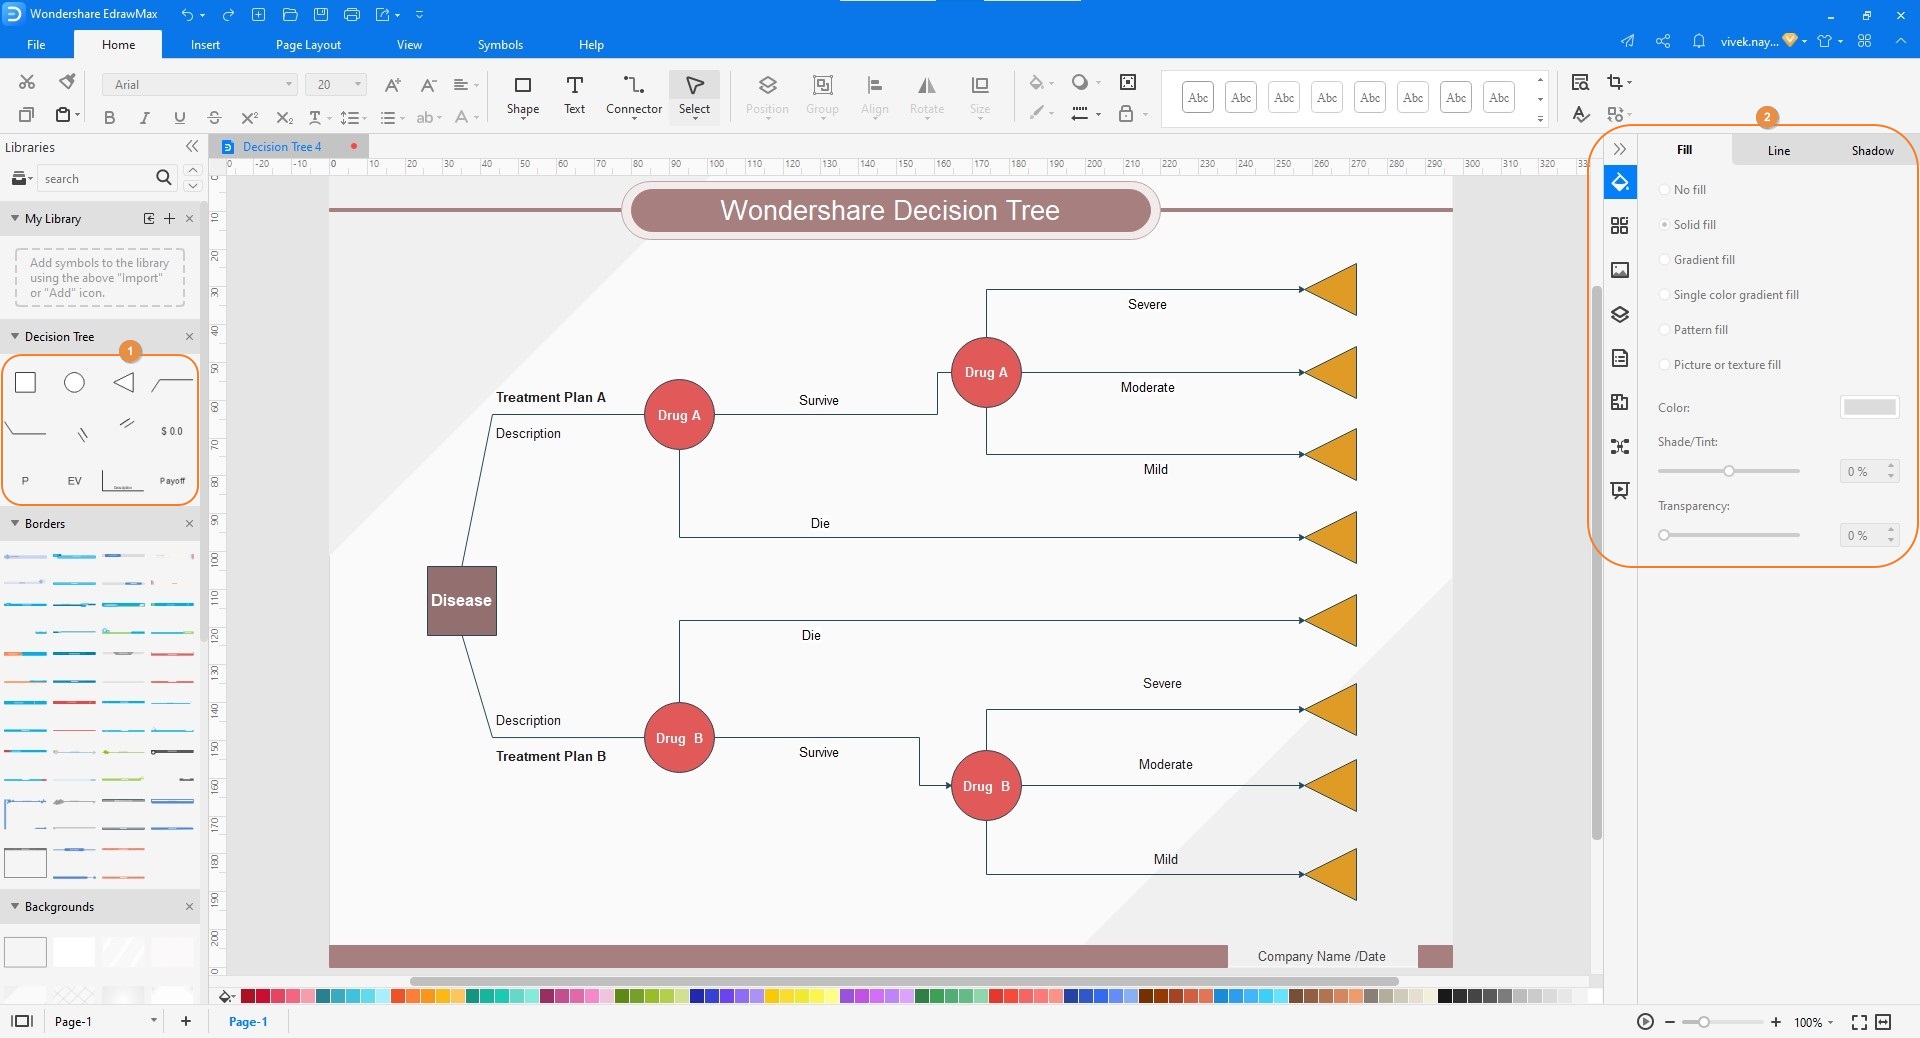
Step 2: Customize the template
Double-click the first shape on the canvas, and replace its caption with the one that you find fit according to the scenario. Repeat this process for all the shapes that the diagram has. If need be, drag more icons from the [Decision Tree] library at the left to the canvas, and use the tools in the right pane to decorate/format the symbols to allow them to gel with the existing theme. Make sure to populate all the other fields and replace the captions with the relevant values and text respectively.
Step 3: Save and export the decision tree
Once you are done preparing the decision tree, click the Save button from the Quick Access toolbar at the top-left corner of the interface. To export, click the More button on the Export icon, and from the available options, choose your preferred format to export the chart to.
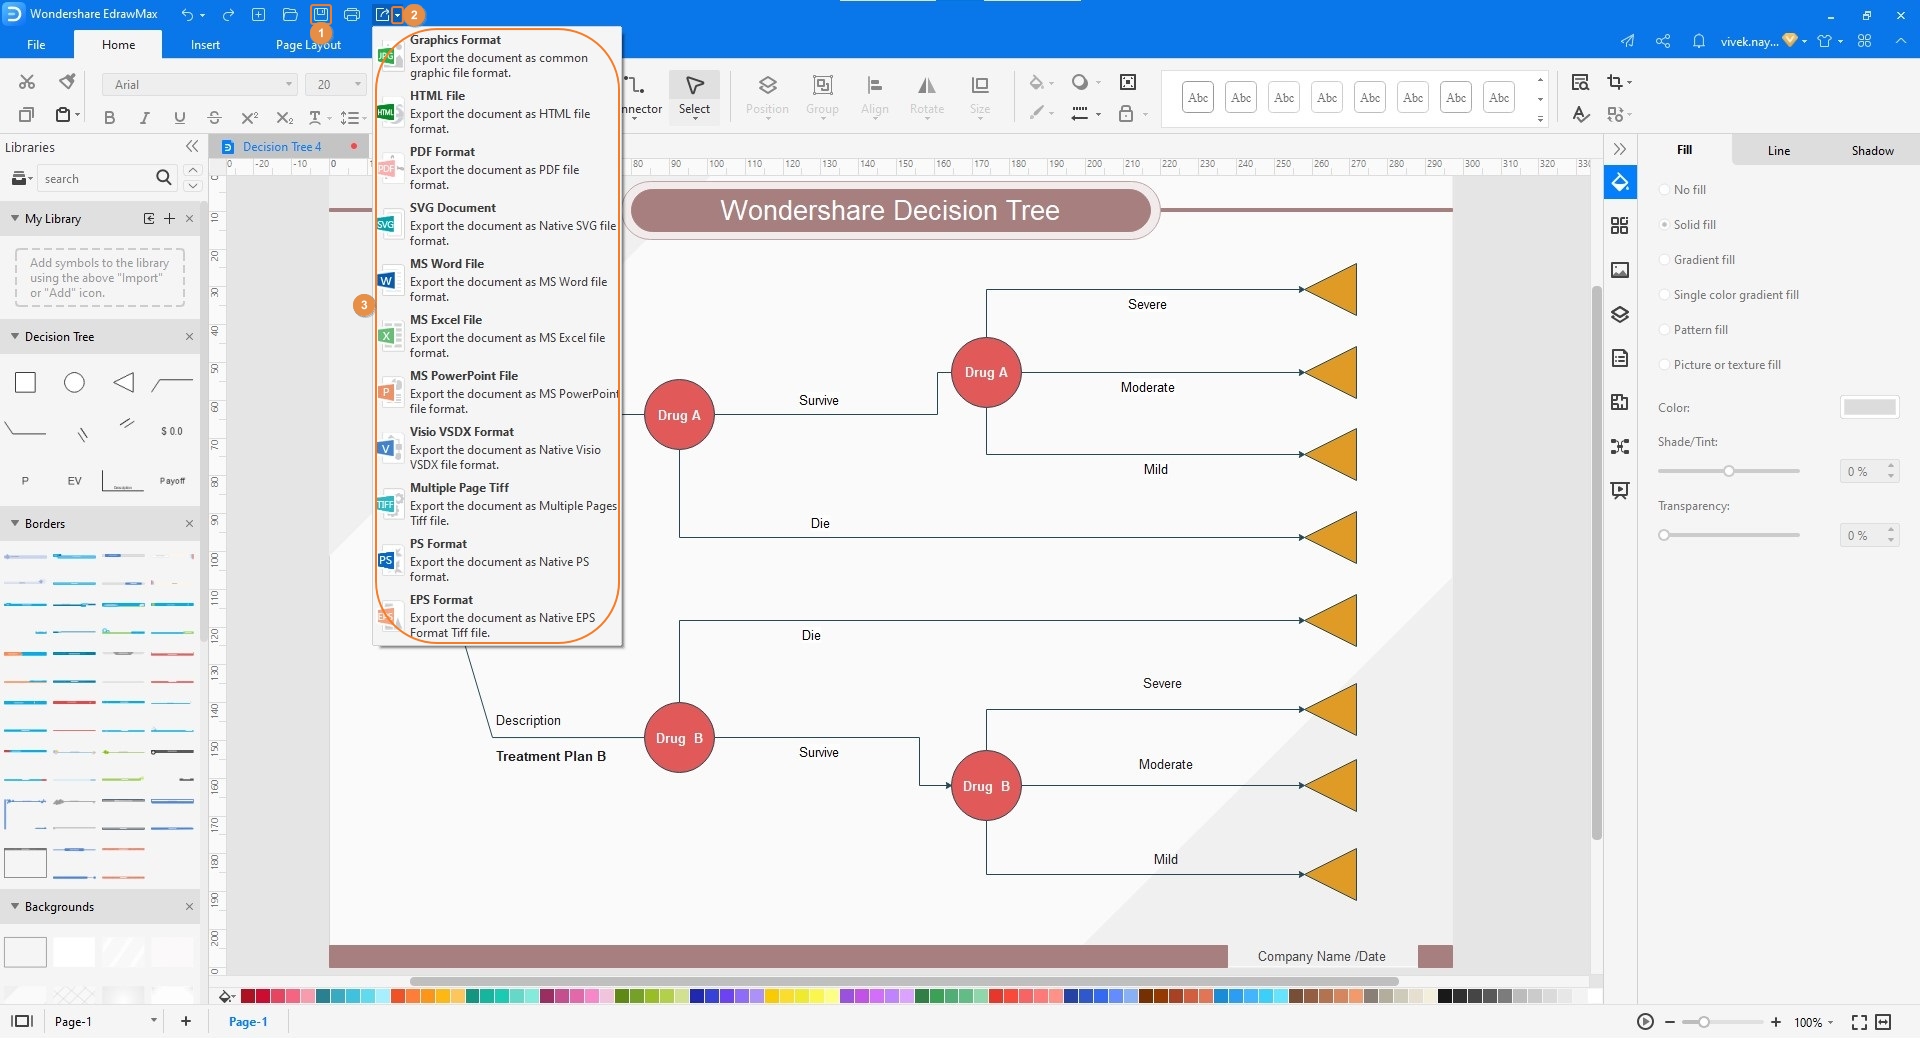
Once you are done preparing the decision tree, click the Save button from the Quick Access toolbar at the top-left corner of the interface. To export, click the More button on the Export icon, and from the available options, choose your preferred format to export the chart to.
Part 6: Tips for Making Decision Trees
Despite being pretty simple to draw, there are the following few tips that you may want to keep in mind while creating a decision tree:
- Avoid adding too many inputs in a single diagram. With several inputs, it would be challenging to predict the correct output
- Use consistent colors throughout the chart to make it look professional and easily understandable
- Avoid adding the icons and shapes in close proximity with each other to ensure that the decision tree does not get congested
- Use an efficient tool like Wondershare EdrawMax to prepare decision trees in order to expedite the creation process
You can learn more details anout creating great decision trees
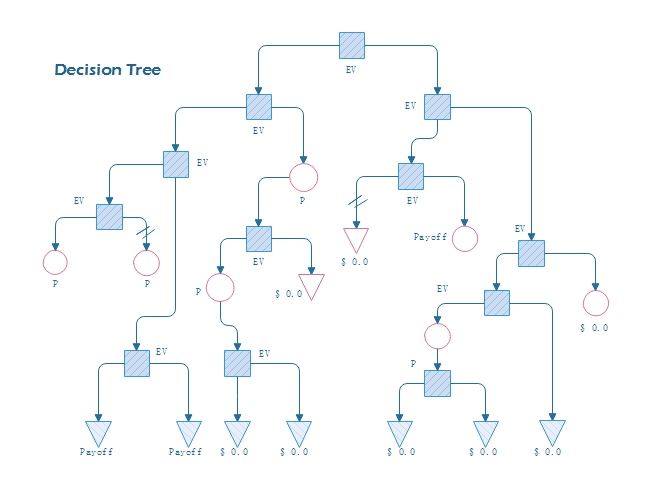
Part 7: Decision Tree Examples
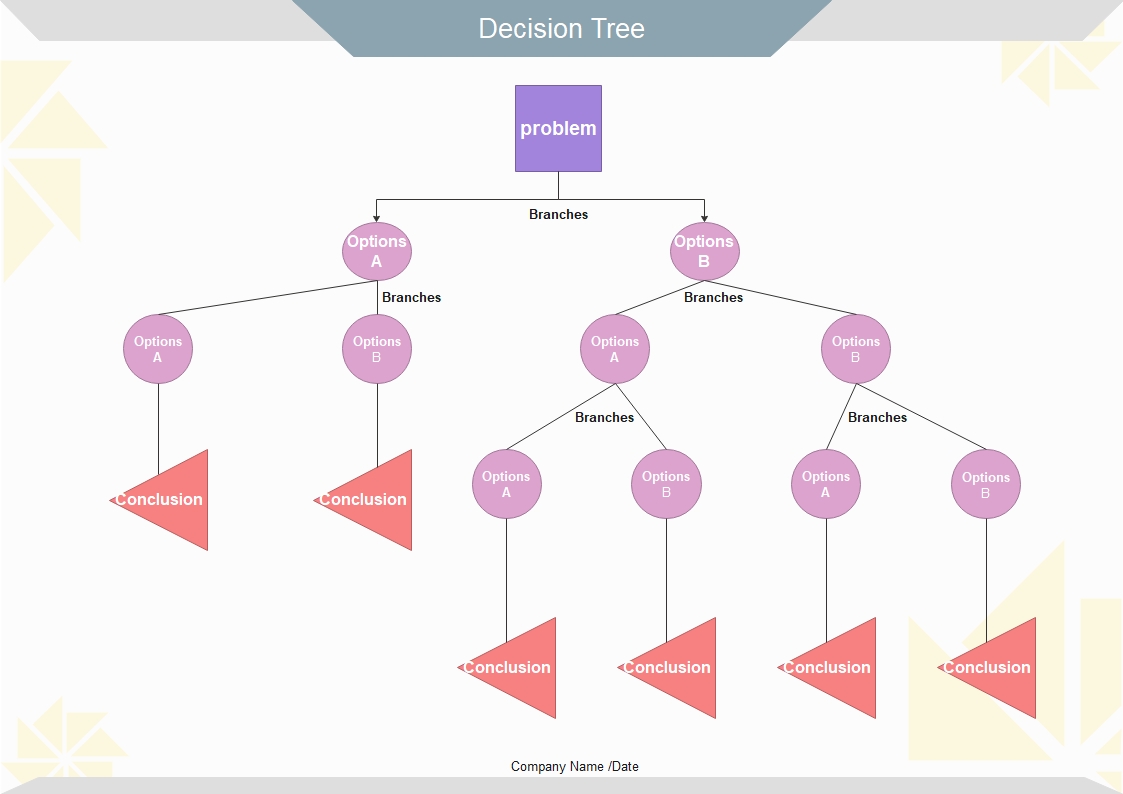
In this decision tree example, there is a problem (represented by a Decision Made Node). This problem has two possible solutions (represented by their corresponding Chance Event Nodes). You can notice that each of the solutions has its own tree of results ending with the possible conclusion (represented by Endpoints). With this type of visual chart, it becomes extremely easy to pick a resolution based on what outcome you could expect.
Conclusion
A decision tree plays a vital role when you are required to make a decision that depends upon the past statistics or the data that has been provided to you. While the entire tree works on the Boolean method, adding too many conditions to the chart may make it challenging to predict an accurate output. Furthermore, it is imperative to use an efficient decision tree maker like EdrawMax to expedite and simply your illustration creation process.
More Related


