Unified Modelling Language (UML) Diagram
1: What is a Unified Modelling Language diagram?
Unified Modeling Language is a system’s blueprint comprising predefined semantics and notations for anything. In simple terms, it is visual representations of a system designed to forge common language that would be understood by system developers, stakeholders, business owners, etc.
Besides developing a coherent system framework, this tool also enables better development and analysis of system behaviors. It is an important tool for developers in that it gives them an effective way to make end-users aware of the system’s functioning without too much explanation needed.
UML diagram is an essential aspect in software development and business process documentation and can be sketched by following these two key principles.
- Forward Design – Involves creating sketches before coding the application. The better thing about using a forward design sketch is that you will have a better view of what you are set to design. It also highlights flows and probable adjustments before designing, thus allowing you to create a better system.
- Backward design – This is when a UML diagram is created just as a form of documentation, and it is done after the coding process is completed. This helps show different actors, roles, activities, and workflows involved in a system.
2: Purpose and benefit
According to OMG (Object Management Group), the core purposes of the UML diagram are:
a) Enabling the interoperability of object visual modeling tool which helps in advancing the state of the industry.
b) Availing analysis, design, and implementation tools to software developers, software engineers, and system architects, which are useful in business modeling, designing software-based systems, and other similar processes.
c) To help all actors involved in a system to be able to visualize and understand programming language.
d) Used to draft the system
e) Business analysis. It helps improve customer service by enabling analysts to analyze the business sales pathway.
This business process modeling tool comes with a ton of benefits which include:
a) Problem-solving
b) Easy to understand and use
c) It ensures everyone in the team is on the same page, which in turn improves productivity.
3: Types of UML Diagram
There are different kinds of the UML Model Diagram, which provides full support for creating object-oriented models (model: An abstraction of a modeled system that specifies the modeled system from a certain viewpoint and at a certain level of abstraction.) of complex software systems.
1、UML Use Case Diagrams
In the early stages of a development project, use use case diagrams (use case: In a use case diagram, a representation of a set of events that occurs when an actor uses a system to complete a process. Normally, a use case is a relatively large process, not an individual step or transaction.) to describe real-world activities and motivations. You can refine the diagrams in later stages to reflect user interface and design details.
2、UML Static Structure Diagrams
Use static structure diagrams (static structure diagram: A diagram that shows the static structure of a model; that is, the elements that exist (such as classes and types, the internal structure of the elements, and their relationships to each other.) to create conceptual diagrams that represent concepts from the real world and the relationships between them, or class diagrams that decompose a software system into its parts.
3、UML Package Diagrams
Use package (package: A grouping of model elements represented in the UML by a symbol that resembles a manila file folder. Each element in a system can be owned by only one package, and one package can be nested in another.) diagrams to group related elements in a system. One package can contain subordinate packages, diagrams or single elements.
4、UML Activity Diagrams
Use an activity diagram (activity diagram: A special case of a statechart diagram in which all of the states are action states and the transitions are triggered by the completion of actions in the source state.) to describe the internal behavior of a method and represent a flow driven by internally generated actions.
5、UML Statechart Diagrams
Use a statechart (statechart diagram: A representation of a state machine, attached to a class or method, that describes the response of the class to outside stimuli.) diagram to show the sequence of states an object goes through during its life.
6、UML Sequence Diagrams
Use a sequence diagram to show the actors or objects participating in an interaction and the events they generate arranged in a time sequence.
Sequence diagram: An interaction diagram that shows the objects participating in a particular interaction and the messages they exchange arranged in a time sequence.
Actor: In a use-case diagram, a representation of a role played by an outside object. One physical object, therefore, may be represented by several actors. A communicates relationship indicates how an actor participates in a use case.
Object: Information created in another application and imported, embedded, or linked in a Visio drawing. The term object is used to refer to objects from other applications and OLE objects.
Event: An occurrence in Visio, such as a change to a shape formula or the deletion of a page.
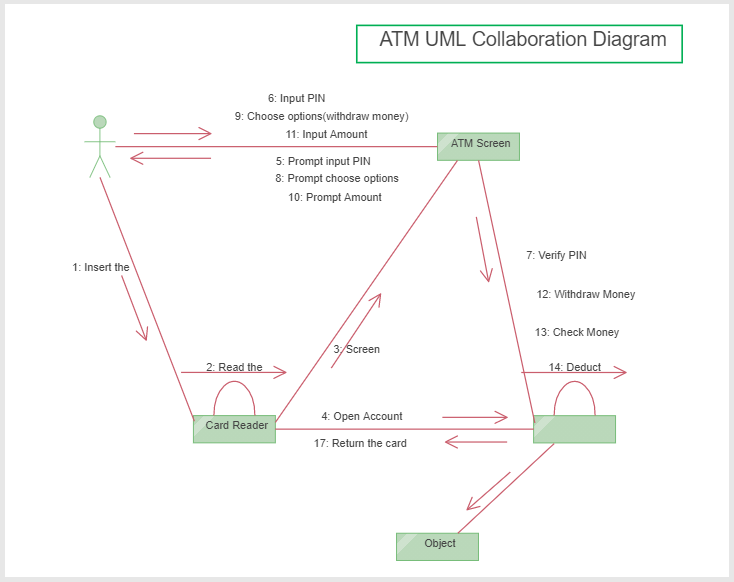
7、UML Collaboration Diagram
Use a collaboration diagram (collaboration diagram: An interaction diagram that shows, for one system event described by one use case, how a group of objects collaborate with one another.) to show relationships among object roles such as the set of messages exchanged among the objects to achieve an operation or result.
8、UML Component Diagrams
Use a component diagram (component diagram: An implementation diagram that shows the structure of the code itself. From a component diagram, you can learn about compiler and run-time dependencies between software components, such as source code files or DLLs.) to partition a system into cohesive components and show the structure of the code itself.
9、UML Deployment Diagrams
Use a deployment diagram (deployment diagram: An implementation diagram that shows the structure of a run-time system. From it, you can learn about the physical relationships among software and hardware components and the distribution of components to processing nodes.) to show the structure of the run-time system and communicate how the hardware and software elements that make up an application will be configured and deployed.
Based on current UML standards, there are 13 different types of UML diagrams but categorized into two distinct groups – Structural diagrams and behavioral/interaction diagrams.
- Structural UML Diagrams
- Class diagram
- Object diagram
- Deployment diagram
- Package diagram
- Composite structure diagram
- Component diagram
- Behavioral UML Diagrams
- Activity diagram
- State diagram
- Timing diagram
- Sequence diagram
- Interaction overview diagram
- Communication diagram
- Use case diagram
4: How to create a UML diagram in EdrawMax
Creating a professional UML diagram is important, and to create one, you will need an advanced UML diagram maker, such as EdrawMax software or a web-based application.
In this section, we will share with you four simple steps on how to create UML diagrams using EdrawMax. So, keep reading.
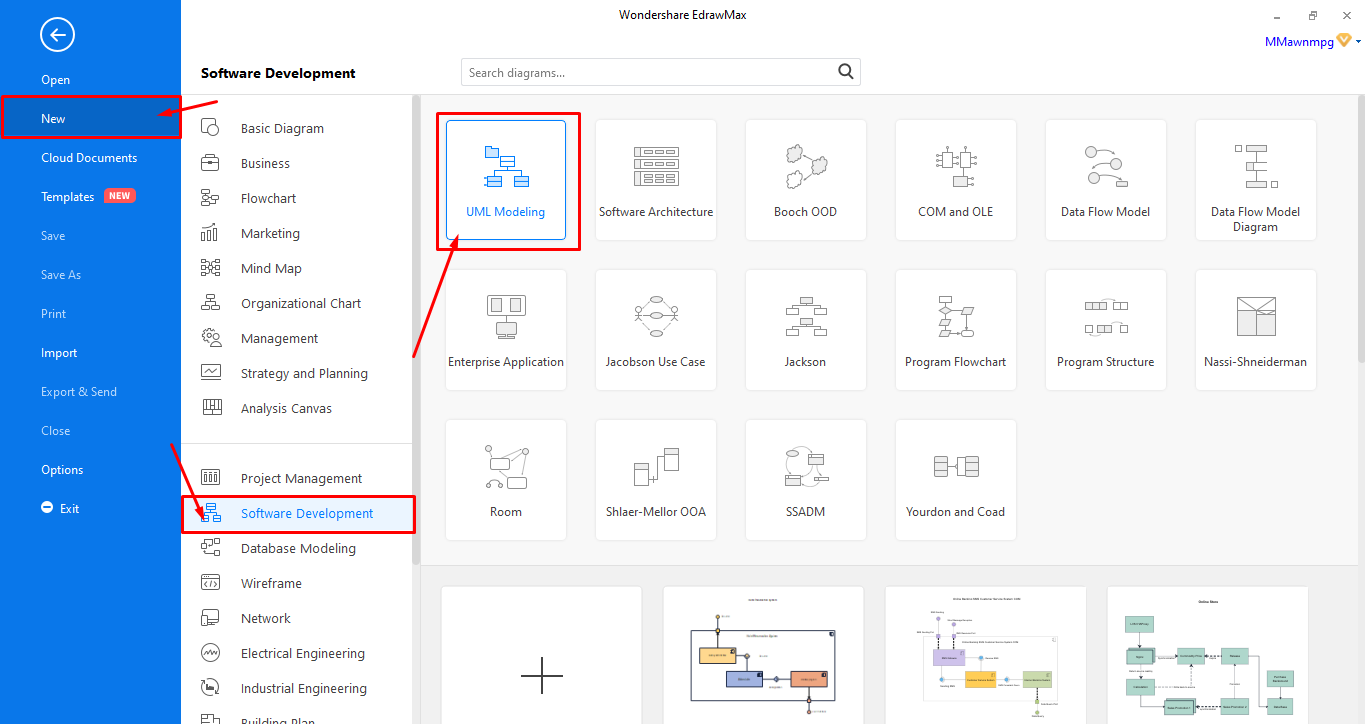
Step 1: Open EdrawMax Software
Open the software then go to File menu then click on [New] > [Software development] > [UML Modeling]. Let it load and after that, proceed to step 2.
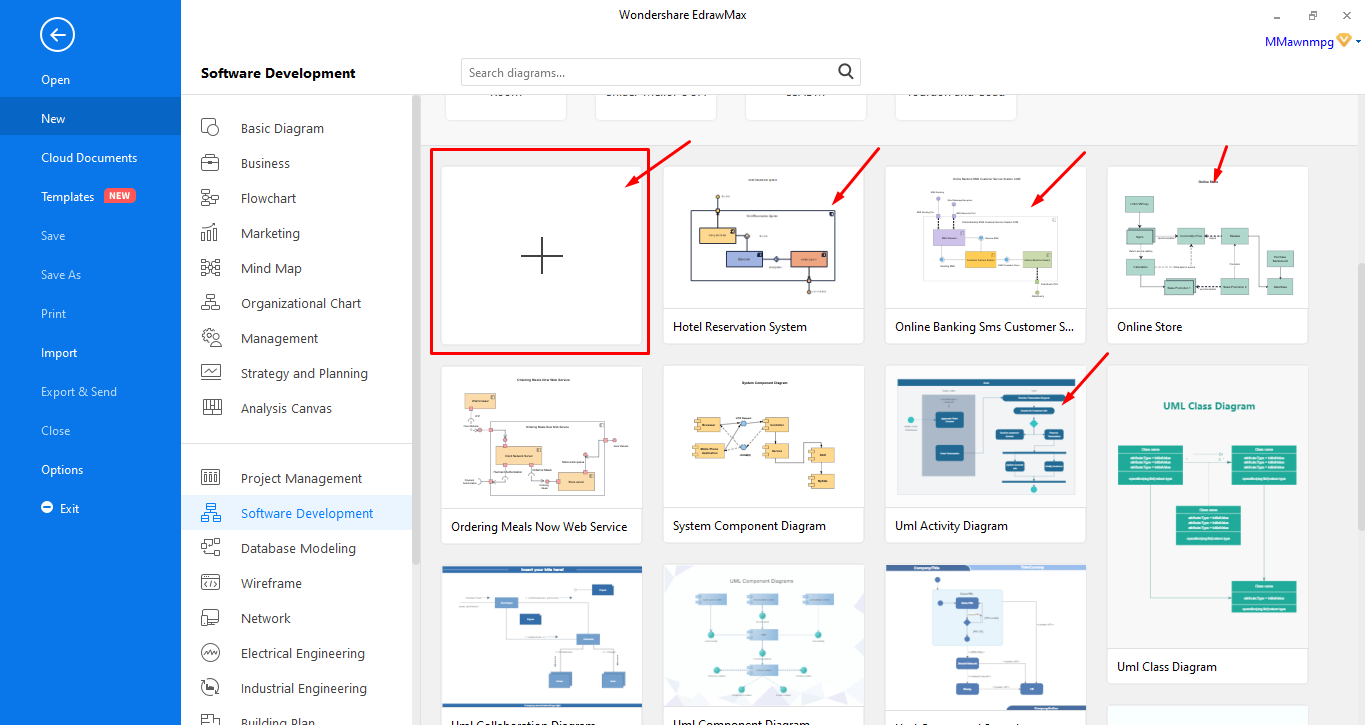
Step 2: Create from scratch or Select and edit a template
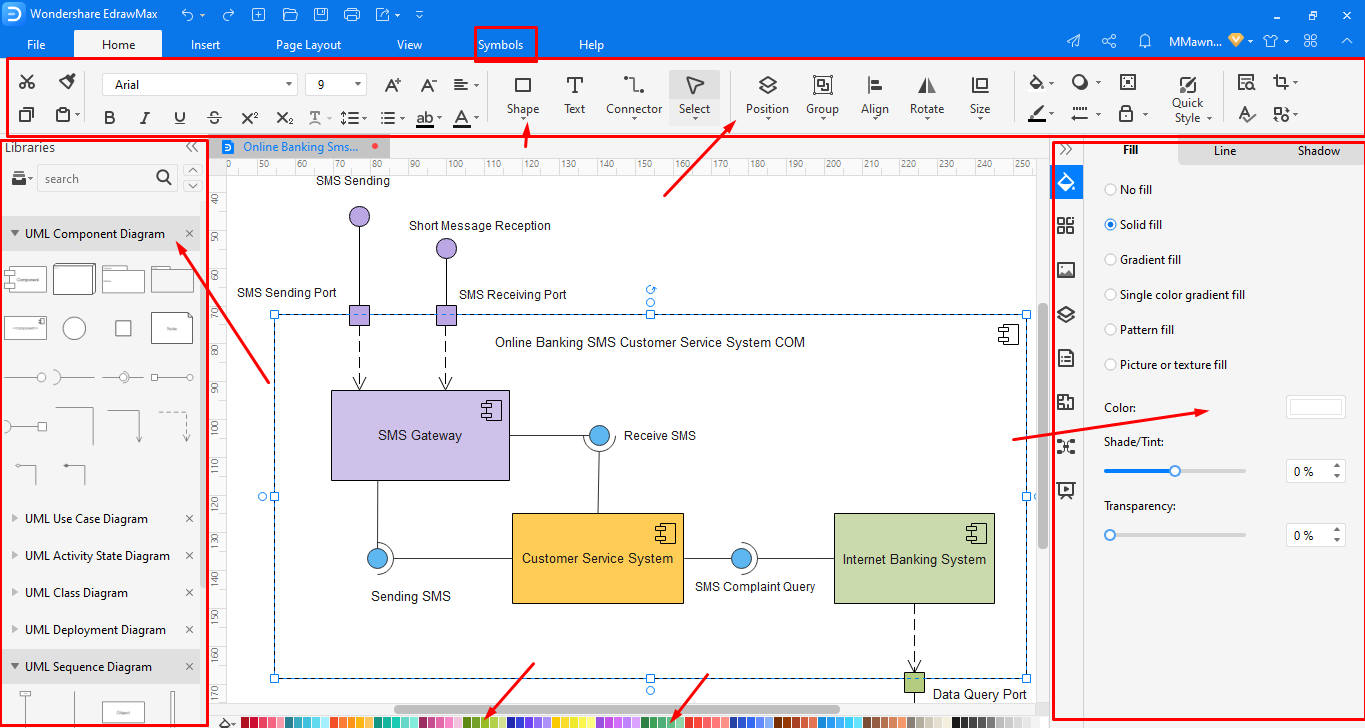
Step 3: Designing or Editing your Diagram
This vital step is to create a UML diagram since it involves an actual designing process that may seem complicated but, trust me; it’s quite simple than you think.
If you’re creating one from scratch, you should:
- Start by adding UML components diagrams by simply dragging and dropping
- Align or group the shapes you have added to your board
- Connect the shapes using the Object relationship symbols
- Edit the shapes’ text by double-clicking on them
- Do further editing like color, shapes, changing background, adding lines, etc.
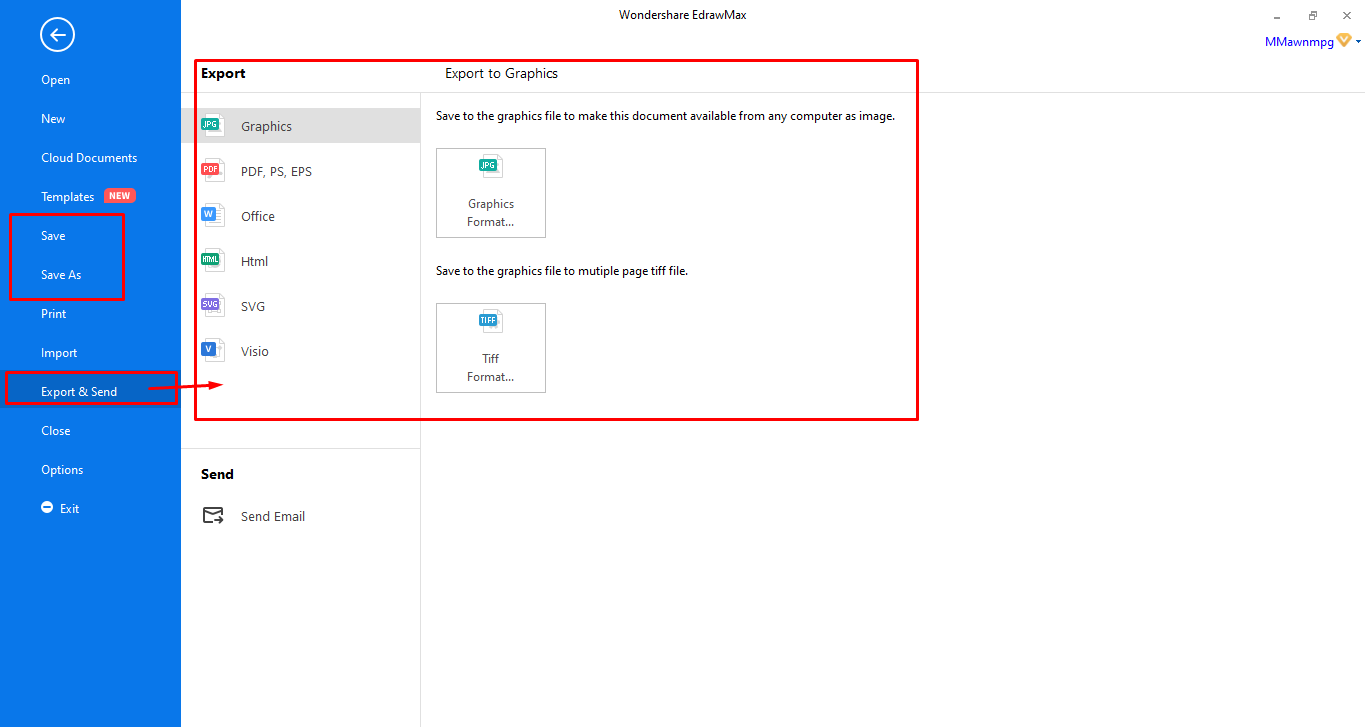
Step 4: Save, Export, or Share your designs
After you’re done with the editing process and satisfied with your edit, you can save, export, and share your complete UML diagram. EdrawMax allows you to export your file in different formats, including Visio, MS Office, PDF, and more.

An all-in-one platform for 210+ diagrams.
・ Simple alternative to Visio
・ 26k+ symbols
・ 10K+ free templates
・ 10+ AI diagram generators


5: Tips for Creating Effective UML Diagram
UML diagrams are designed to guide the design, analysis, and development of software while meeting the team’s priorities. Therefore, here are essential tips to help you design an effective UML diagram:
- Be concise: avoid using paragraphs of description and long names when adding text to your design.
- Utilize colors or notes to highlight important features
- Arrange all elements of your diagram before drawing relationship lines to avoid crossing lines. However, if you can’t avoid that, then it is advisable to use a “Bridge.”
- Maintain the relevant level of abstraction in your diagram depending on who is expected to use or analyze the diagrams. This is simply because, for developers, you will need a more detailed diagram to work with, but a pig-picture-oriented diagram is suitable for management.
- Ensure your diagram has a nice visual boundary to allow clear labeling
6: ATM UML Diagram Example
Here is a UML Collaboration Diagram that shows how ATM machines work. This ATM UML Collaboration Diagram clearly determines class responsibilities and interfaces, just as shown in the diagram below. Since the system itself is based on object-oriented programming, this diagram help depicts the architecture of the object residing in the system and how they work.
Read Also:


