Entity Relationship Diagram (ERD)
- Part 1: What Is An Entity Relationship Diagram?
- Part 2: History Of Entity Relationship Diagrams
- Part 3: Usage of an ER Diagram
- Part 4: Benefits of Entity Relationship Diagram
- Part 5: Symbols and Notations of Entity Relationship Diagram
- Part 6: How to Create an ERD?
- Part 7: Example of Entity Relationship Diagram
Part 1: What Is An Entity Relationship Diagram?
As we have briefly mentioned, ER diagrams play an important role in making and designing databases. It is kind of a flowchart that describes how all the entities within a system are relating with one another – with the help of a visual representation. For example, telling the relationship and connection between people, concepts, and things.
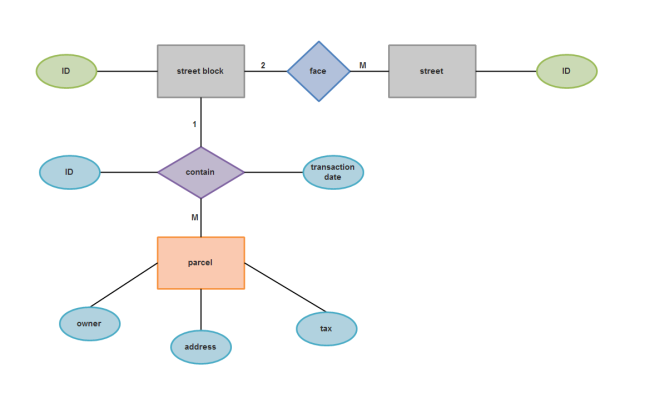
All the ER Diagrams are made with the help of different symbols to describe the entities; rectangles, squares, ovals, diamonds, and arrows. Also, an ER diagram has its own grammatical structure – it considers entities as a noun and their relations as verbs. Here is a basic structure of an Entity Relationship Diagram:
Part 2: History Of Entity Relationship Diagrams
ERD Models are in this world since the late 1970s when people realized how crucial and necessary data modeling is. There were tons of models introduced before, but none of them were considered efficient in terms of adaptability.
Peter Chen, who was an assistant professor at MIT’s Sloan School of Management in 1970, is the pioneer of creating an ERD Model. He introduced the concept in his research paper, “The Entity-Relationship Model-Toward a Unified View of Data”, and introduced the world with a visual representation of databases.
He named his initial model as Bachman Diagrams – after being inspired by the data structure diagrams of the American Computer Scientist, Charles Bachman.
Part 3: Usage of an ER Diagram
Though we generally know that ER Diagrams are used for database, still, let us get into more details of how and when you can use them to model your systems:
Using ERD for Database Design
ER Diagrams are widely used to design databases and show the relation between their entities by putting them in tables. Also, ERD helps you to conveniently identify all the mistakes and flaws and make corrections – that is why it is the most effective tool for database design.
Using ERD for Database Design
ER diagram is also extremely helpful in database troubleshooting – as it is a visual representation, you can easily notice where you went wrong, why you went wrong, and make the corrections immediately.
Using ERD for Software Engineering
The entity Relationship Diagram is an extremely helpful tool for engineers when they are at the initial stages of their software project. It helps them plan properly by identifying the relationship between all the data system elements.
Part 4: Advantages and Disadvantages of Entity Relationship Diagram
Advantages
- A Visual Representation
- Productive Communication
- Easy to Make and Understand
The most notable benefit of an ERD is that it shows you all the information and relation in the form of a visual representation. This visual representation and data flow diagrams make it easy for individuals to understand and study the flow of data conveniently.
All the data in an ERD is listed under proper and relative headings, subheadings, and tables. All these things along with the symbols and shapes combined allow the user to have a convenient and proper understanding of the information.
Drawing an ERD isn’t rocket science; one can conveniently make an ER diagram after fully understanding all the rules, terms, and concepts. Also, if you are an expert designer, the process would become a whole lot easier for you.
Disadvantages
- Limited to Relational Data
- Limited to Structured Data
- Troublesome if using for an Existing Database
Entity-relationship diagrams are only limited to relational data and tasks – which means you can only use them to show relationships between data and portraying their relational structure.
If you are planning to use ERD for unstructured or semi-structured data, you should know that you can not. ER Diagrams only for the data that is properly structured, and classified in their respective rows and columns.
Using Entity Relationship Diagrams for an existing database can cause a lot of trouble and difficulties. Every database has its own architecture – that is why it is important to use ERD for a new database only.
Part 5: Symbols and Notations of Entity Relationship Diagram
To fully understand the symbols and notations of an ERD, you need to understand its components; Entity, Relationship, and Attributes. Then, these components have sub-components like weak entity, multivalued attribute, and weak relationship: Here are the symbols of each element:
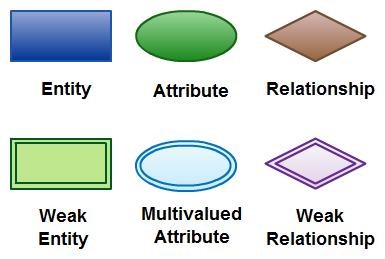
Entity: Entity can be any singular noun – a place, object, person, or anything. For example, the name of an educational institute, the name of an individual, subjects, fees, etc.
Weak Entity: A weak entity is a piece of information driven from an already existing entity. In short, a weak entity depends on the main entity. Here is an example:

Attribute: An attribute is basically a characteristic, trait, and relationship that defines an entity. Here is an example:
Multivalued Attribute: If an attribute has further values and characteristics, then it is named as a multivalued attribute. Here’s how:

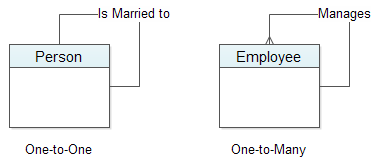
Relationship: As the name implies, this component defines the relationships between the entities, and how they interact with each other. Also, relationships are always written in the form of a verb. Here is an example:

Part 6: How to Create ERD
Want to know how to create an excellent and perfect diagram? Well, all you need to do is follow a few simple tips and practices. Let us go through those tips:
1. First of all, take a look at all the entities in your system and identify them. Make sure to put all the entities in rectangles and carefully name them.
2. Next, you need to figure out the relationship between all the entities. After identifying, connect the entities with lines and mention their relationship using a diamond symbol in between (writing the relation in the diamond).
3. Lastly, you need to add attributes for all the entities. Also, make sure you remember and understand later what names you are giving to those attributes.
4. Give meaningful and understandable names to all the entities and attributes. Also, make sure to use nouns for naming entities.
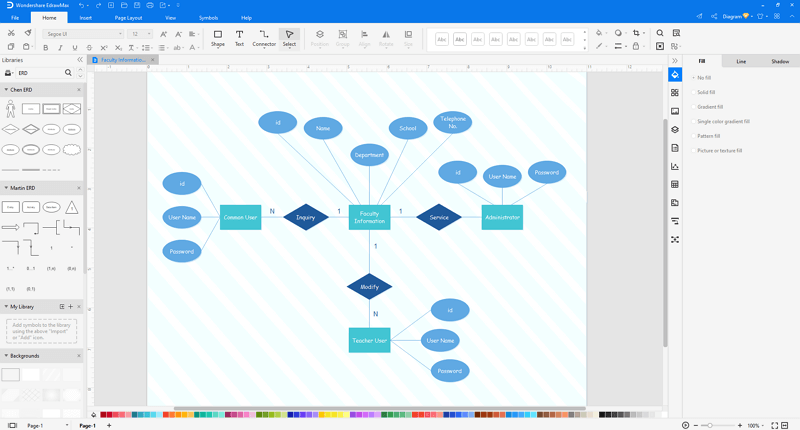
If you want to make a simple and easy entity-relationship diagram, you can draw it manually. However, if you are opting for a more complex and technical ER Diagram, it would be best to use an outstanding and efficient diagramming software – just like the EdrawMax! It is one of the best diagramming software available right now, with tons of flexible and beneficial features to offer!
Learn more about creating an ERD with EdrawMax
Additional Tips for ER Diagrams
Here are a few extra tips that will help you nail your entity relationship diagram:
- Always make sure that you are properly labeling all the entities and the relationships between them.
- Keep a close eye on any redundancy or repetition of entities and relationships.
- Keep in mind to always choose the right detail level for your ERD – from conceptual to logical to physical, each has its own purpose.

An all-in-one platform for 210+ diagrams.
・ Simple alternative to Visio
・ 26k+ symbols
・ 10K+ free templates
・ 10+ AI diagram generators


Part 7: Example of Entity Relationship Diagram
Here is an example and template of a perfectly designed and structured ER Diagram:
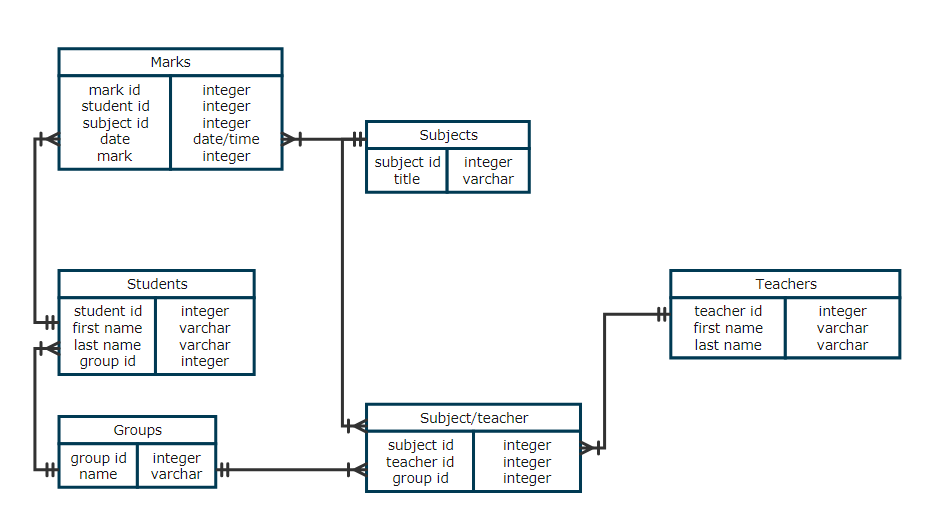
The diagram above perfectly describes the relationship between students, their subjects, their teachers, and their groups. The whole flowchart is fully structured and all the entities are assigned with understandable and sensible names.
Single Entity Relationship
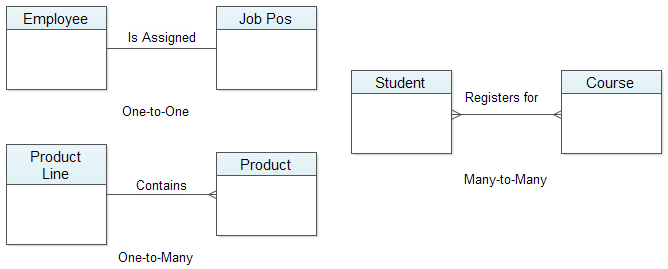
Binary Entity Relationship
Database for Business Order Process ERD
An entity relationship diagram showes a simple database for the business order process.
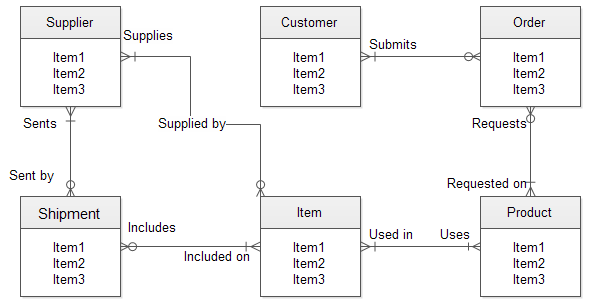
The entity relationship diagram shown in the above image contains six entities - supplier, customer, order, item, product and shipment. There are five kinds of relationship such as supplied by, requested on, used in, included on and sent by. In our example, every entity includes some attributes associated with each entity. In a real-world example, each one of these would likely have many different attributes.


