How to Create a Histogram Effortlessly
Part 1: What is a Histogram?
A histogram is used to show the distribution of numerical data. Data is grouped into ranges, and each range is represented by a bar. The height of the bar represents how many data values fall into that range.
Histograms are perfect for instances where continuous data needs analysis. For example, restaurants may use histograms to determine how many patrons enter their restaurants at different times of the day. It is useful for businesses looking to determine what a normal distribution looks like. Any anomalies can be spotted and dealt with quickly. Typically, a normal distribution would be shaped like a bell-curve. If there are any major spikes in that curve, businesses can capitalize on prioritizing more resources during that time period.
Part 2: How to Create a Histogram
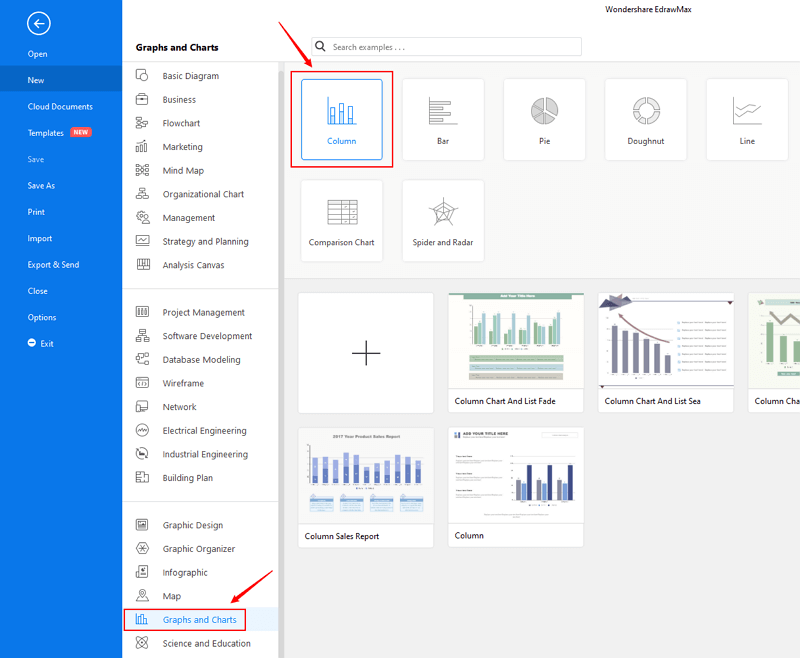
Step 1: Open EdrawMax from your computer, and navigate to [New] > [Graphs and Charts] > [Column].
Step 2.1: Choose a pre-made template from the template gallery and open it. You will see the chart on the canvas with a lot of editing tools on the top menus and right panes.
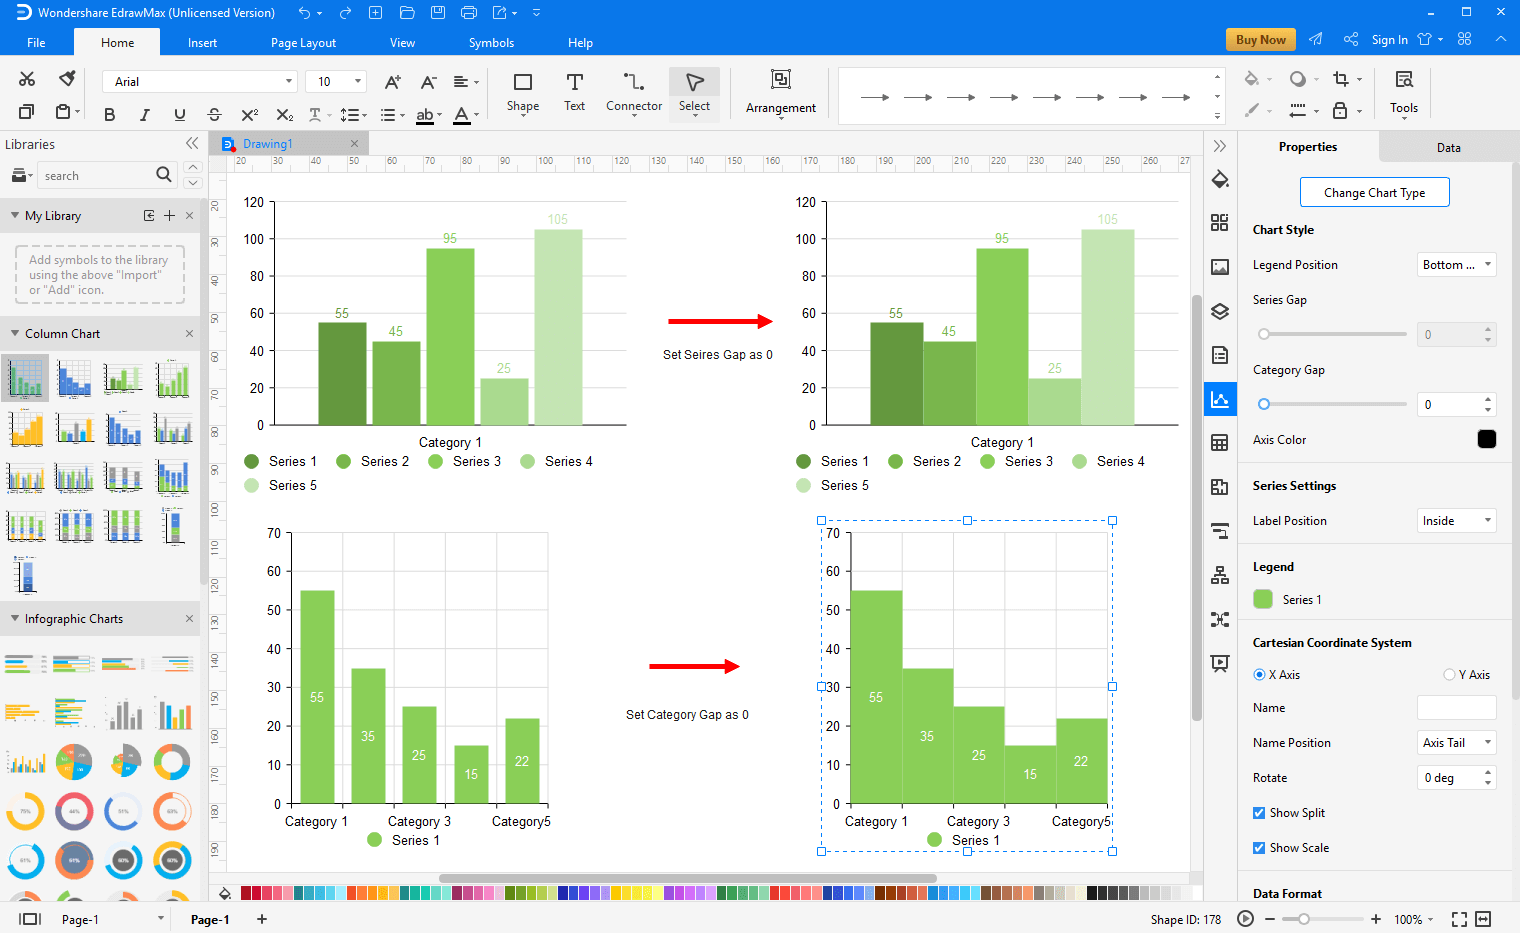
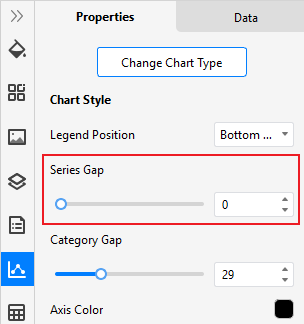
Step 2.2: After you open a blank column chart template or insert one on the canvas, you need to set the series gap or category gap as 0. So the bars will be adjacent.
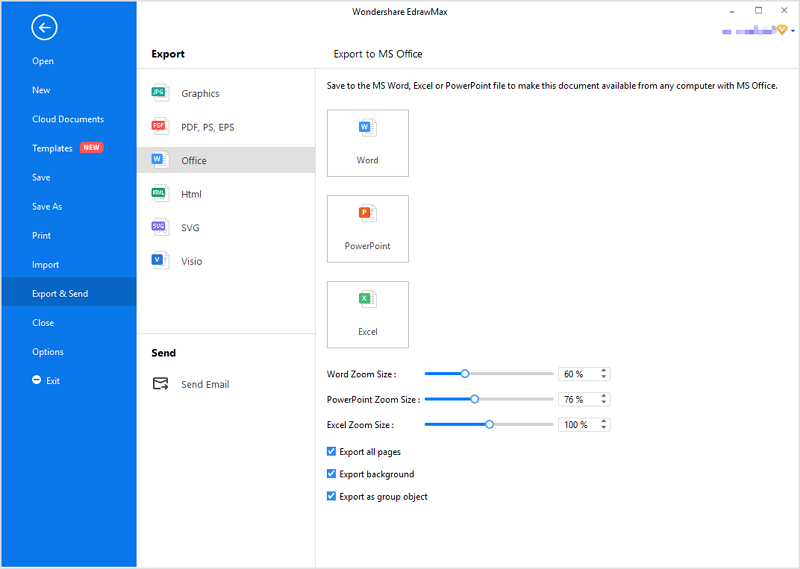
Step 3: When the histogram is finished, you are able to save and export the creation to graphics(JPG, PNG), PDF, editable MS Office file format, SVG and Visio vsdx file format.
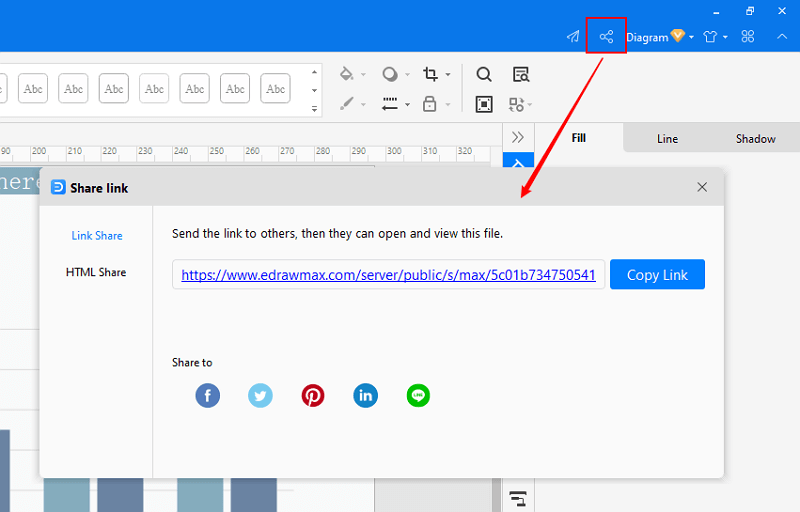
Step 4: Alternatively, you can share the chart via social media and sharing links. In addition, you can publish your diagram into EdrawMax's online template gallery.

An all-in-one platform for 210+ diagrams.
・ Simple alternative to Visio
・ 26k+ symbols
・ 10K+ free templates
・ 10+ AI diagram generators


Part 3: Histogram Examples
Example: Consumption Histogram

More Related


