How to Create an Exploding Pie Chart
Why Create Exploding Pie Charts
Exploding pie chart or exploded pie chart is a special type of pie chart. By exploding a certain slice, chart designer can highlight this slice. If all slices of the chart are exploded, the chart becomes more reader-friendly.
Pie Chart Subtypes
Pie charts are excellent for displaying data points as a percentage of the whole. It displays data as a pie, split and filled with color or patterns.
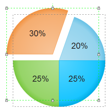
Pie and 100% percentage pie
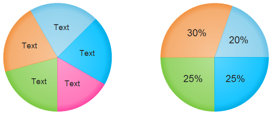
Exploded Pie
You can select a pie sub shape and move it to new position to make exploded pie chart.
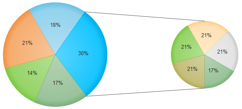
Multiple Pie
Pie charts are typically used for one group of data. However, you have the option to choose multiple pie charts for multiple groups of data. You can use Line Tool to draw connecting lines between pie and sub pie. Click Line Tool on Home tab to turn on Line Tool, draw the connect lines, finally click Select on Home tab to turn off Line Tool.
Steps to Create an Exploded Pie Chart
In Edraw, one exploded pie chart can be generated quickly without any hassle. You can explode the pie chart after you have created it. This is a very simple process that will take you just a few minutes but add a whole new look to your diagram. See how to do it below.
Things You'll Need
- Edraw pie chart maker.
- Neither pen nor paper is needed.
- No need to worry about drawing skill.
- Prior experience isn't required, either.
Instructions
Start Edraw and open an existing template that is suitable for showing from existing data you have collected. Drag and drop the template to the canvas.
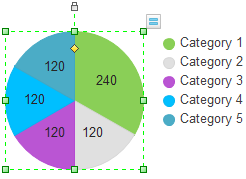
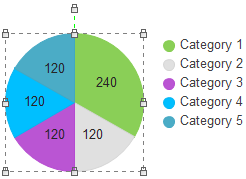
The chart is selected by default after you let go of the mouse button, with the floating action button shown at the upper right corner and the green selection handles around. Double click the data to replace it with your own content. Click the floating button to set relevant appearance options.

Set Fill Style
Select a category sub shape, change its fill style, and the new fill style will be applied to legend.
Add a Category
Click Add a Category on the floating menu.
Delete a Category
Hit Delete a Category, you can also select the category sub shape and press - Delete key to delete it.
Set Category Number
Click Set Category Number, insert the number you need. The minimum value is 1.
Set Series Number
Click Set Series Number on chart action menu, the minimum value is 1.
Explode a Slice
After you have created a pie chart and added the final touches, explode a certain slice by selecting it. You need to know how to select the whole shape and how to select the sub shape.
Click one time on the chart area to select the entire pie chart. You can tell the whole pie chart is selected when it is surrounded by square green points. A few seconds after the first click, the second click will select the sub shape.
|
Select the Whole Shape
|
Select One Slice
|
|
|
s
Click twice on the slice you want to separate. Hover your mouse over the slice that you want to explode. Your mouse cursor will turn into a 4-headed arrow.
Drag the slice outwards, away from the rest of the pie in the chart.
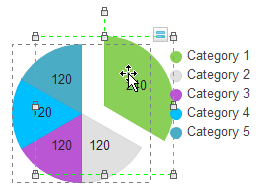
Release the mouse button. The pie chart will now be exploded with the moved slices of pie broken away from other parts.
Click and drag the individual pieces of pie to their new location if you would like to manually adjust the exploding pie chart pieces. Done. So simple and so easy.
Exploding Pie Chart - Advertising Channel

This exploded pie chart example is provided with refined appearance and quality content. It's available for anyone to download and use.
Exploded Pie Chart Template
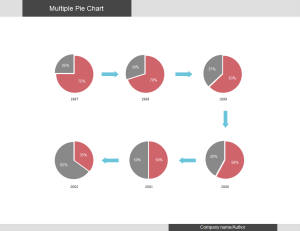
A multiple pie chart template is readily available in vector format allowing users to download and apply.
Links:
How to Create Calendar and Mark Event
How to Draw an Organizational Chart
Best Linux Pie Chart Software for Creating Pie Charts and Graphics


