What Is a Graphic Organizer?
Do You Want to Make Your Graphic Organizer?
EdrawMax specializes in diagramming and visualizing. Learn from this article to know everything about graphic organizer and create your own with ease. Just try it free now!
A graphic organizer visually depicts relationships between facts, concepts, or ideas. You can easily find it in school because it is a pedagogical tool to provide a visual aid to facilitate learning and instruction. Teachers often use graphic organizers to illustrate complicated concepts to understand them, while students use excellent means to organize their thoughts, especially in writing. Read this article to learn the definition, uses, advantages of graphic organizers, and get inspired by beautiful graphic organizer templates.
Part 1: What is a Graphic Organizer?
In learning what a graphic organizer is, you will discover a visual learning tool that conveys the relationship between multiple factors such as ideas, concepts, and facts and hence guides your thinking.
Since it is a pedagogical tool that facilitates instructions and learning, it may be common in schools. Teachers use graphic organizers to teach complex concepts, making it easier for students to organize their thoughts. Learners with learning disabilities benefit most from these tools because they are visual thinkers and learners. They tend to remember information better when incorporated in maps, charts, pictures, and diagrams.
Therefore, you should consider graphic organizers because they help visualize and construct ideas, brainstorm, organize sequence information, and compare and contrast ideas. You should use these tools when:
- Brainstorming ideas before assignments.
- Comparing and contrasting two or three concepts.
- Gathering new information.
- Reading a novel/book.
- Helping students in classifying further information into meaningful categories.
- Helping learners group differences and similarities.
Advantages of Graphic Organizers
As useful and easy tools that can visualize and organize information, graphic organizers are often used as prompts for students to construct ideas, organize and sequence information, plan what to write, increase reading comprehension, brainstorm, organize problems and solutions, compare and contrast ideas, show cause and effect, and more. What the students need to do in most cases is to fill in the blanks. The ability to color-code thoughts in a picture can help significantly in understanding and remembering the information. Graphic organizers benefit students who use them in the following aspects:
- Help students structure the writing project.
- Encourage students to judge the pros and cons of making decisions.
- Generate, classify ideas easily, and communicate in brainstorm.
- Examine relationships.
- Guide students to demonstrate their thinking process.
- Increase reading comprehension
- Organize and compare essential concepts and ideas.
- Sequence and break a story into the main elements (intro, rising action, climax, and more).
Disadvantages of Graphic Organizer
- Students Get Lazy on Note Taking: As has shown above, graphic organizers make it easy and clear for students to organize concepts and ideas with appropriate structure. In this case, some students may simplify literal note-taking to just a graphic organizer. However, the dearth of comprehensive and detailed knowledge guides might affect their performance in the exam.
- Lack of Prompt Feedback from Teachers: For young students, both making a graphic organizer and creating a sensible answer for the graphic organizer can be time-consuming. In a 40-minute class, young students will probably spend 30 minutes drawing the graphic organizer and 10 minutes filling the blanks. If that is the case, the teacher won't have enough time to check and correct a student's work upon completion, thus failing to send the student prompt and valuable feedback on his work.
Part 2: Types of Graphic Organizers (Keep Updating)
Relational Graphic Organizers
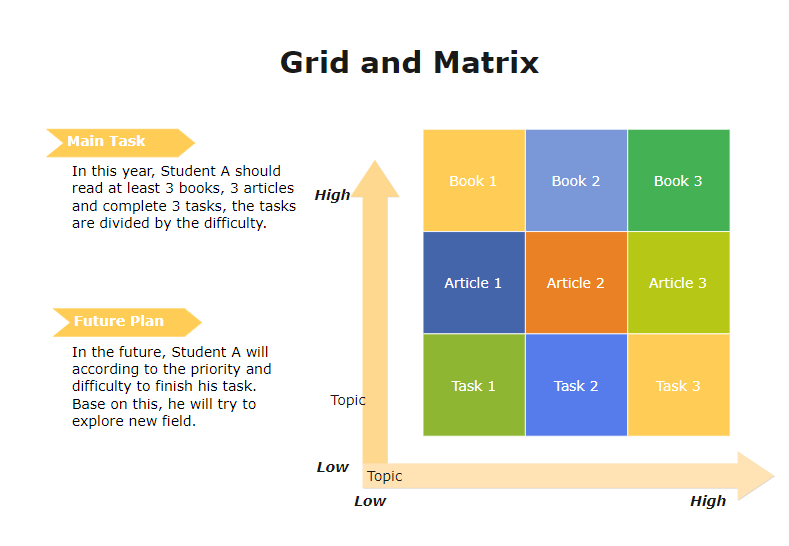
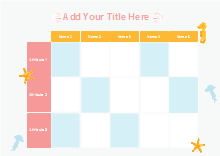
Grid and Matrix
Graphic organizers are pedagogical tools that express the logic and relationships between items, facts, and concepts in a visualized pattern and help you understand and instruct the connotation of things better. Grid and matrix are much easier to create than other comprehensive visual graphic organizers such as mind maps and various charts.
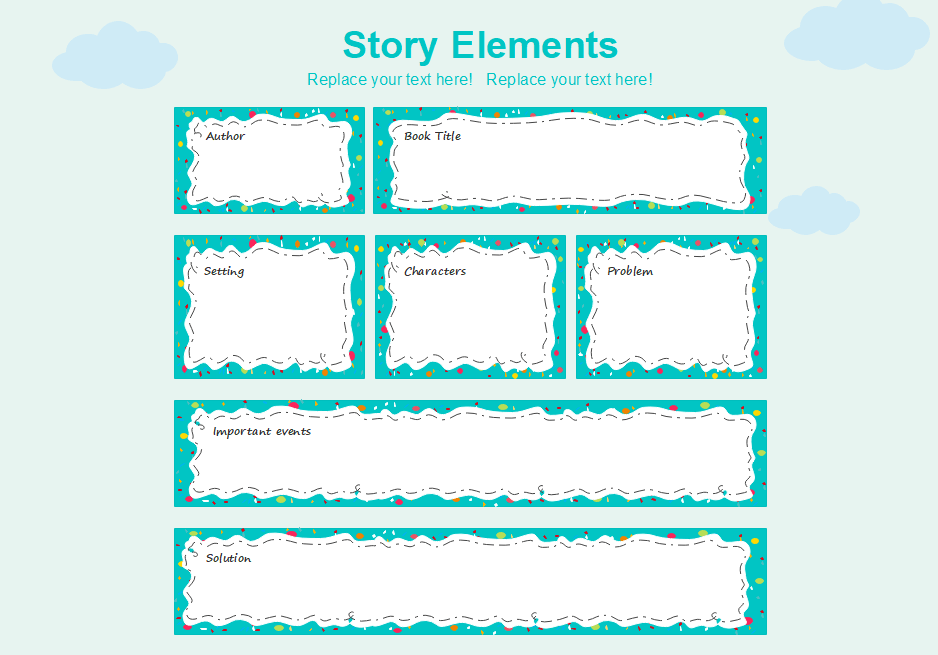
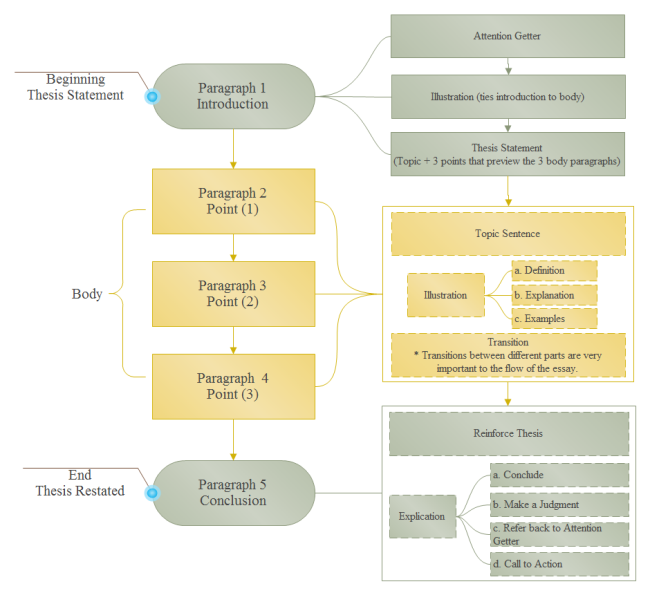
Storyboard
The storyboard strategy utilizes a graphic organizer to enable students to learn a book's story or element by identifying the plot, characters, problem and solution, and setting. Most storyboard graphic organizers focus on three areas; the start, middle, and end of the narrative.
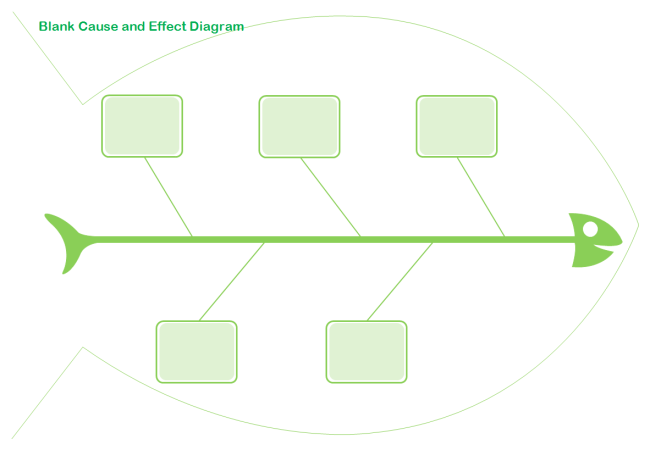
Cause and Effect Diagram
The cause and effect diagram, also known as an Ishikawa or fishbone diagram, refers to a graphical tool used to display a list of causes related to a specific effect. It organizes these potential causes in groups.
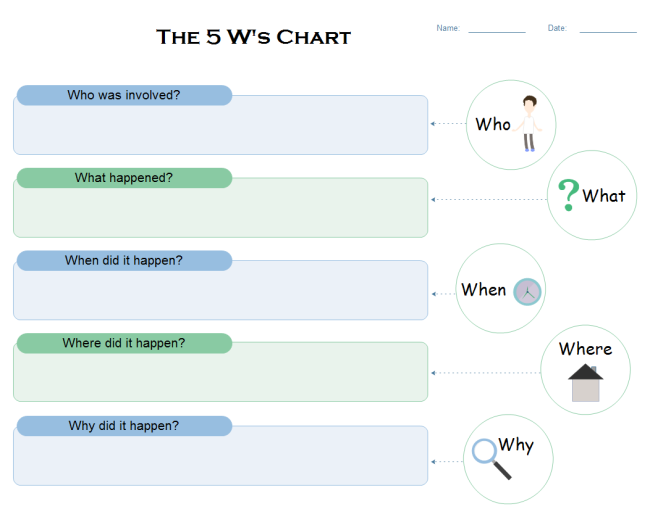
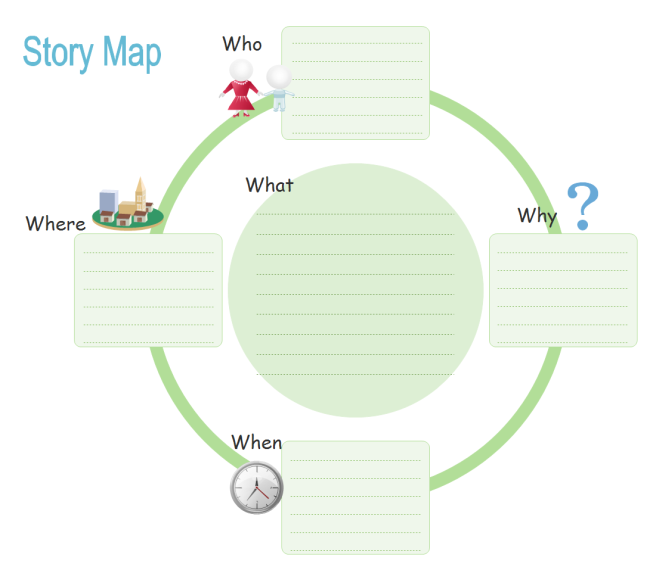
Five 5W's Chart
This type of graphic organizer is useful in examining a story's or event's key points. Therefore, it enables students to consider five important factors; Who, What, Why, When, and Where.
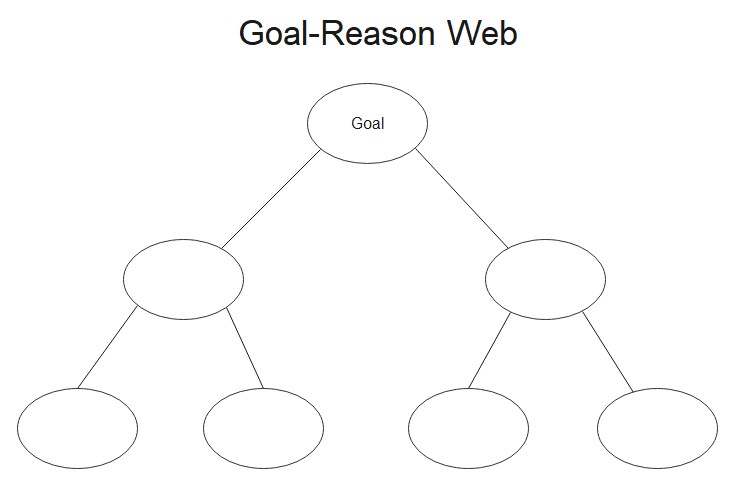
Goal-Reason Web
The Goal-Reason web is a graphic organizer worksheet that students use for goal setting and reasoning. They set goals and then state two reasons, which could be facts, and related examples.
Classification Graphic Organizers
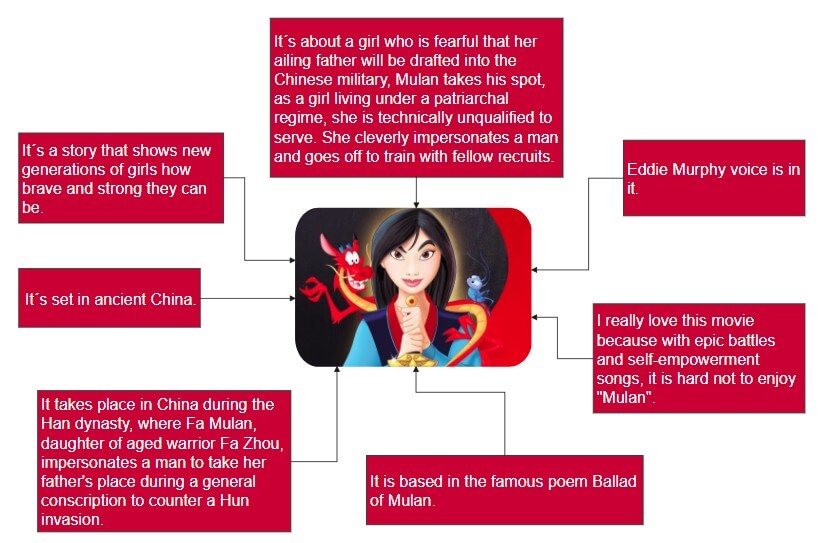
Concept Map
A concept map is a type of graphic organizer that appears as a web with multiple arrows that connect the circles. It is useful in identifying the main concept and sub-concepts and visually illustrating information hierarchically, and organizing thoughts
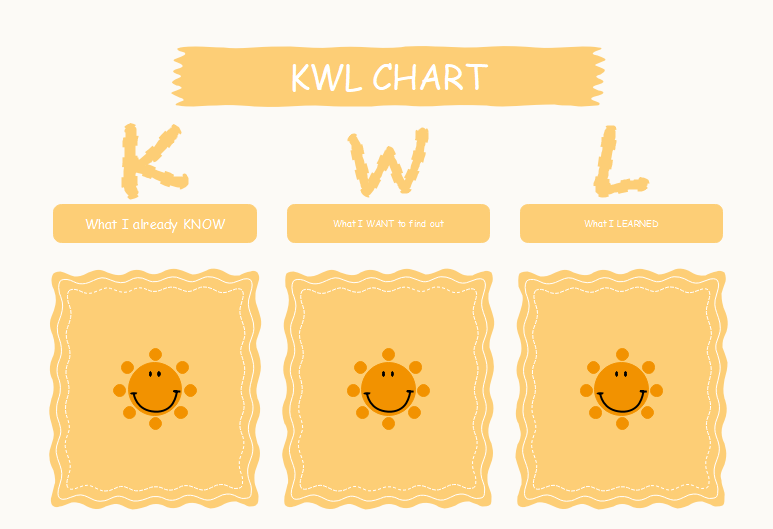
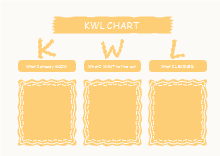
KWL Chart
A KWL chart is also a popular graphic organizer as it is used as a visual learning tool in the elementary classroom. It is used before and after learning a new concept, since it identifies what one knows, wants to discover, and has learned, and hence develops a sense of purpose.
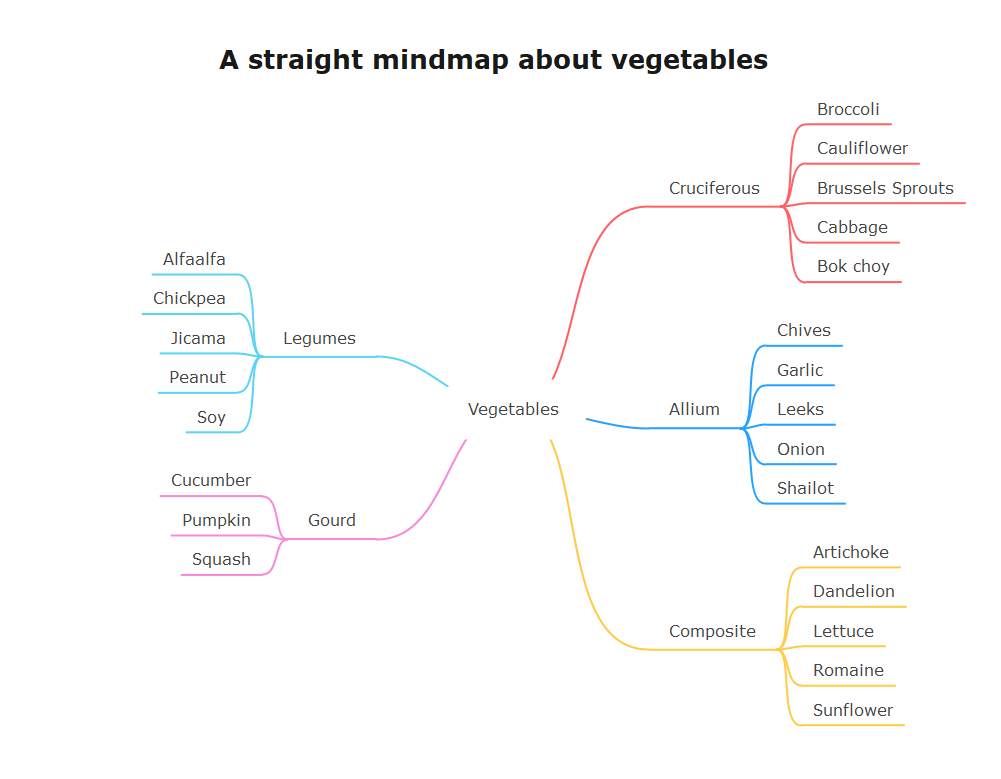
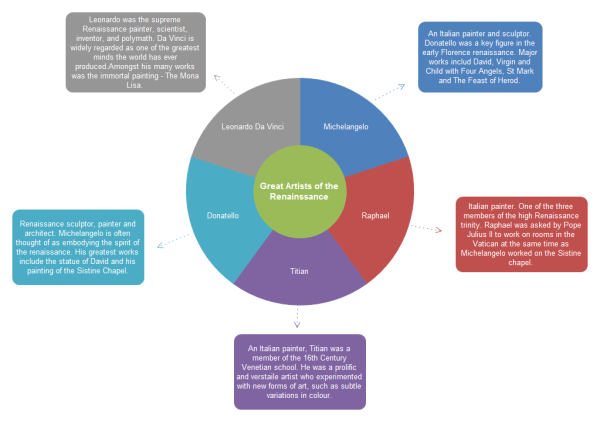
Mind Map
Mind maps are great tools for solving problems, brainstorming ideas, and showing components and relationships in a process. They are useful in the visual representation of hierarchical information, consisting of a central idea surrounded by connected branches of associated topics.
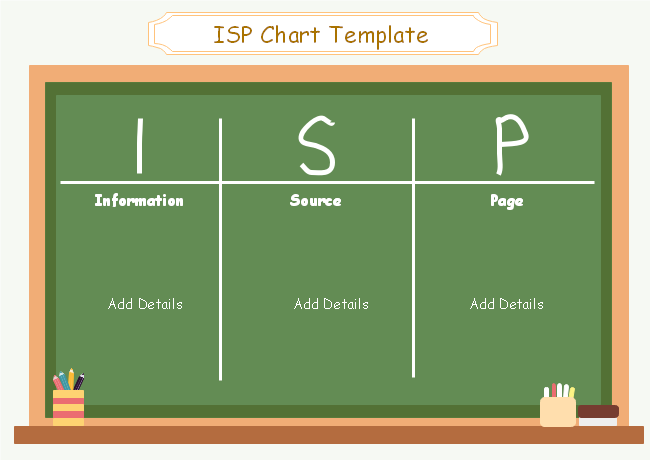
ISP Chart
ISP stands for Information, Sources, Page, which is a reference guide that you can use in your thesis or research document. If you task your students with documentation of information, sources, and page number, this graphic organizer helps them develop their reference skills.
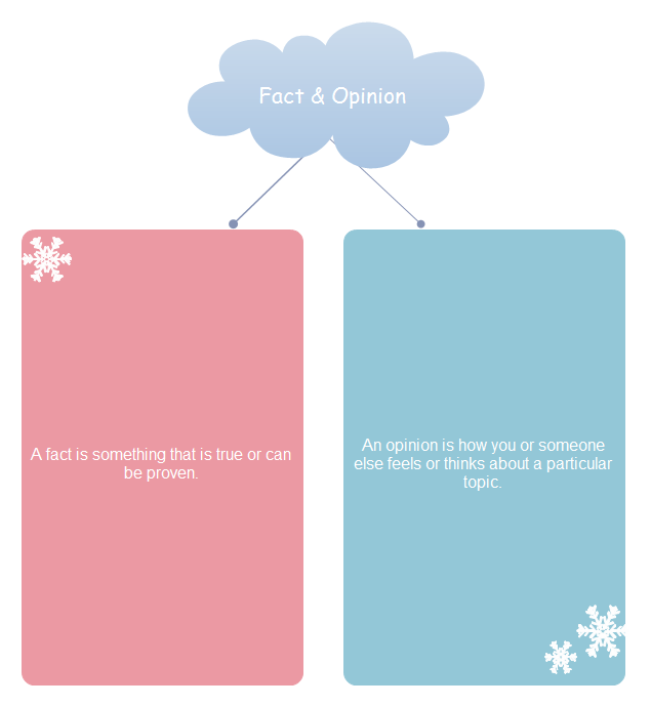
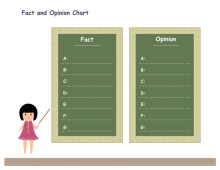
Fact and Opinion
A fact and opinion graphic organizer is perfect for the development of critical thinking skills. It comes in handy when you need to distinguish facts and opinions in texts and thus helps in analyzing essays, debates, and news articles.
Sequence Graphic Organizers
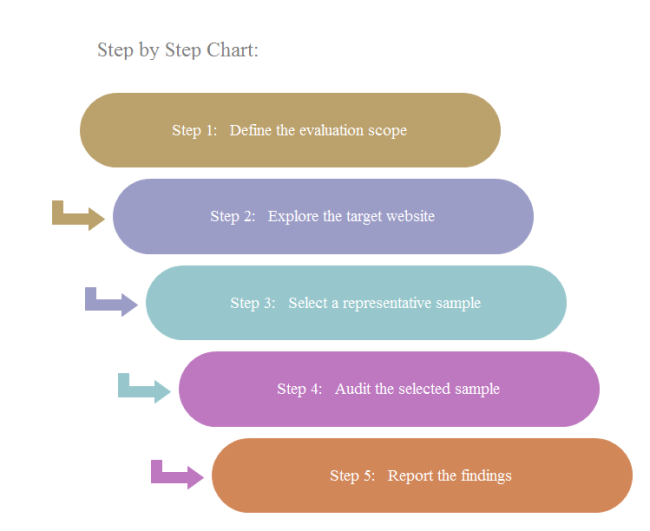
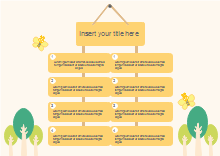
Step-by-Step Chart
The step-by-step chart shows the processes and project stages that are followed.
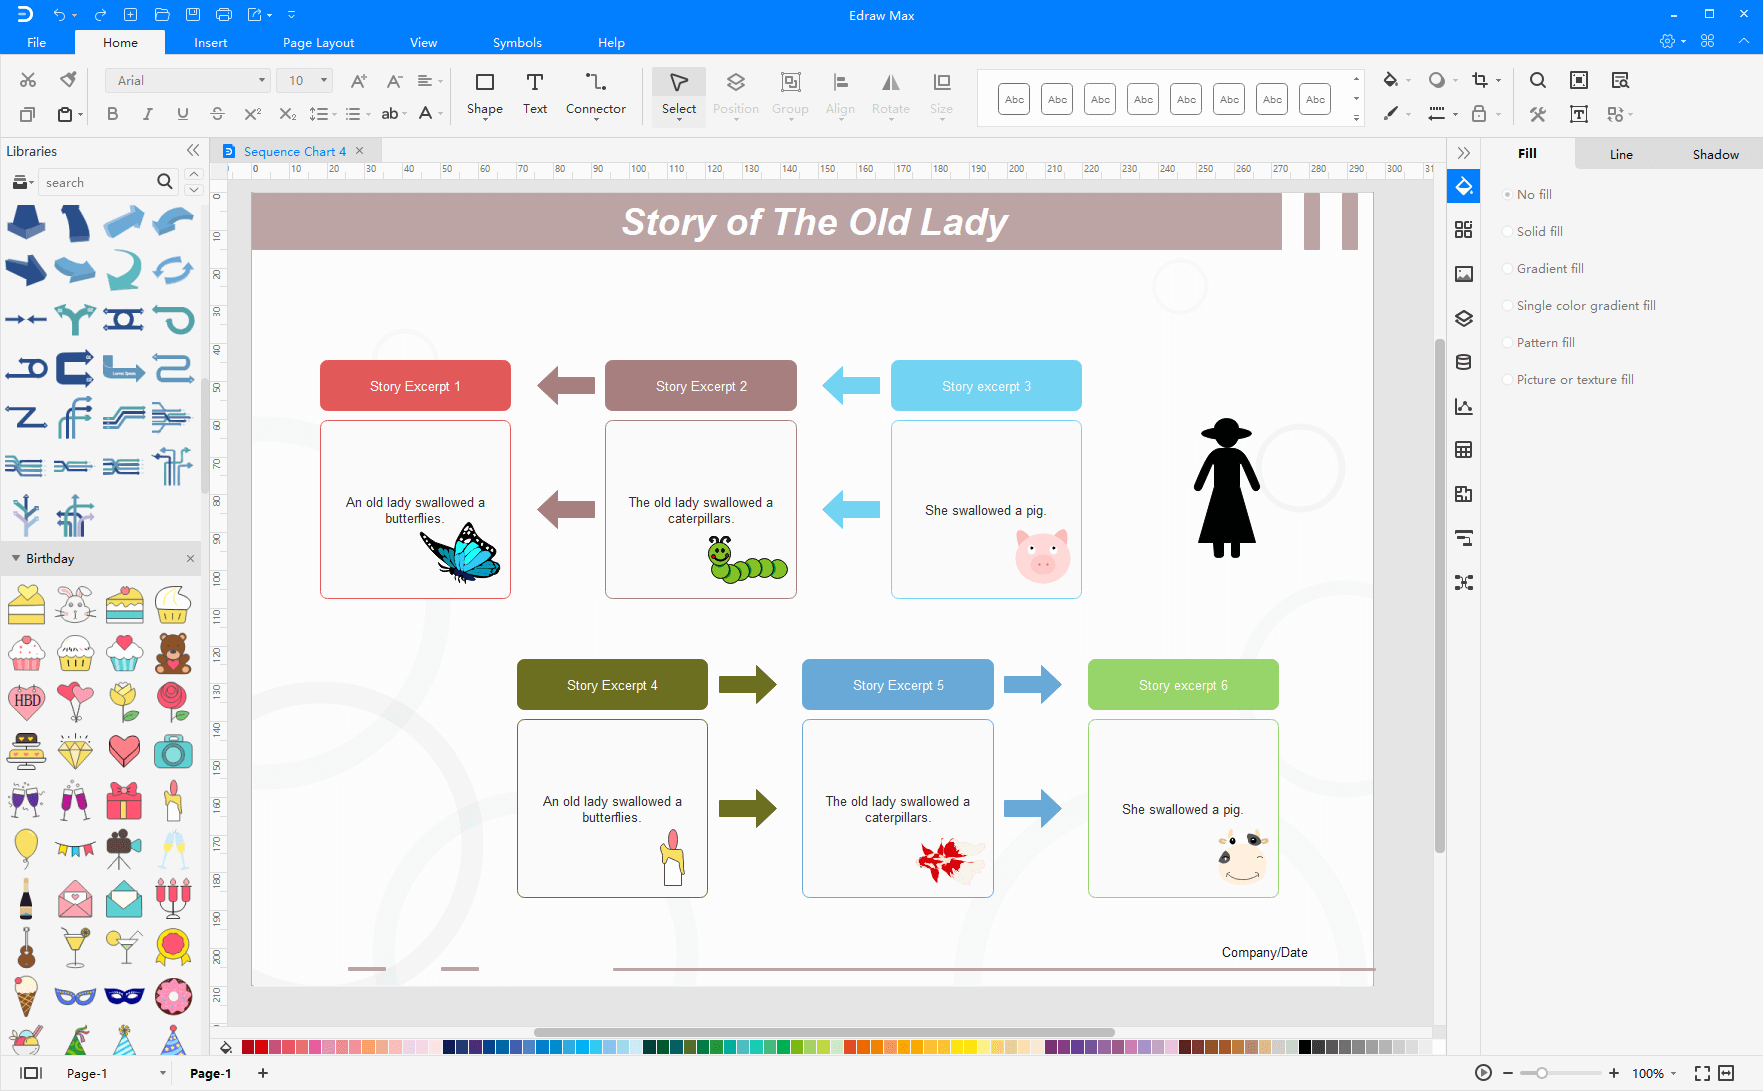
Sequence Chart
A sequence is a set of numbers, actions, or events with a particular order and leads to certain results. Therefore, a sequence chart is used to understand the flow of events in a story, such as flashbacks in a novel.
Timeline
A timeline displays details graphically, making points in time easy to see and understand. As a result, it is effective in visualizing a process chronologically, such as the project's schedule.
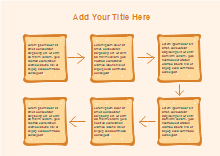
Flowchart
These graphic organizers indicate how steps fit together in a process. Flowcharts are used in communicating the workability of processes and documenting how to carry out a job.
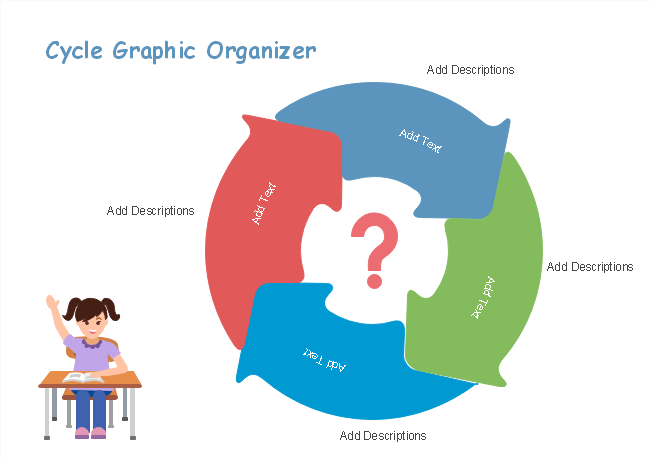
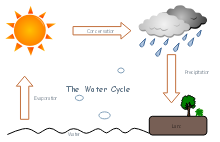
Cycle Map/Cycle Graphic Organizer
A cycle map is a graphic organizer type that shows the relationship between items in a repeating cycle. It is used in a repeating process as it identifies the beginning and how the cycle repeats.
Compare and Contrast Graphic Organizers
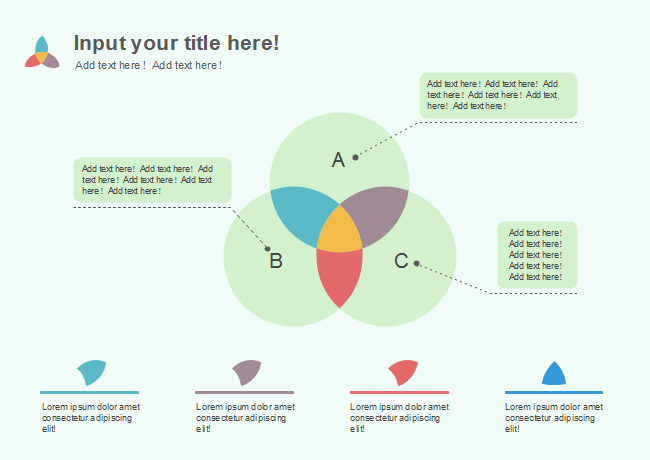
Venn Diagram
A Venn diagram refers to a graphic organizer with two or three interlocking circles. It is used in comparing and contrasting two or three characters by identifying their differences and similarities.
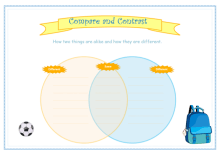
Compare and Contrast Graphic Organizer
The compare and contrast graphic organizer also helps you to compare and contrast two concepts, based on their features.
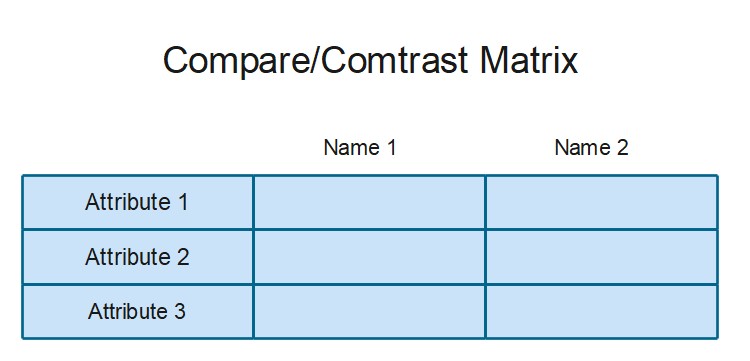
Compare/Contrast Matrix
Compare/Contrast Matrix Graphic Organizers provide a compare and contrast platform for several characters, concepts, and objects from a text. Students use them to find differences and similarities through the creation of several diverse subtopics that matter to them.
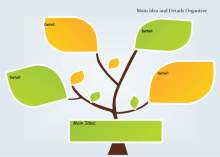
Main Idea and Details Graphic Organizers
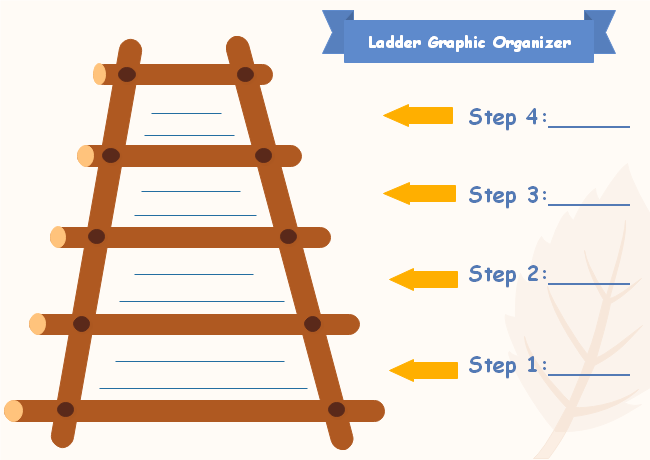
Ladder (graphic organizer)
The ladder provides school children with a platform to break simple tasks into steps. Therefore, it is useful in improving their ability to read and write directions.
Story Web
Using a story web, you can begin the writing process by generating ideas. This graphic organizer gives you additional ideas to plot lines and fastens the generation of ideas.
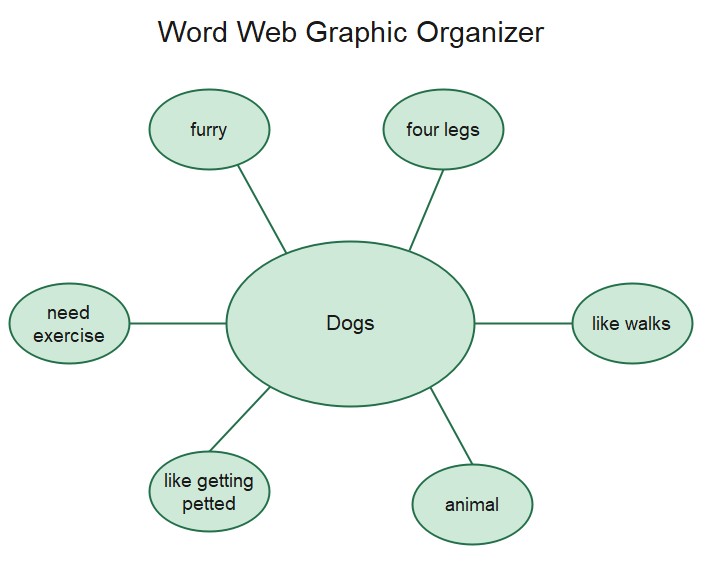
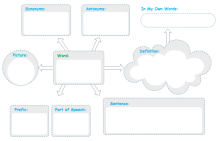
Word Web Graphic Organizer
If you would like your students to organize information and think about words, you should consider the Word Web graphic organizers since they are quite instructional.
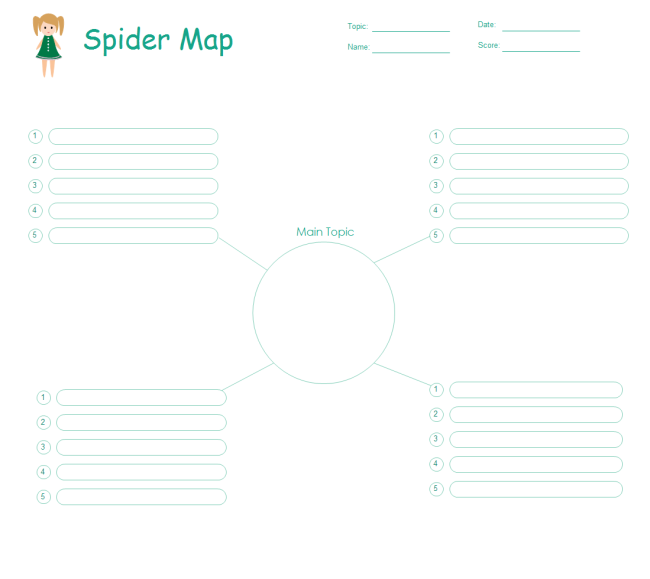
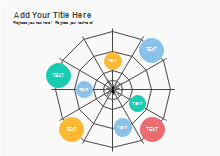
Spider Map
The spider map acts as an organizational tool that displays knowledge in a visual framework, which resembles a cobweb. It enables learners to organize information from various sources, such as readings, and make connections constituting a meaningful structure.
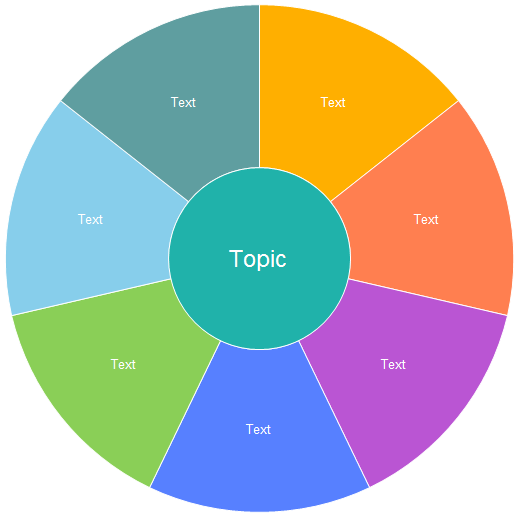
Describing Wheel
The describing wheel is a graphic organizer that explores a subject or topic while utilizing critical thinking skills. It encourages users to discover new means to describe a particular, and thus enhances vocabulary skills.
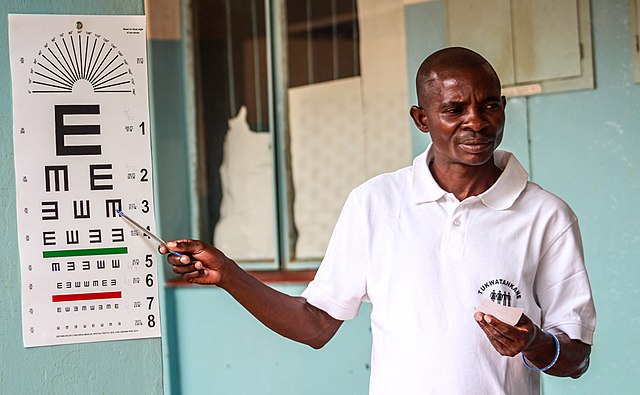
E-chart
An E-chart is an ophthalmological tool that measures the visual acuity of a patient. It is useful among people that cannot read Latin alphabet or in countries such as China, where the alphabet does not constitute their native language.
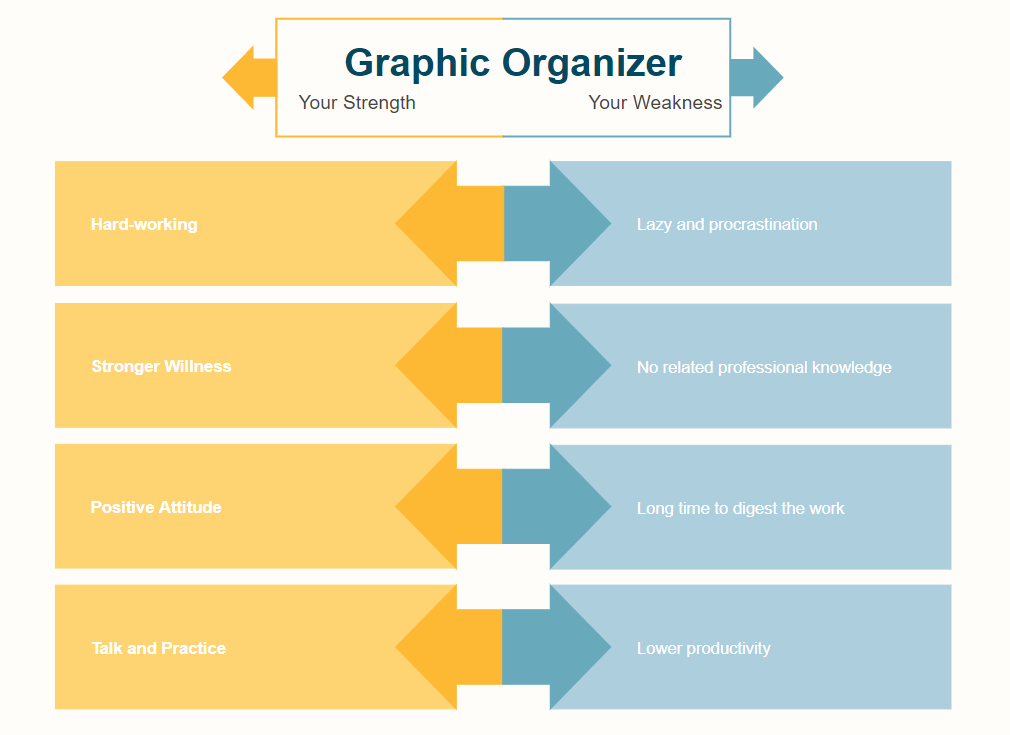
T-Chart
A T-Chart might be the simplest graphic organizer for both teachers and students. It's mostly used for comparison by separating information into two or more columns, such as the advantages and disadvantages of surfing the Internet, forming a layout in the shape of the English letter "T". The easiest way to create a T-Chart is to draw a large capital T. Set your title at the top and list facts about the two events in the two vertical areas. Each row in the chart compares one characteristic. You can make T-charts with multiple columns to compare several objects, processes, or events.
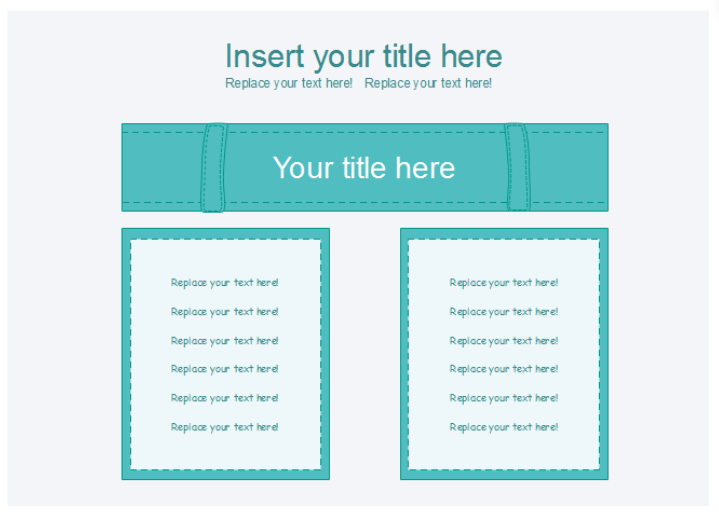
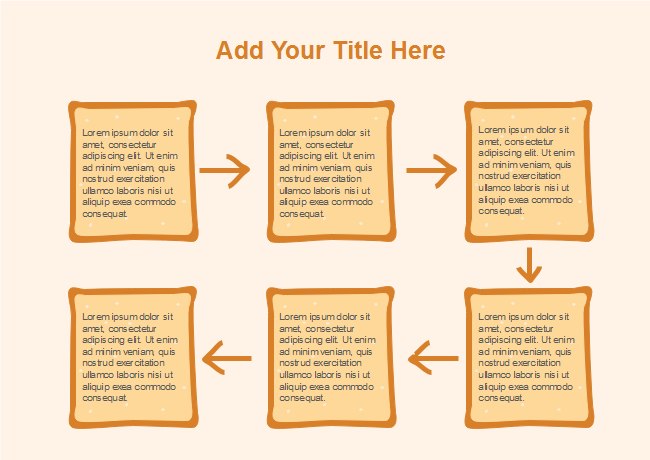
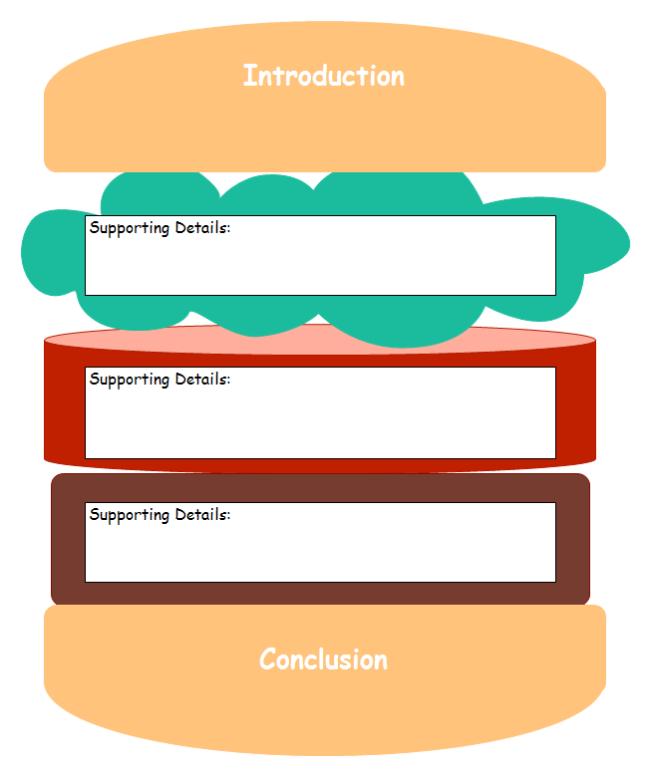
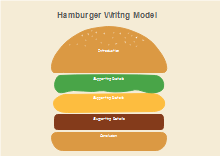
Sandwich Chart
The sandwich chart helps in deciding where you stand regarding various topics. It is useful in assigning meanings to words and arranging texts in chronological order.
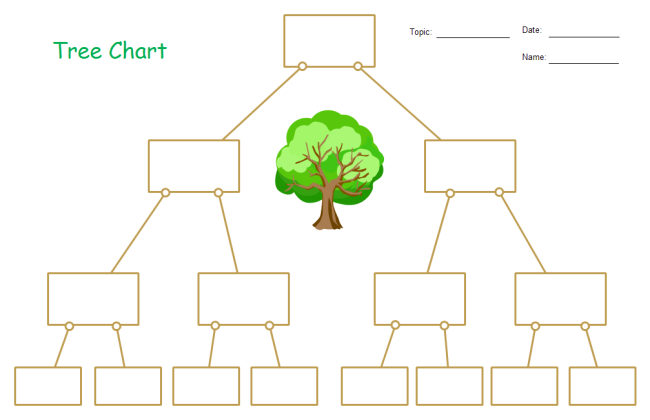
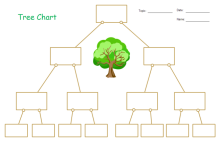
Tree Chart
This management planning tool conveys a hierarchy of tasks and subtasks that are significant to complete an objective. It is useful in breaking down broad categories into detailed levels.
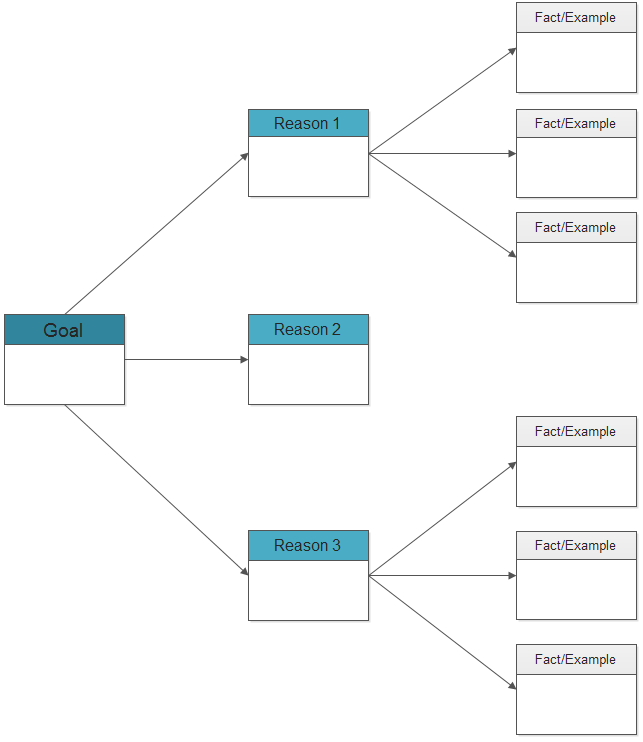
Persuasion Map
The persuasion map is quite interactive and thus suitable for students as they present their arguments in a debate or persuasive essay. As soon as they determine their goal, they use this graphic organizer to identify reasons to support their argument and then use facts or examples for validation.
Idea Wheel
The idea web is a brainstorming tool that students can use to be creative. It is also used in organizing concepts and ideas, which are connected, depending on the topic.
Other Graphic Organizers
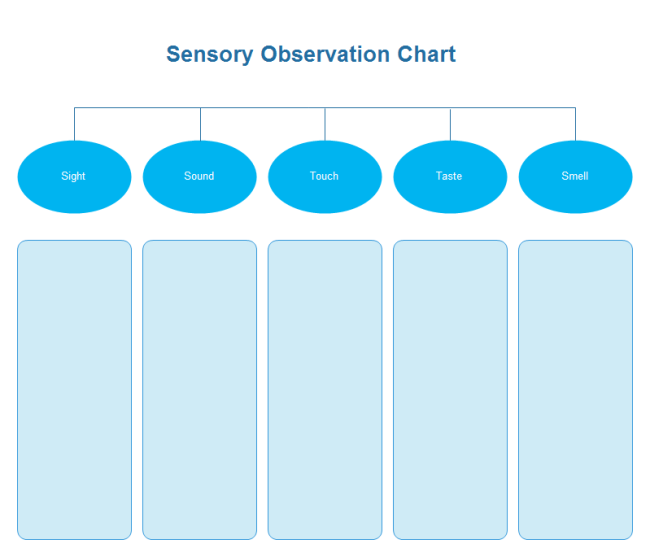
Observation Chart
Healthcare teams use observation charts to record patient’s physiological parameters such as blood pressure, pulse rate, temperature, respiratory rate, consciousness levels and oxygen saturation levels. It is used to identify early warning signs that indicate the deterioration of a patient’s condition.
Updating...
Part 3: How to Create a Graphic Organizer
Preparation
- Have a purpose in mind for your graphic organizer before creating it. Each type of graphic organizer is used for a specific purpose, so be sure that you draw the correct one for what you need to analyze or learn.
- Usually, we can create a graphic organizer by hand drawing or digital software. To create a hand-drawn one, you'll need a pencil, paper, eraser, ruler, and compass, etc.
- As graphic organizers are so popular for education use, teachers are recommended to create digital graphic organizers that support convenient sharing and printing.
As you create graphic organizers, use the following tips:
- Incorporate color-coding information since it helps you in establishing connections, as well as distinctions, between ideas and details.
- Avoid using sentences. Instead, use phrases, words, symbols, and abbreviations to make content concise and easy to understand.
- Color-codes, symbols, and abbreviations should make sense to you to make the diagrams useful.
- Use arrows and numbers in showing the sequence of events.
Part 4: How to Use Graphic Organizers Effectively
Graphic organizers are significant tools in learning since they guide students in understanding concepts in a better way and hence can meet all their needs. To use any of these tools effectively in student learning, you should model how to utilize the organizer and explain to learners reasons for your selection based on the relevant topic. Therefore, the chosen graphic organizer must align with the learning goal.
For instance, you can explain selecting the Venn diagram for an essay by stating that it is the most suitable tool to compare two or three characters in an organized manner before commencing content writing. As soon as the learners understand the necessity of their actions, including what and why they will have a sense of purpose.
Here is a summary of how to use graphic organizers effective:
1. Explain: Ensure your students understand how to use the chosen graphic organizer for the activity at hand. Expound on the usage of graphic organizers, including their effectiveness at specific times.
2. Practice: Give room to practically use multiple graphic organizers since students may have different preferences.
3. Use: Once students are fully conversant with different graphic organizers, allow them to select the most suitable tools for their future projects.
Tips for Using Graphic Organizers Effectively
- The teacher model and guide students on how to make and use the organizers.
- Use bullet points and sentence fragments rather than complete sentences to get ideas down and show how they are related.
- For complex material, consider teacher-generated organizers and let students fill them partially.
- Let students color outside the lines and make sketches to reinforce concepts.
- Offer a variety of organizers for day-to-day use to let students get used to using graphic organizers.
Part 5: Conclusion
All the above information provides a basic understanding of what is a graphic organizer. Knowing why and when to use these tools, types, creation, and usage will come in handy as you teach individuals and learn personally.
Basically, graphic organizers are the perfect visual thinking and learning products that students and teachers use to gather research, generate ideas, identify connections, organize information, and create visual associations. EdrawMax is the best graphic organizer maker to use to create your preferred graphic organizers.

An all-in-one platform for 210+ diagrams.
・ Simple alternative to Visio
・ 26k+ symbols
・ 10K+ free templates
・ 10+ AI diagram generators


Graphic Organizer Templates
You can view big images of the examples by clicking on the magnifier buttons. If there is an example you want to use as a template, simply click the link under the image to download the original file and edit it.
  |
|
|
| Main Idea and Details Organizer | Sequence Chart Graphic Organizer | Compare and Contrast Organizer |
|
|
|
| Vocabulary Study Organizer | Tree Chart Graphic Organizer | Storyboard Graphic Organizer |
|
|
|
| KWL Chart Graphic Organizer | Grid and Matrix Graphic Organizer | Fact and Opinion Organizer |
|
|
|
| T-Chart Graphic Organizer | K-12 Education Graphic Organizer | Spider Map Graphic Organizer |
More Related


