Algorithm Flowcharts Examples
Edraw Content Team
Do You Want to Make Your Algorithm Flowchart?
EdrawMax specializes in diagramming and visualizing. Learn from this article to know everything about algorithm flowchart examples and templates, and how to use them. Just try it free now!
Algorithms and flowcharts are two different ways of presenting the process of solving a problem. Algorithms consist of steps for solving a particular problem, while in flowcharts, those steps are usually displayed in shapes and process boxes with arrows. So flowcharts can be used for presenting algorithms. EdrawMax will introduce some examples of algorithm flowcharts.
1. Rules of Drawing Flowcharts for Algorithms
Flowcharts usually consist of basic symbols and shapes that have a specific representation. The symbols make the chart more meaningful and easy to understand.
Some of the most standard symbols include shapes like a rectangle representing an operation, a parallelogram showing input and output of data, a cylinder indicating the start/end, while a diamond represents a decision. Read more about flowchart symbols.
However, knowing these symbols well and using them in a flowchart involves critical thinking. Here are some basic rules that need to be considered while drawing a flowchart.
- All the boxes and shapes in a flowchart should be connected with arrows to indicate a logical order and make it easy to follow.
- Make sure the flow direction is consistent and not ambiguous. The flow charts always flow from either left to right or top to bottom.
- Every chart will begin with a Start box and end with a Terminal box, with the latter only having one flow line associated with it.
- All the shapes, symbols, and lines should be consistent. You can also add a symbol key to make it easier to follow the chart.
2. Free Algorithm Flowchart Examples & Templates
There are many algorithm flowchart examples provided for you, you can click the table of contents to get them soon.
You can click to download and use the templates you want. While The eddx file need to be opened in EdrawMax. If you don’t have EdrawMax yet, you could download EdrawMax for free!


Examples List
- Find the Sum of Two Numbers Entered
- Determining the Largest Number Among All the Entered Integers
- Work Out All the Roots of a Quadratic Equation ax² +bx+c=0
- Find the Fibonacci series till term ≤ 1000
- Calculate the Sum of The First 50 Numbers
- Find the largest price among 100 given values and reduce it by 10%
- Arrange the numbers X, Y, Z in descending order
- Determine the Highest Common Factor (HCF) of two integers
- Determine and Output Whether Number N is Even or Odd
- Calculate the Interest of a Bank Deposit
- Determine Whether a Temperature is Below or Above the Freezing Point
- Determine Whether A Student Passed the Exam or Not
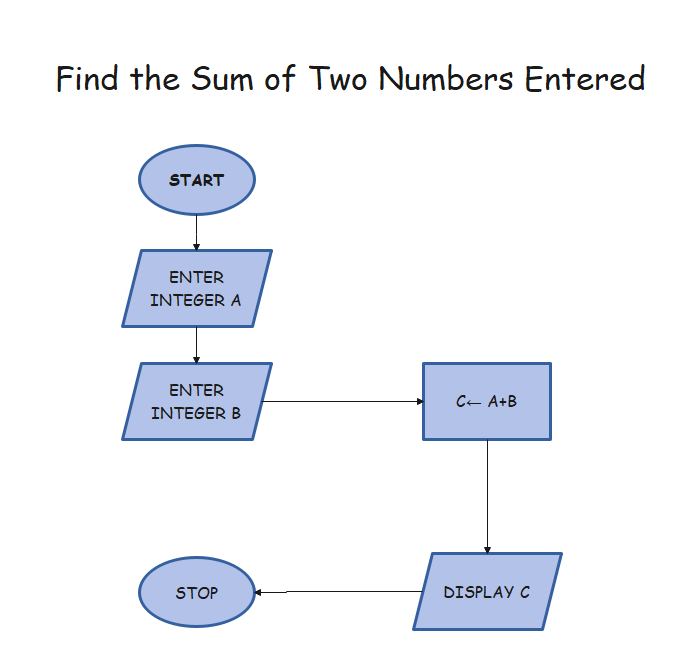
Example 1: Find the Sum of Two Numbers Entered
- Step 1: Read the Integer A.
- Step 2: Read Integer B.
- Step 3: Perform the addition by using the formula: C= A + B.
- Step 4: Print the Integer C.
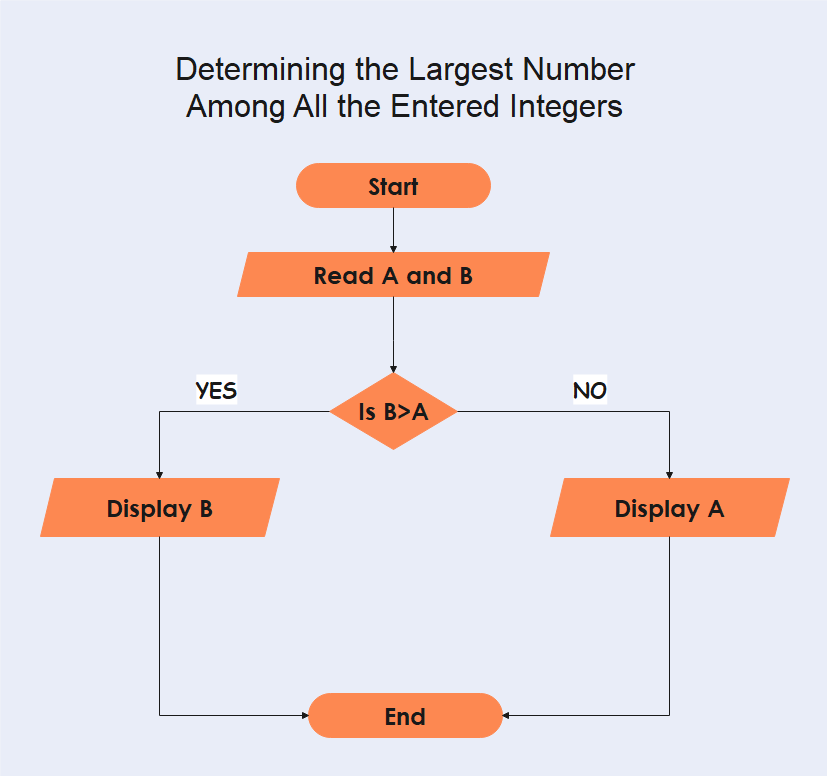
Example 2: Determining the Largest Number Among All the Entered Integers
- Step 1: Read the Integer A.
- Step 2: Read Integer B.
- Step 3: If B is greater than A, then print B, else A.
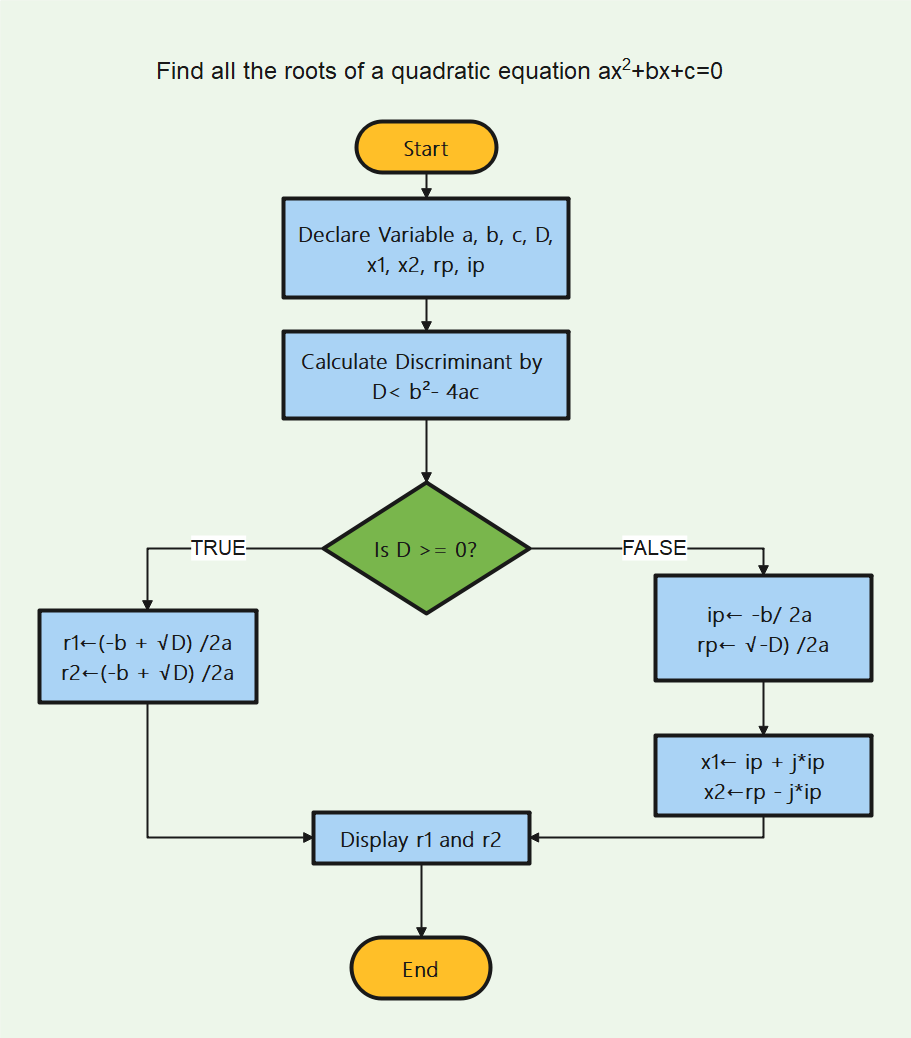
Example 3: Work Out All the Roots of a Quadratic Equation ax² +bx+c=0
- Step 1: Enter the variables a, b, c, D, x1, x2, rp, and ip.
- Step 2: Evaluate the discriminant by using the formula: D= b²- 4ac
- Step 3: Print rp and ip.
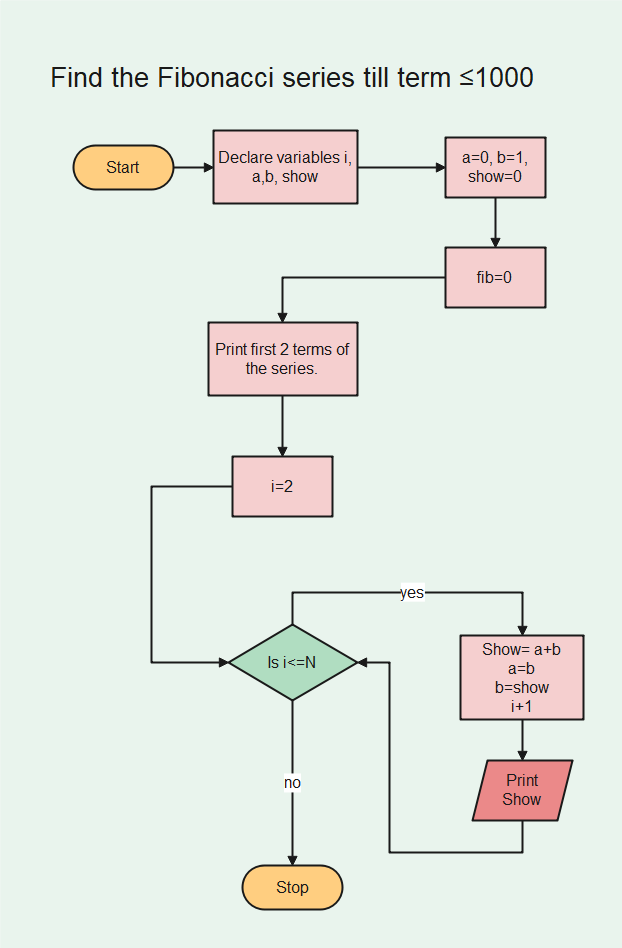
Example 4: Find the Fibonacci series till term ≤ 1000
- Step 1: Declare the variables i, a, b, show.
- Step 2: Enter the values for the variables, a=0, b=1, show=0
- Step 3: Enter the terms of the Fibonacci series to be printed, i.e=, 1000.
- Step 4: Print the first two terms of the series.
- Step 5: Loop the following steps:
- Show = a + b
- a= b
- b = show
- Add 1 to the value of i each time.
- Print Show
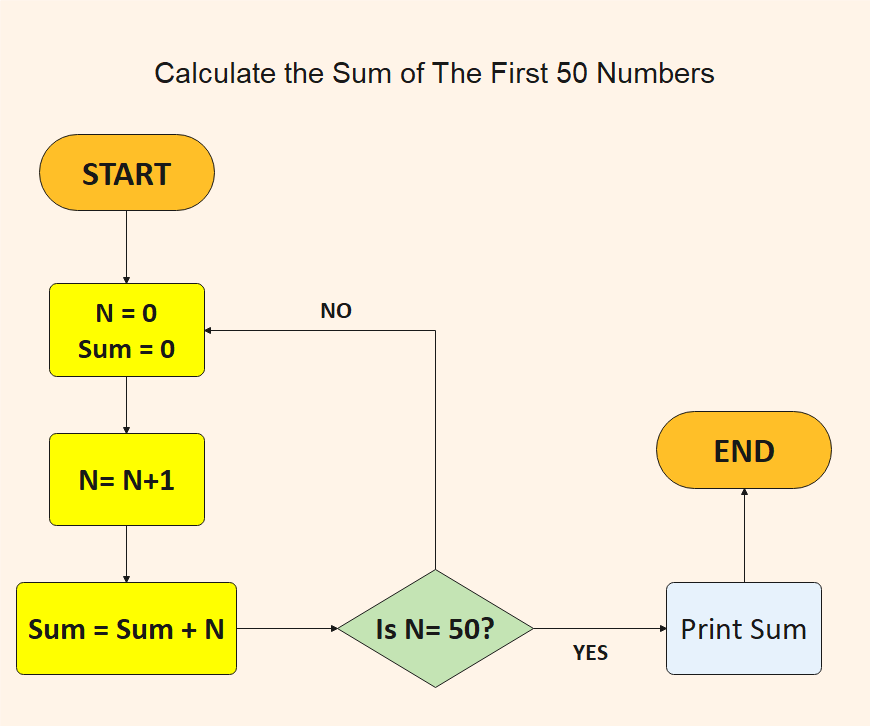
Example 5: Calculate the Sum of The First 50 Numbers
- Step 1: Declare number N= 0 and sum= 0
- Step 2: Determine N by N= N+1
- Step 3: Calculate the sum by the formula: Sum= N + Sum.
- Step 4: Add a loop between steps 2 and 3 until N= 50.
- Step 5: Print Sum.
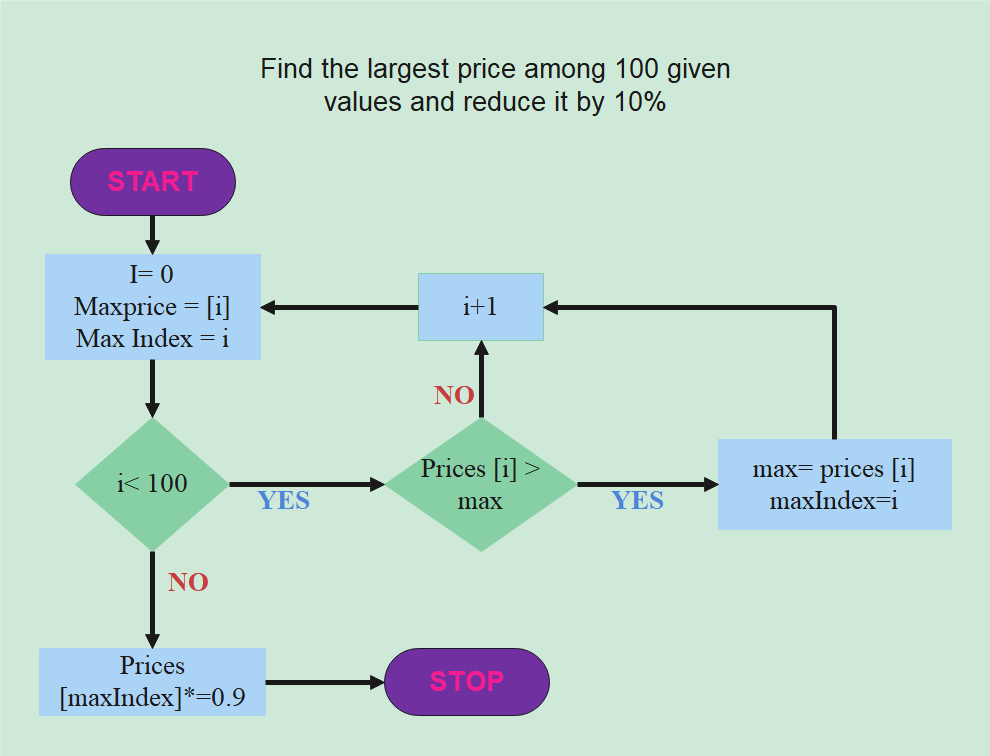
Example 6: Find the largest price among 100 given values and reduce it by 10%
- Step 1: Read the 100 prices.
- Step 2: Compare the first price with the next and let the greater of the two be 'max' in the 'max index.
- Step 3: Loop it until the largest price has been found.
- Step 4: Reduce the 'max' value by 10% using the formula: prices [max index] = prices [max index] x 0.9.
- Step 5: Print.
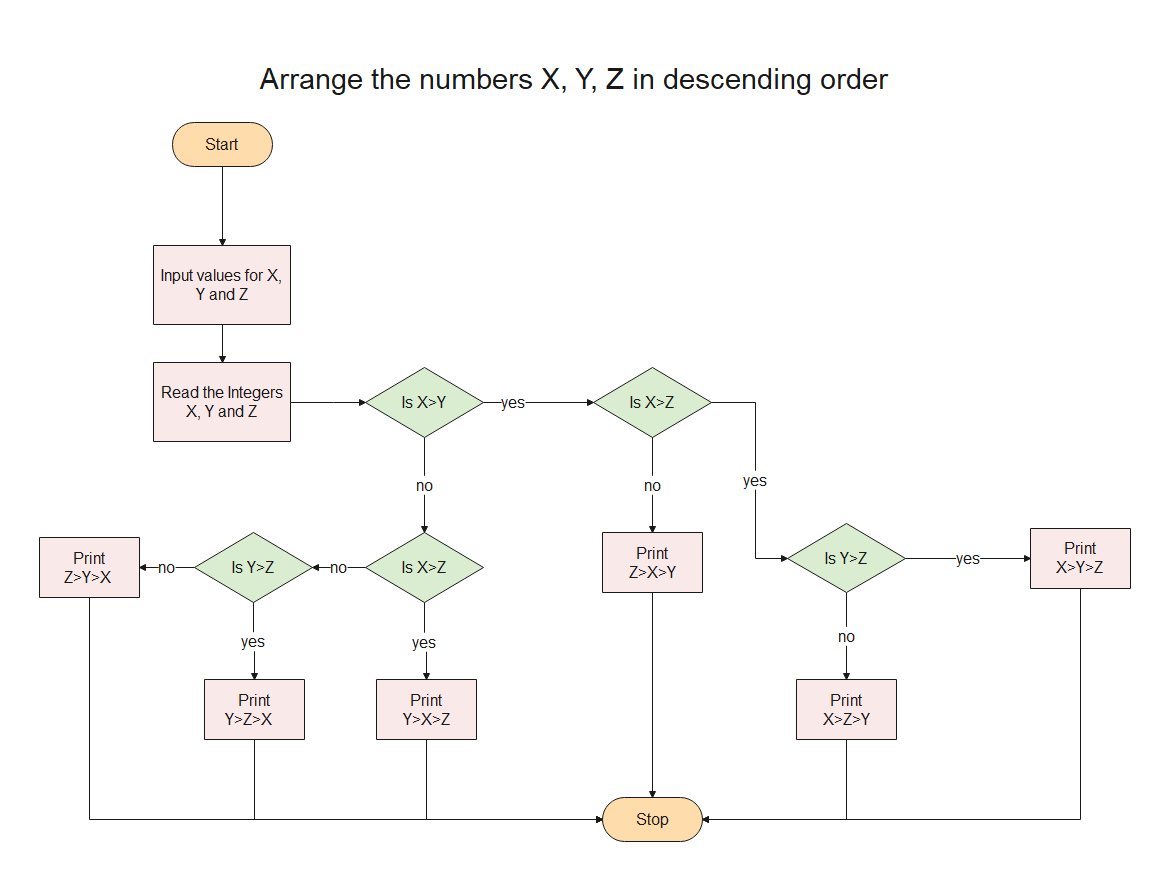
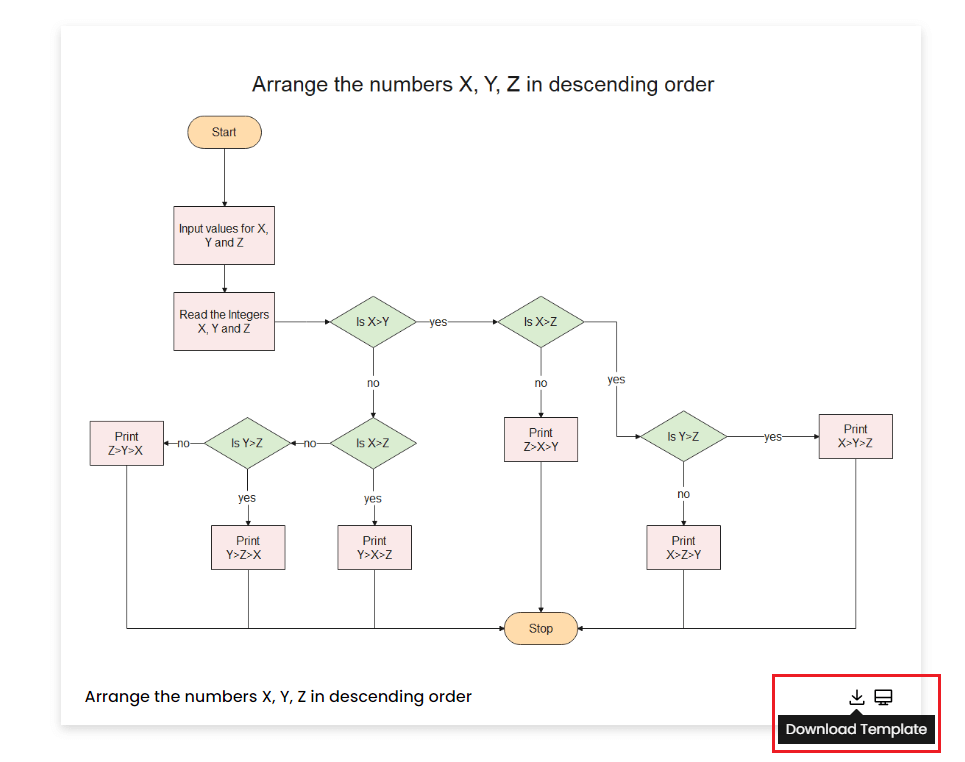
Example 7: Arrange the numbers X, Y, Z in descending order
- Step 1: Input the value for variables X, Y, Z.
- Step 2: Read the integers X, Y, Z.
- Step 3: Check if x>y, x>z, y>z
- Step 4: Print the possible order.
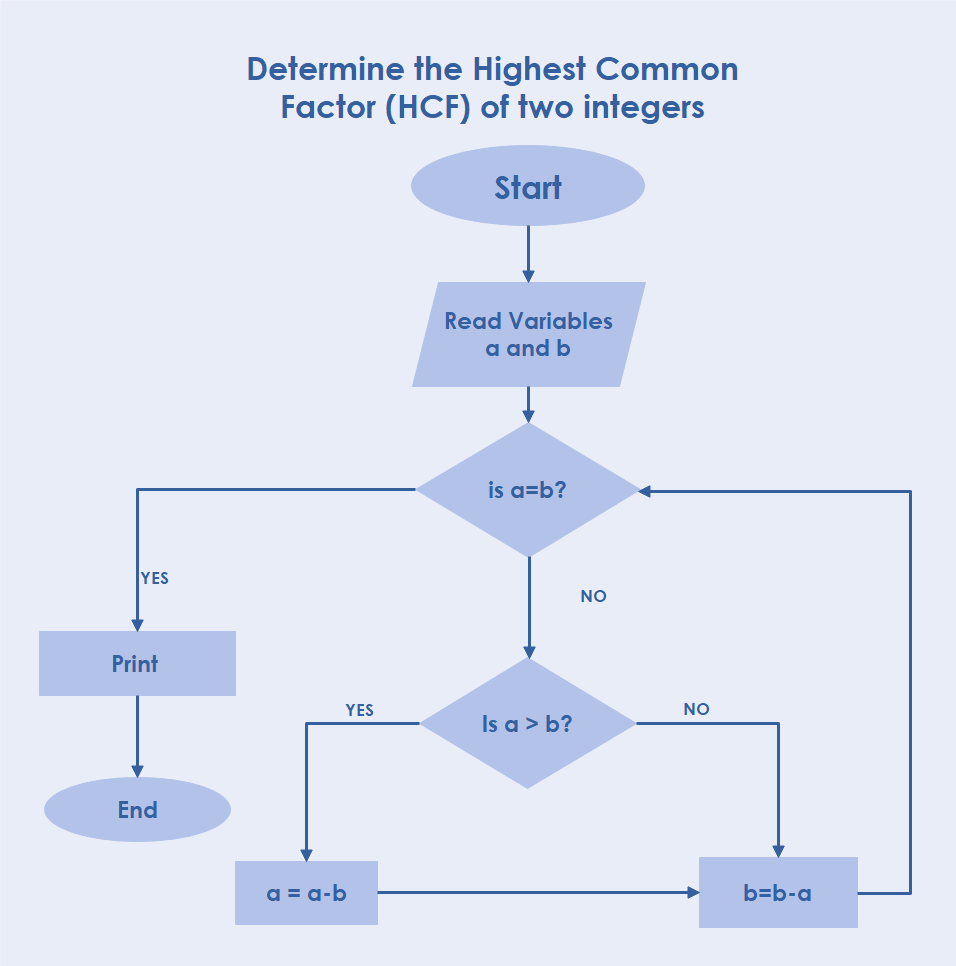
Example 8: Determine the Highest Common Factor (HCF) of two integers
- Step 1: Read the variables a and b.
- Step 2: If a = b, go to step 4.
- Step 3: If a > b, then: a = a - b. Return to step 2.
- Step 4: Print a or b.
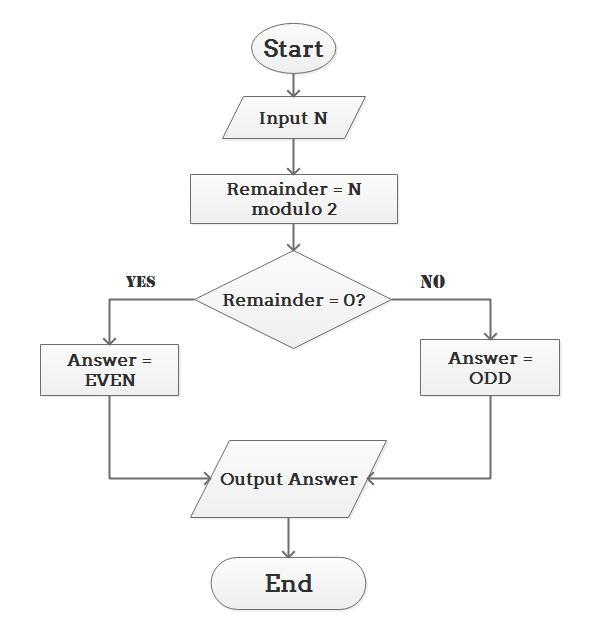
Example 9: Determine and Output Whether Number N is Even or Odd
- Step 1: Read number N.
- Step 2: Set remainder as N modulo 2.
- Step 3: If the remainder is equal to 0, then number N is even, else number N is odd.
- Step 4: Print output.
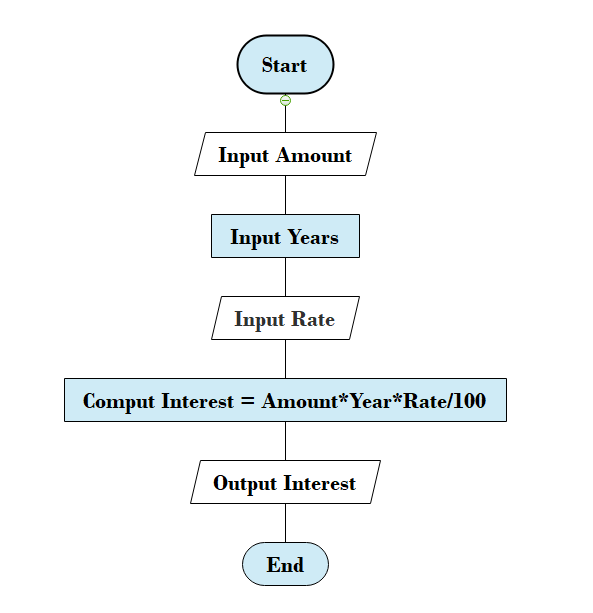
Example 10: Calculate the Interest of a Bank Deposit
- Step 1: Read amount.
- Step 2: Read years.
- Step 3: Read rate.
- Step 4: Calculate the interest with the formula "Interest=Amount*Years*Rate/100.
- Step 5: Print interest.
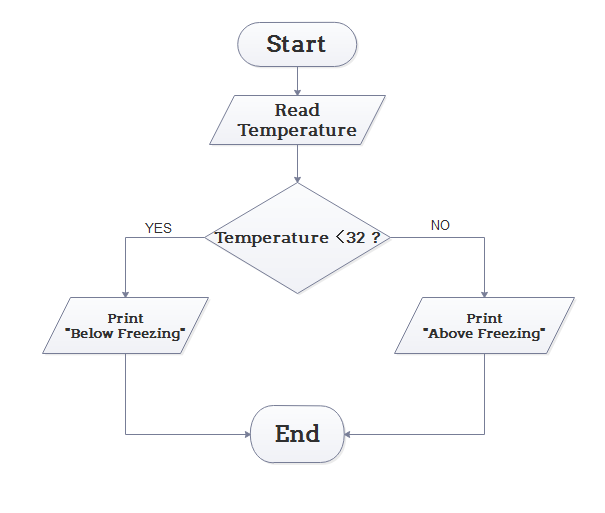
Example 11: Determine Whether a Temperature is Below or Above the Freezing Point
- Step 1: Input temperature.
- Step 2: If it is less than 32, then print "below freezing point", otherwise print "above freezing point".
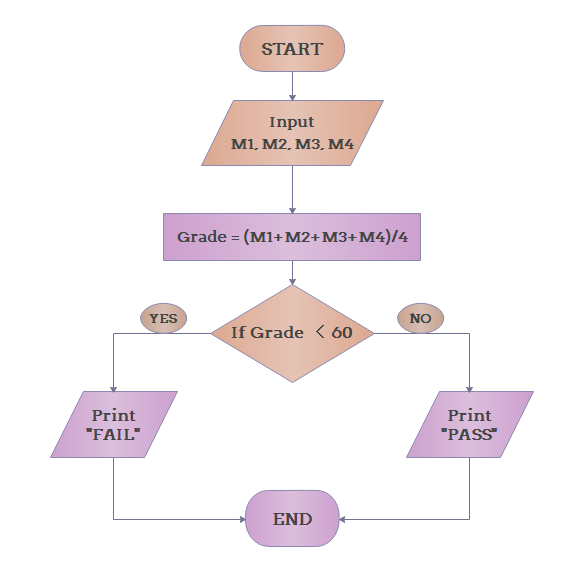
Example 12: Determine Whether A Student Passed the Exam or Not
- Step 1: Input grades of 4 courses M1, M2, M3 and M4.
- Step 2: Calculate the average grade with the formula "Grade=(M1+M2+M3+M4)/4".
- Step 3: If the average grade is less than 60, print "FAIL", else print "PASS".
3. How to Create a Flowchart for Algorithm?
EdrawMax is vector-based software that provides various templates for your algorithm flowchart. It provides an easily understandable interface for its users to draw efficiently and helps users edit existing templates and layouts and make their designs or template. It also provides 26000+ symbols to illustrate your algorithm flowchart. You can learn more about algorithm flowchart in details from this algorithm flowchart guide.
Step1 Install EdrawMax
You can edit the templates directly from this page. First of all, when your mouse click to the templates on this page, you can edit online easily, or you can download EdrawMax here.
Step2 Download the Template
After installing EdrawMax, you can go and download the template by clicking on the bottom right corner or look for a template in the EdrawMax library without going online in desktop.
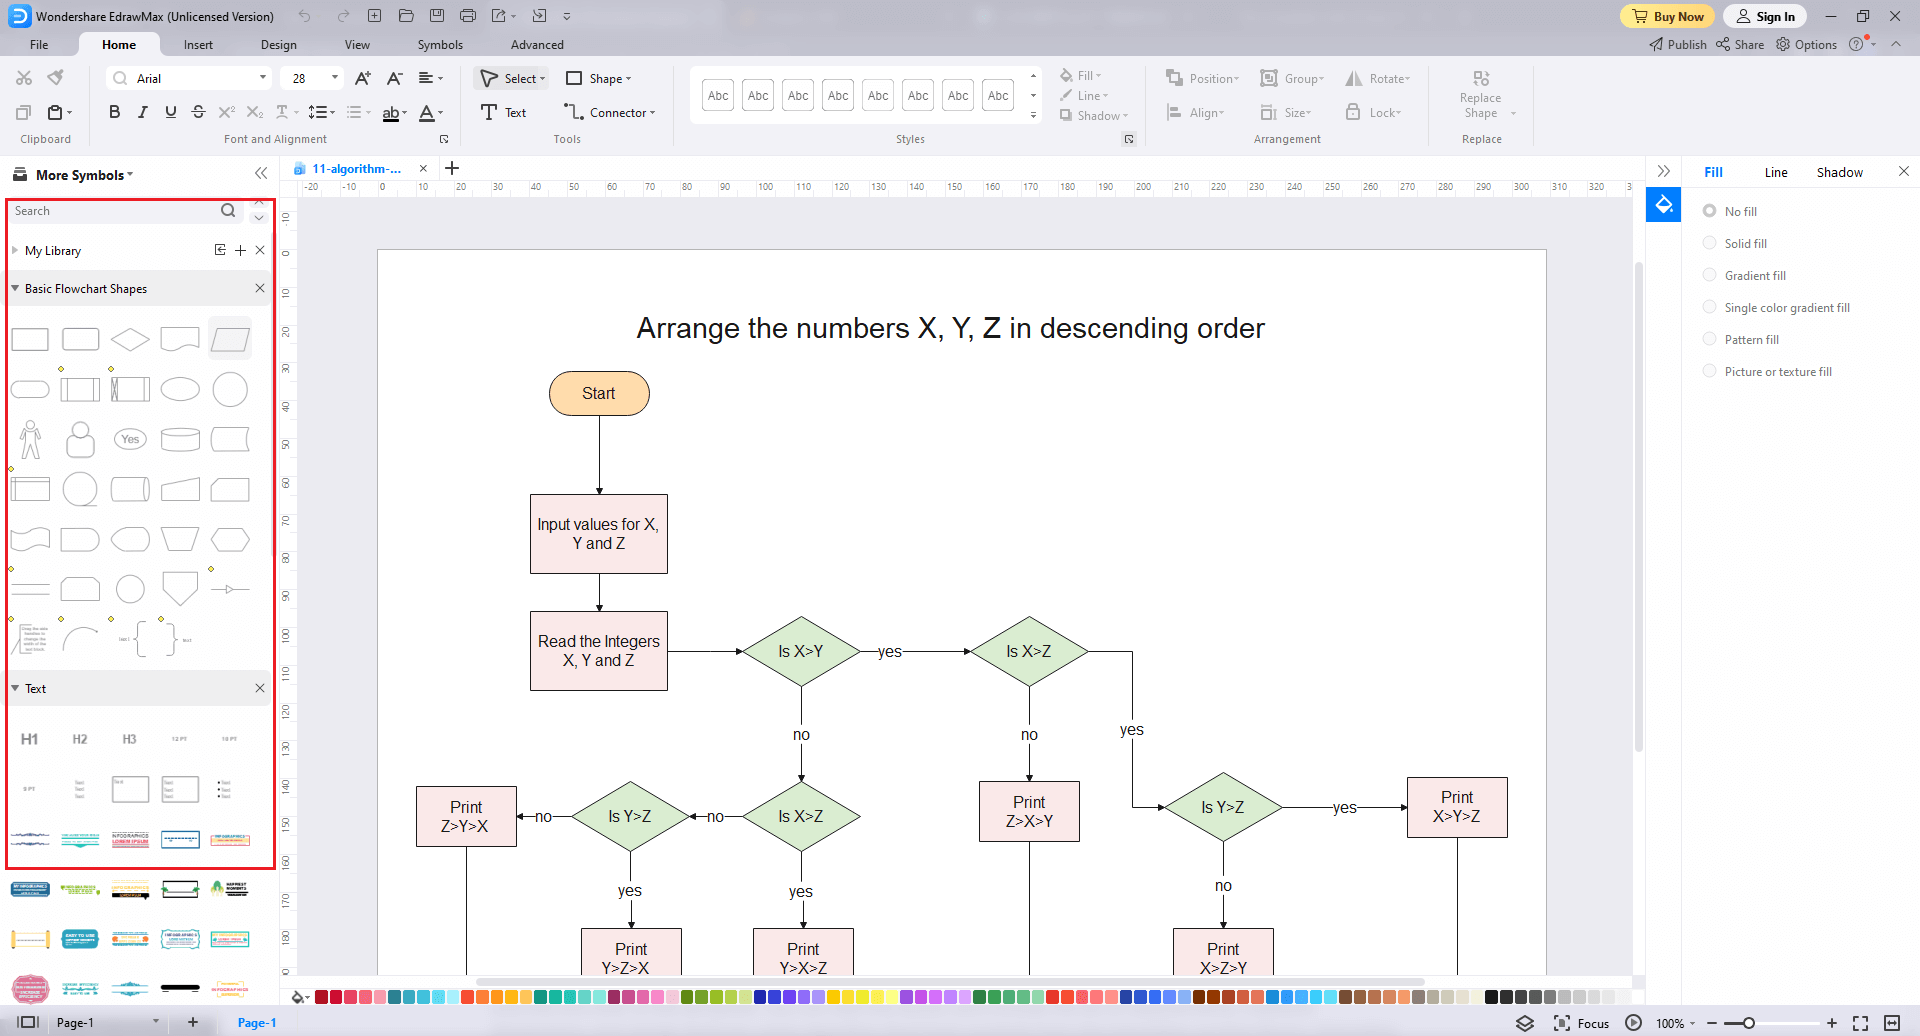
Step3 Open the Template
After downloading the template, you can double click to open it in EdrawMax diagramming software, or you can open EdrawMax beforehand and navigate to the template to open it. Every algorithm flowchart diagram is incomplete without symbols. Head to the 'Symbols' section and click on the 'algorithm flowchart ' and 'Algorithm Flowchart' to import important symbols.
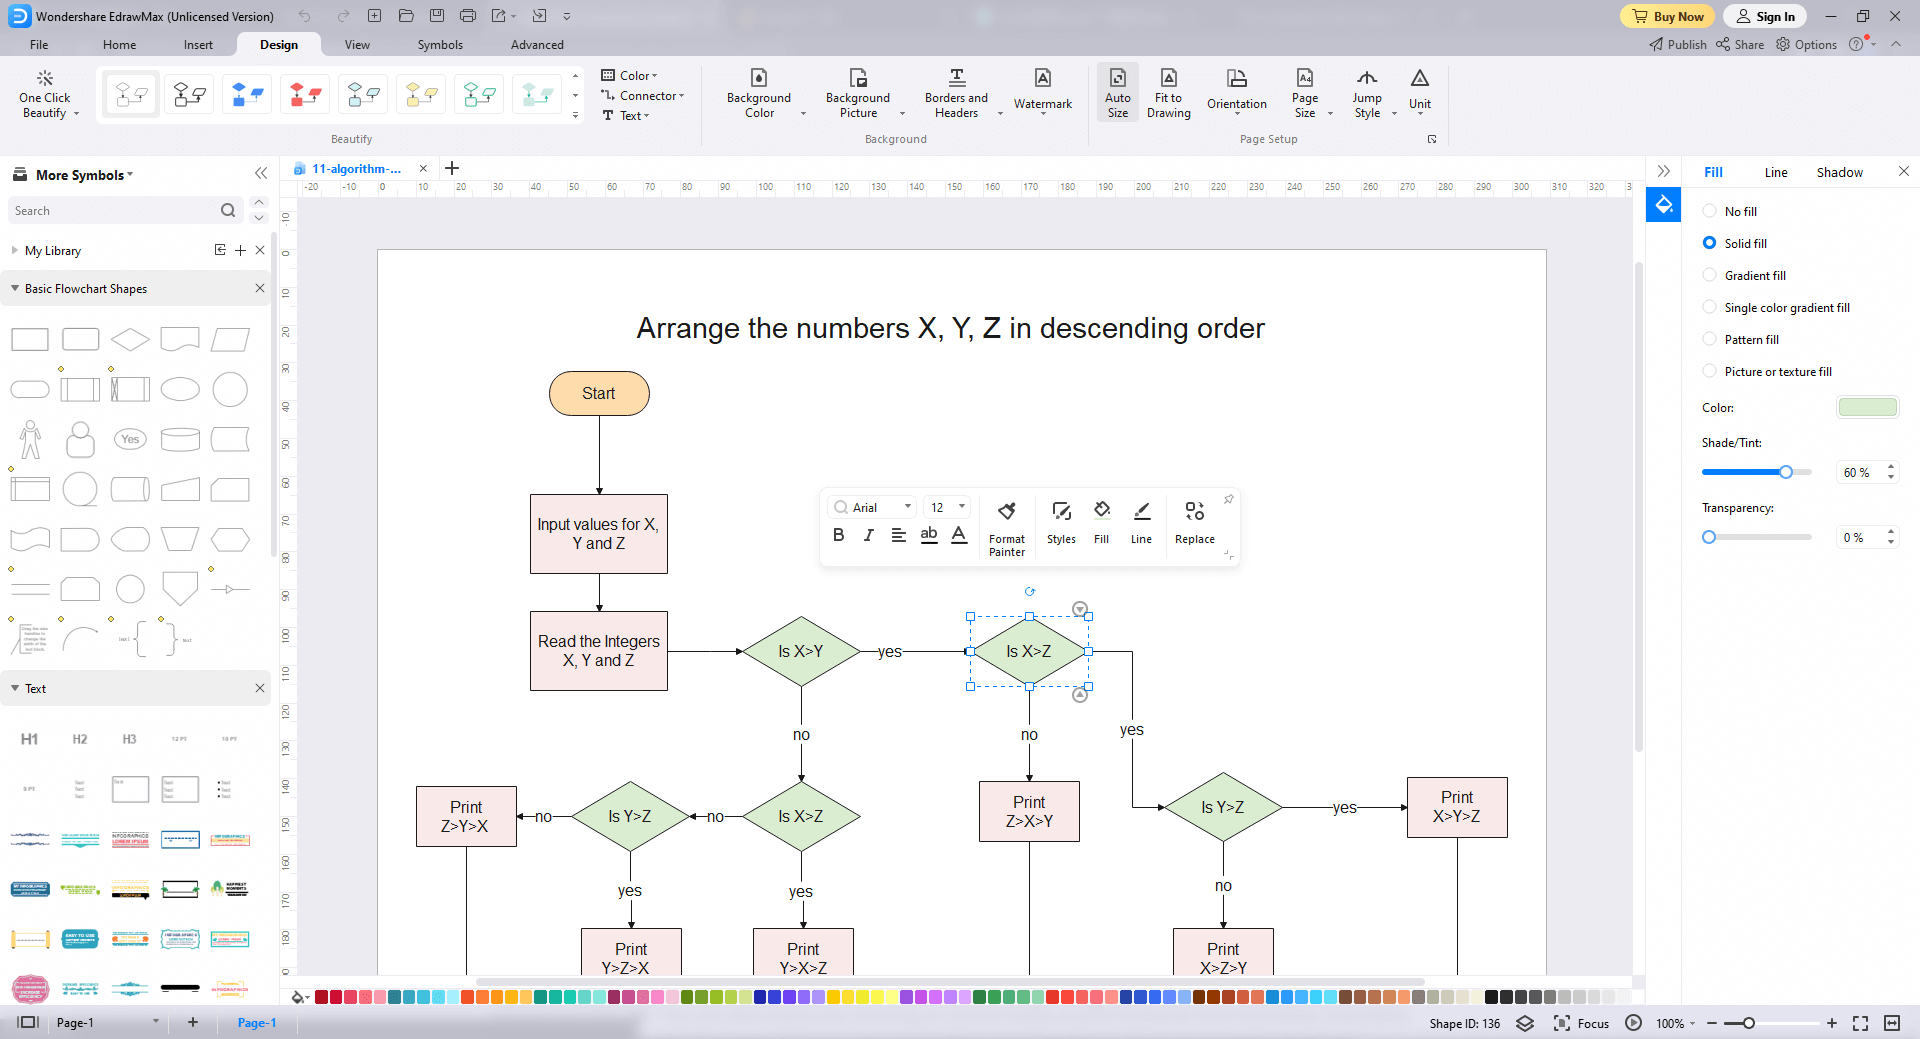
Step4 Customize the Algorithm Flowchart Template
After opening it, the next step is to customize and edit the algorithm flowchart template. EdrawMax gives you various unique diagramming tools that help you edit the template any way you want. You can change the color and the font liner of the template. You can edit the layout and include the list of requirements, measure dimensions, and render features using algorithm flowchart symbols from the EdrawMax symbol library. EdrawMax features a comprehensive library with 26000+ professional symbols that you can use for free with an easy drag and drop.
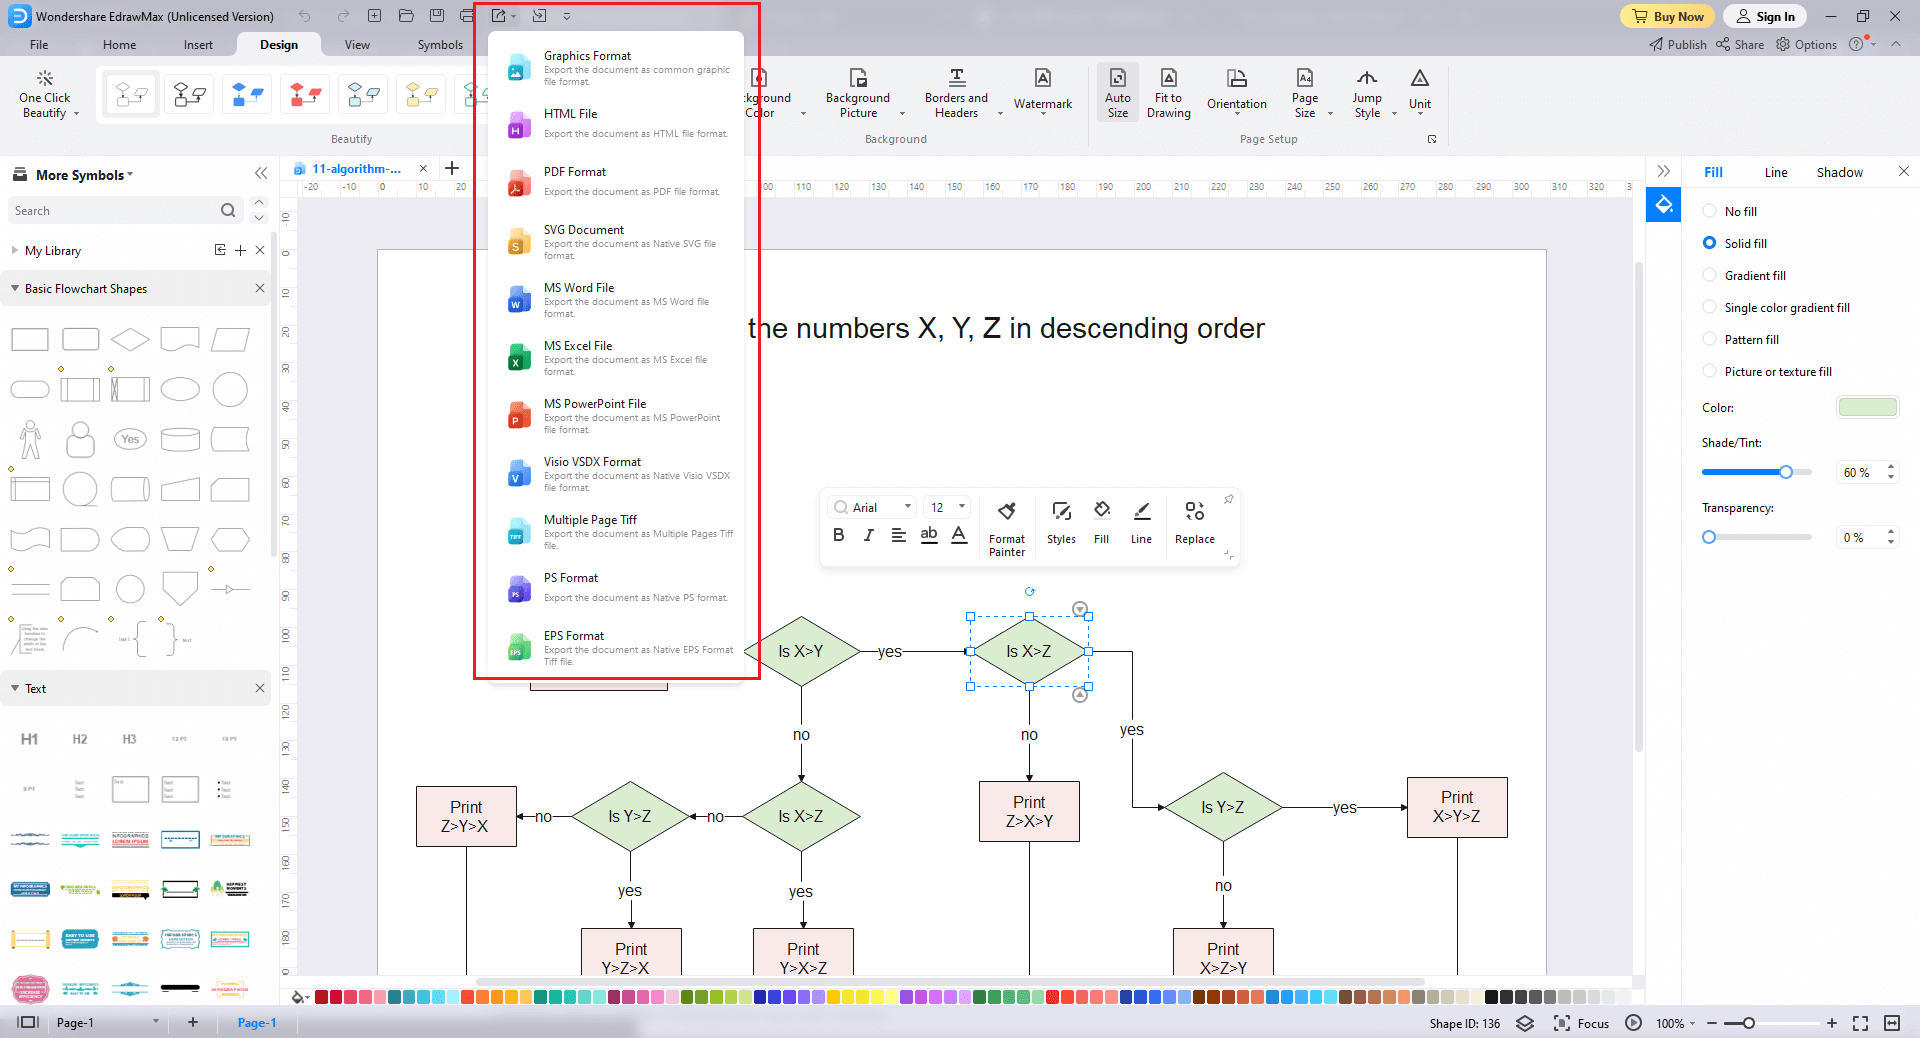
Step5 Save or Export
After you customize the algorithm flowchart template and complete your algorithm flowchart, the next step is to save or export your drawing. EdrawMax supports various document formats, which means you can export your drawing in any format you want, such as Microsoft Office, pdf, graphics, HTML, Visio, and many others. Export your drawing by going to the 'File' option in the top menu bar and clicking on 'export'. After that, select the document format and click 'ok'. You can also share your drawing on social media or print it directly from EdrawMax. EdrawMax also gives you a presentation mode that you can use to show your drawing to others or your team members.
4. Free Algorithm Flowchart Software
EdrawMax is the best free algorithm flowchart software that includes an extensive collection of free templates you can download and customize to fit your needs. How can it help yourself to develop a better strategy? For instance, EdrawMax can help you improve your competitive edge by making a algorithm flowchart. You can draw with shapes, arrows, and lines. Just insert the elements of your diagrams and connect them. There is no limit on creating the number of diagrams you can create.
- EdrawMax offers easily editable templates with various options for displaying relationships and emotions.
- Professionals prefer EdrawMax because of its simple user interface and excellent team collaboration features.
- You can easily share the algorithm flowchart with others using the built-in option.
- Its user-friendly dashboard and simple drag-and-drop feature make it the best free algorithm flowchart software for both beginners and professionals.
- It can export and import files into various formats, including MS Office, Graphics, PDF, HTML, Visio, and others.
- All of your algorithm flowcharts are encrypted for maximum security. Hence, you do not have to be concerned about losing your data.
5. Final Thoughts
Flowcharts are a significant way of understanding different processes and their requirements. The graphical representation will aid you in linking different elements and decisions.
EdrawMax is an impressive software for quickly drawing professional flowcharts and diagrams. The wide array of tools and symbols make everything a breeze. You can easily craft the simplest to the most complex diagrams in no time at all. Give Edraw Max a shot and create professional-grade drawings effortlessly.

Flowchart Complete Guide
Check this complete guide to know everything about flowchart, like flowchart types, flowchart symbols, and how to make a flowchart.
You May Also Like
Company Flowcharts Examples
Examples
B2B Sales Process Flowchart Examples
Examples
Venn Diagram Examples & Templates
Examples


