ORM Diagram
Draw Object Role Modeling Diagrams (ORM Diagrams) easily with Edraw!
Free Download ORM Diagram Software and View All Examples
An ORM diagram is used to show the mapping between the ORM Persistable class and its corresponding entity. In some cases, you may find it difficult to identify the mappings not only between the ORM Persistable classes and the corresponding entities, but also between the attributes and columns. By taking advantage of ORM diagram, the mappings between ORM Persistable classes and entities, and between attributes and columns can be clearly identified.
ORM Diagram Software
Edraw is a very easy-to-use and intuitive diagramming tool with database design and ORM Diagram design functions which can save you hundreds hours of work. It allows you to name the ORM Persistable class and its corresponding entity differently, and also the attributes and columns as well.
Free Download Our ORM Diagram Software and View All Templates
System Requirements
Works on Windows 7, 8, 10, XP, Vista and Citrix
Works on 32 and 64 bit Windows
Works on Mac OS X 10.2 or later
ORM Diagram Software Features
- Built-in symbols, full shape library and drag-and-drop interface: Make it super easy to create clear, visually pleasing ORM diagrams.
- Expandable canvas: Allows users to fit the entire org chart onto a single page.
- Auto alignment and distribution tools: Make it very simple to align shapes of texts either in columns or rows with the .
- Pre-drawn editable templates: Get started as quick as lightning especially for those time-crunched designers.
- Preset themes: Quickly add a designer-quality look and polish to your Martin ER Diagrams at 1 click.
- Broad file format compatibility: Create visual, ongoing, and collaborative Martin ER Diagrams.
- All-purpose diagramming function: Made 200+ kinds of visual diagrams (infographics) which can be included in your worksheet, e-mail message, presentation or document.
Symbols for ORM Diagrams

Examples of ORM Diagram
An ORM diagram depicts objects (entity types), the relationships (fact types) between them, the roles that the objects play in those relationships, constraints within the problem domain, and optionally examples (called fact type tables).
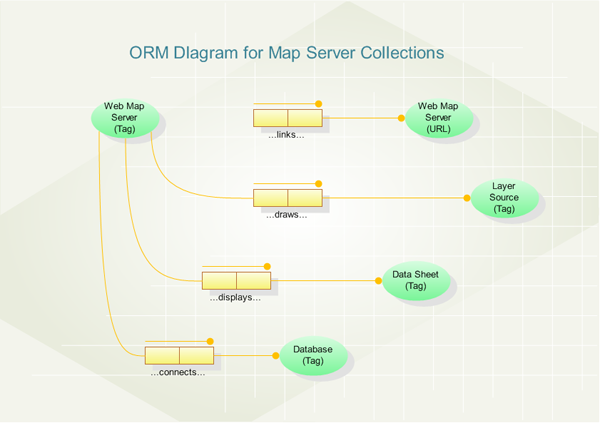
The diagram shows an Object Role Model (ORM) of the metadata collections for a map server. Each map server starts with a root object, identified by a unique tag. This root object reads the metadata to fill its collections. The metadata supplies the elements for each of these collections. For instance, a web map server with a given tag has a collection of URLs for the other web map servers that a user can link to from this map server.
Each web map server with a given tag also has a collection of layer sources, each identified by a unique tag. These map layers are drawn on the MapObjects map control, and some layers also allow spatial queries. A data sheet represents the HTML template for the results of a spatial query; each map server will have several of these data sheets, at least one for each layer with an available spatial query. Most spatial queries involve both map layers and database attributes associated with layer features. Each database connection for a map server is supported by an ADO Connection. The metadata for each database connection has enough information for the map server to create this ADO Connection in its own collection.
All of these collections are implemented with the Visual Basic collection data type. Each member of each collection is uniquely identified by an object tag.


