Relationship Diagram
Free Download Relationship Diagram Software and View All Examples
Equation Diagram

It is the ideal diagram for showing sequential steps or tasks that depict a plan or result. The last Level 1 line of text appears after the equals sign (=). Works best with Level 1 text only.
Arrow Ribbon
Used to show either related or contrasting concepts with some connection, such as opposing forces. The first two lines of Level 1 text are used for text in the arrows. Unused text does not show, but remains available if you switch layouts.
Balance Diagram
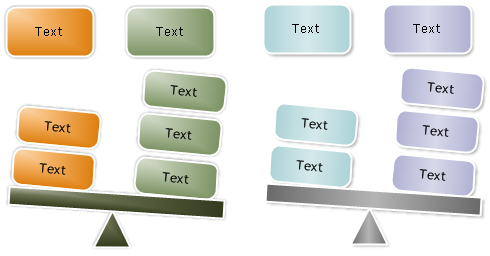
Used to compare or show the relationship between two ideas. Each of the first two lines of Level 1 text corresponds to text at the top of one side of the center point. It emphasizes Level 2 text, which is limited to four shapes on each side of the center point. The balance tips towards the side with the most shapes containing Level 2 text. Unused text does not appear, but remains available if you switch layouts.
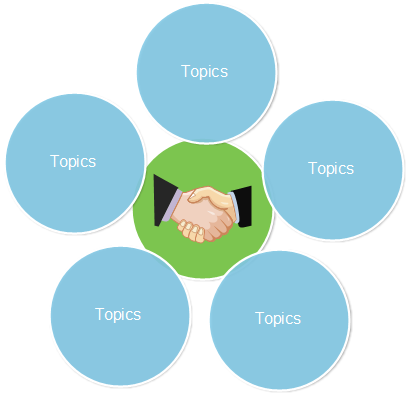
Basic Radial Diagram
For the show of the relationship to a central idea in a cycle. The first line of Level 1 text corresponds to the central shape, and its Level 2 text corresponds to the surrounding circular shapes. Unused text does not appear, but remains available if you switch layouts.
Basic Target Diagram
For showing containment, gradations, or hierarchical relationships. The first five lines of Level 1 text are associated with a circle. Unused text is invisible, but remains available if you switch layouts.
Basic Pie Diagram
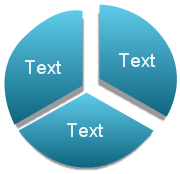
It is used to show how individual parts form a whole. The first seven lines of Level 1 text correspond to the evenly distributed wedge or pie shapes. The top Level 1 text shape appears outside of the rest of the pie for emphasis. Unused text does not appear, but remains available if you switch layouts.
Basic Venn Diagram
It is designed to show overlapping or interconnected relationships. The first seven lines of Level 1 text correspond with a circle. If there are four or fewer lines of Level 1 text, the text is inside the circles. If there are more than four lines of Level 1 text, the text is outside of the circles. Unused text does not appear, but remains available if you switch layouts.
Counterbalance Arrows
Used to show two opposing ideas or concepts. Each of the first two lines of Level 1 text corresponds to an arrow and works well with Level 2 text. Unused text is invisible, but remains available if you switch layouts.
Cycle Matrix
For the presentation of the relationship to a central idea in a cyclical progression. Each of the first four lines of Level 1 text corresponds to a wedge or pie shape, and Level 2 text appears in a rectangular shape to the side of the wedge or pie shape. Unused text does not show, but remains available if you switch layouts.
Diverging Arrows
Used to show ideas or concepts that progress outward from a central source. Works best with Level 1 text only.
Diverging Radial
People use it to show relationships to a central idea in a cycle. The first Level 1 line of text corresponds to the central circular shape. It emphasizes the surrounding circles rather than the central idea. Unused text does not appear, but remains available if you switch layouts.
Funnel Diagram
People use this kind of diagram to show the filtering of information or how parts merge into a whole. It emphasizes the final outcome. Funnel diagram can contain up to four lines of Level 1 text; the last of these four Level 1 text lines appears below the funnel and the other lines correspond to a circular shape. Unused text does not appear, but remains available if you switch layouts.
Gear Diagram
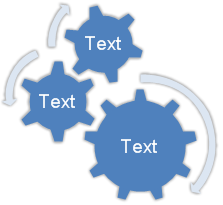
It is designed for showing interlocking ideas. Each of the first three lines of Level 1 text corresponds to a gear shape, and their corresponding Level 2 text appears in rectangles next to the gear shape. Unused text does not appear, but remains available if you switch layouts.
Nested Target Diagram
It can show containment relationships. Each of the first three lines of Level 1 text correspond to the upper left text in the shapes, and Level 2 text corresponds to the smaller shapes. Works best with minimal Level 2 lines of text. Unused text does not appear, but remains available if you switch layouts.
Non-directional Cycle
It is quite suitable for representing a continuing sequence of stages, tasks, or events in a circular flow. Each shape has the same level of importance. Works well when direction does not need to be indicated.
Radial Cycle
Used to show the relationship to a central idea. Emphasizes both information in the center circle and how information in the outer ring of circles contributes to the central idea. The first Level 1 line of text corresponds to the central circle, and its Level 2 text corresponds to the outer ring of circles. Unused text does not appear, but remains available if you switch layouts.
Radial Venn Diagram
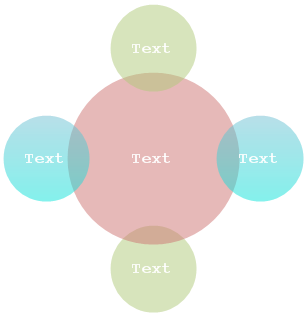
Suitable for showing both overlapping relationships and the relationship to a central idea in a cycle. The first line of Level 1 text corresponds to the central shape and the lines of Level 2 text correspond to the surrounding circular shapes. Unused text is hidden, but remains available if you switch layouts.
Segmented Pyramid
It is the optimal choice to show containment, proportional, or interconnected relationships. The first nine lines of Level 1 text appear in the triangular shapes. Unused text does not appear, but remains available if you switch layouts. Works best with Level 1 text only.
Table Hierarchy Diagram
For showing groups of information built from top to bottom, and the hierarchies within each group. This layout does not contain connecting lines.
Vertical Equation
People use it to display sequential steps or tasks that depict a plan or result. The last Level 1 line of text appears after the arrow. Works best with Level 1 text only.


