PERT Examples
PERT Chart Example
Seeking a solution for maximizing the efficiencies throughout the PERT Chart? How to make a PERT diagram? How indeed does one go about it, without seeing examples of PERT Chart? Not likely unless one has good PERT Chart examples.
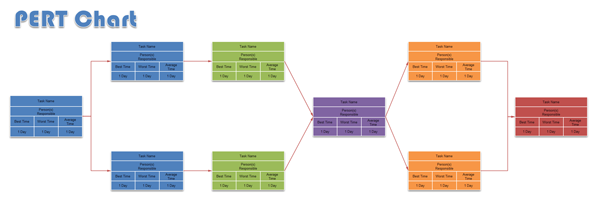
Edraw includes some examples to help you understand how to draw PERT Chart quickly. The following example shows a simple to draw PERT Chart.
Free Download PERT Chart Software and View All Examples
A PERT Chart can be created easily with Edraw software. There are two types of PERT Charts - activity on arrow and activity on node. Activity on node diagrams are generally easier to create and interpret. To create an AON diagram, it is recommended to start with a node named start. This "activity" has a duration of zero (0). Then you draw each activity that does not have a predecessor activity and connect them with an arrow from start to each node.
By itself, the PERT Chart pictured above does not give much more information than a Gantt chart; however, it can be expanded to display more information. The most common information shown is:
The Activity Name / Task Name
The Normal Duration Time
The Early Start Time (ES)
The Early Finish Time (EF)
The Late start Time (LS)
The Late Finish Time (LF)
The Slack
In order to determine this information, it is assumed that the activities and normal duration times are given. The first step is to determine the ES and EF. The ES is defined as the maximum EF of all predecessor activities, unless the activity in question is the first activity, for which the ES is zero (0). The EF is the ES plus the task duration (EF = ES + duration).
PEST Analysis
The following image is showing a PEST Analysis diagram created by our mind map freeware.
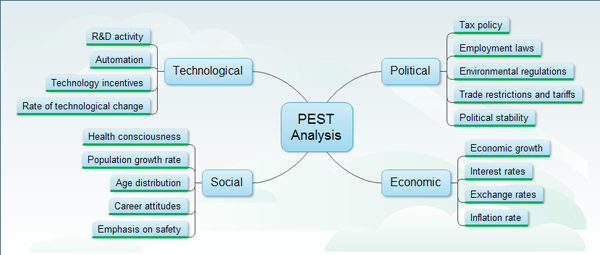
PEST Analysis Template can assess the environment which your business operate within, and identify where there may be threats or opportunities.
More Examples
Edraw includes plenty of libraries. You can download the full version to get free 30 day trial.


