Venn Diagram
Nowadays, there are lots of similar products or entities in the market intended for similar purposes, thus making the choosing process a bit complicated. Therefore, to determine which to choose from all of them easily, you may need to make some comparisons and define their relationships. For example, if you are planning to buy a phone and have three favorites brands to choose from, you can simply use the Venn diagram to draw all the possible logical relationships between them.
Therefore, a Venn diagram is the best graphical representation tool that will help you represent all elements and draw logical relationships from your comparisons and choose the right product for you.
So, let’s get into it!
Part 1: What is Venn Diagram
A Venn diagram, “also called logic diagram or set diagram is graphical representation diagram commonly used as a comparison tool for comparing two or more entities.” This illustration diagram can also be denoted as a graphical representation of the elements in a set or a group.
Part 2: Purpose and Benefit of Venn Diagram
• Data sets comparisons: It helps forecast/predict the prospects or chances of certain incidences happening as well as finding a correlation between those incidences.
• For visual communication: A Venn diagram can be used to analyze the relationships between a set of items such as differences and similarities by visually organizing data. This is essential when you need to depict the relationships by thinking through logical concepts. For example, a word search involving “or” and “and” statement for Boolean logic statement or equations.
• For solving complex mathematical problems.
• For comparing two or more choices: This diagram helps determine what distinguishes two choices as well as what they have in common.
Part 3: Symbols of Venn Diagram
In a Venn diagram, there are only three basics symbols that you should understand. However, a complete Venn diagram is mainly made up of more than three symbols. In total, there are up to 30 set theory symbols, but the most essentials ones are three, which include:
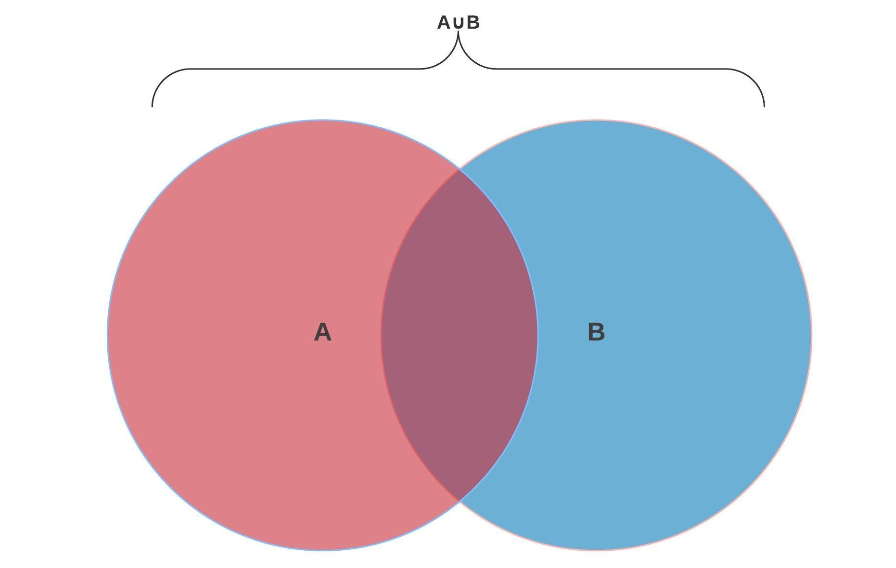
A union of two sets is represented by ∪. For example, if you have two circles, A and B, therefore, a complete Venn diagram made of those two represents A ∪ B (union of A and B). Be careful not to confuse ∪ with the letter “u” and keep in mind that ellipse or each circle represents a category.
So, how can this be practically appped? Let say you have two circles, A and B. A represents chess players while B represents Poker players. Therefore, A ∪ B will represent players that play Chess, Poker, or both.
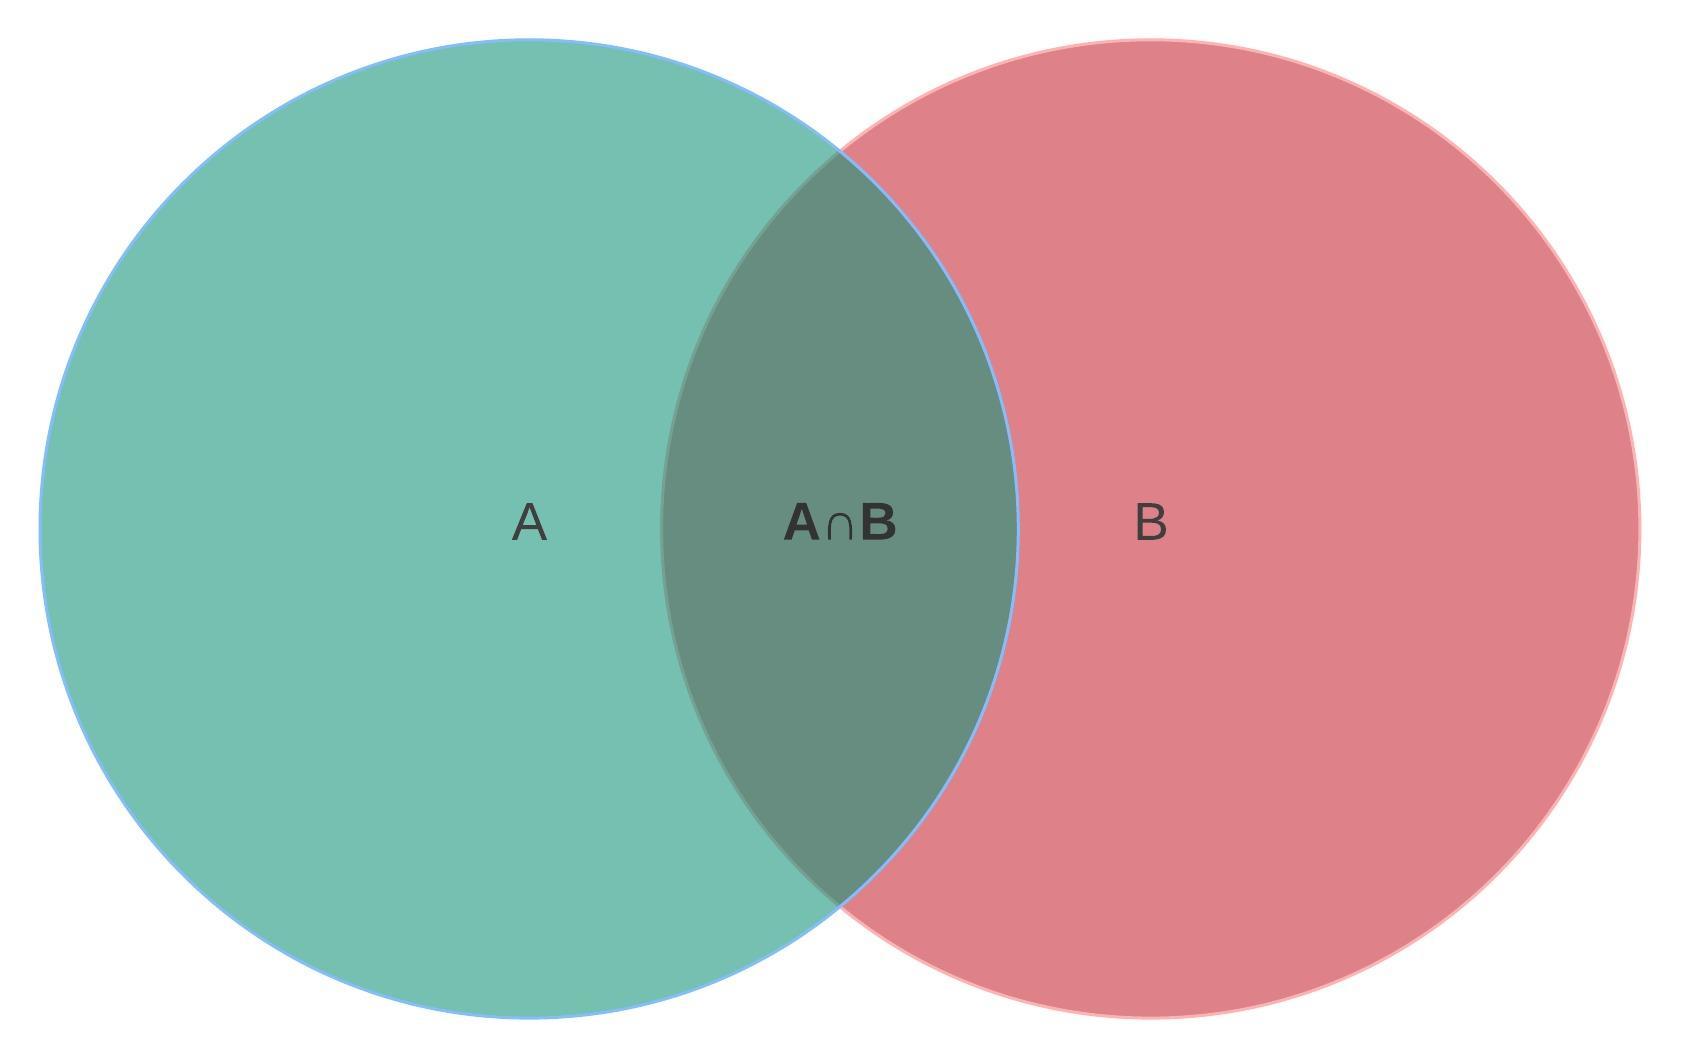
The items shred between two categories (Circles) are represented by intersection, denoted by A ∩ B (intersection of A and B). Taking the practical example above, the intersection of A and B represents players that play both Poker and Chess.
A complement of a set, or Ac, for set A, denotes what is not represented in a set. Everything not included in the set is therefore noted as the total complement of a set. Taking the letter “U” to represent universal, the absolute complement of A in U will be A^C=U\A
Using the same practical example, an absolute complement of A in U is represented in Circle B, meaning all the players that do not play Chess.
Part 4: What to do Before creating Venn Diagram
Before you head over to the designing phase of the Venn diagram, there are several things you should do or consider, such as:
• Define your Goal:
Start by asking yourself several questions, such as what do you want to achieve by designing a Venn diagram? Or for what purposes do you need comparison for? This is essential in creating a clear baseline and understanding of your project.
• List data Items:
Create a list of items contained in a set.
• Familiarize yourself with several templates
It is very important to run through several Venn diagram templates available in EdrawMax to have a clue of what you will like to make. After that, you can now follow the steps below to make your Venn diagram.
Part 5: How to Make Venn Diagrams in EdrawMax
Even though you can use other methods to make a Venn diagram, such as a pencil and a paper, EdrawMax online gives you an easy and modernized way. To create your diagram using EdrawMax, follow the steps below:
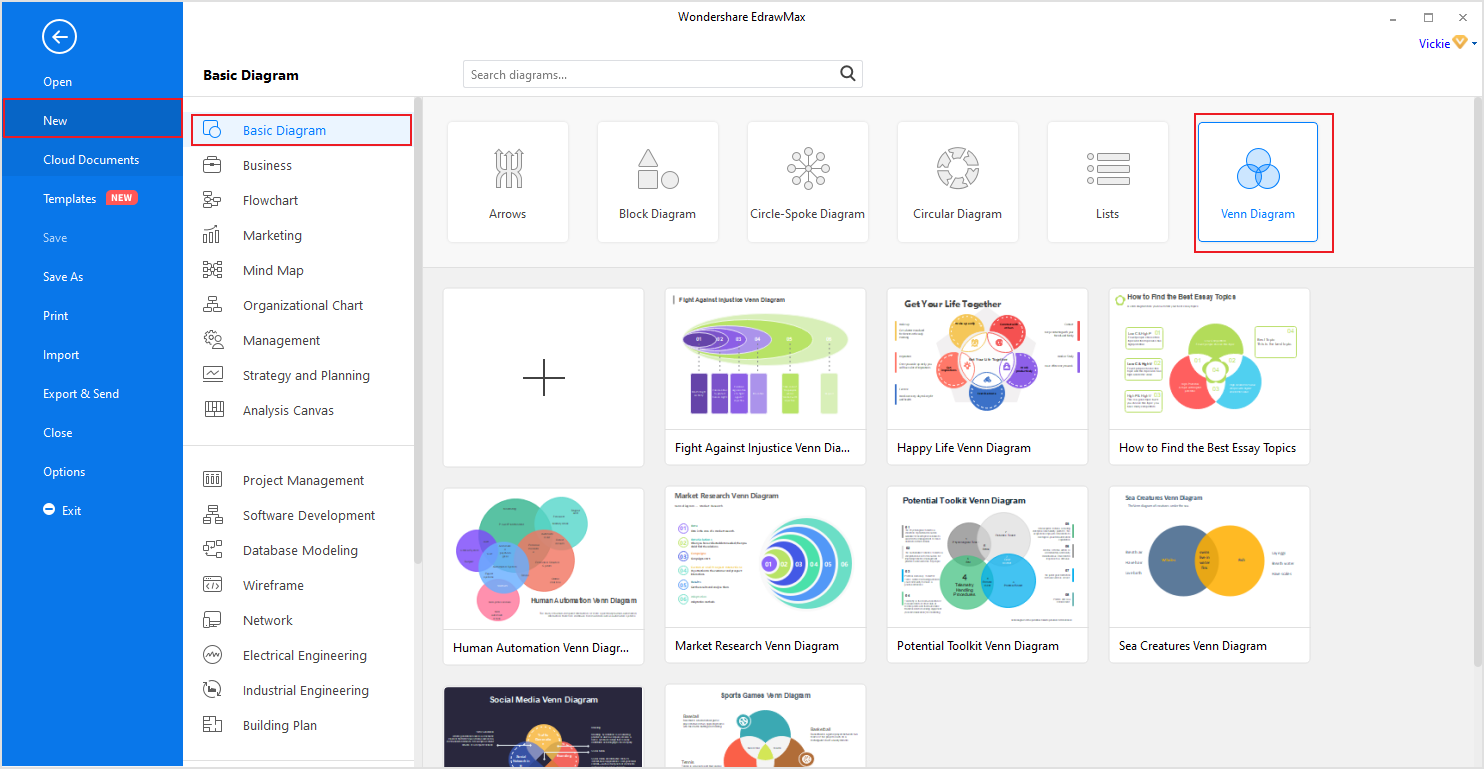
Step 1: Select Basic Diagram
Click [New] on the left side blue navigation pane and then [Basic Diagram] on the adjustment pane to open the Basic Diagram designing page. After it's done loading, click on [Venn Diagrams] located at the upper right section of this window.
Step 2: Make or Modify your diagram.
At this point, there are two option you can go with
1) Click [+] to create a new diagram from scratch or
2) Select any Venn diagram templates you prefer from the ones posted there and then modify them to meet your requirements.
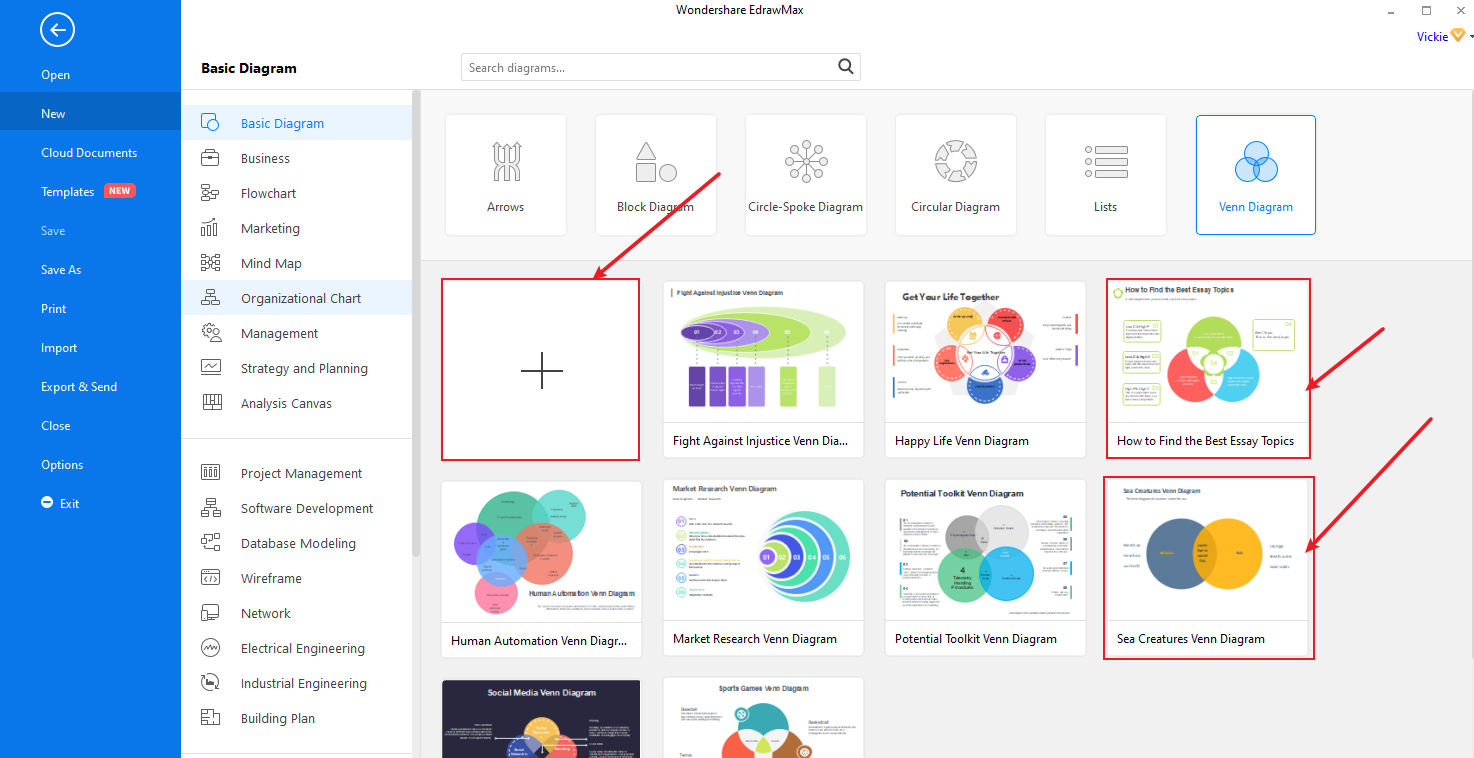
Irrespective of what you choose, you will or may end up needing to add extra symbols and characters to your diagram. And to do so, you can choose all relevant symbols from “Symbols library” or Venn chart library.
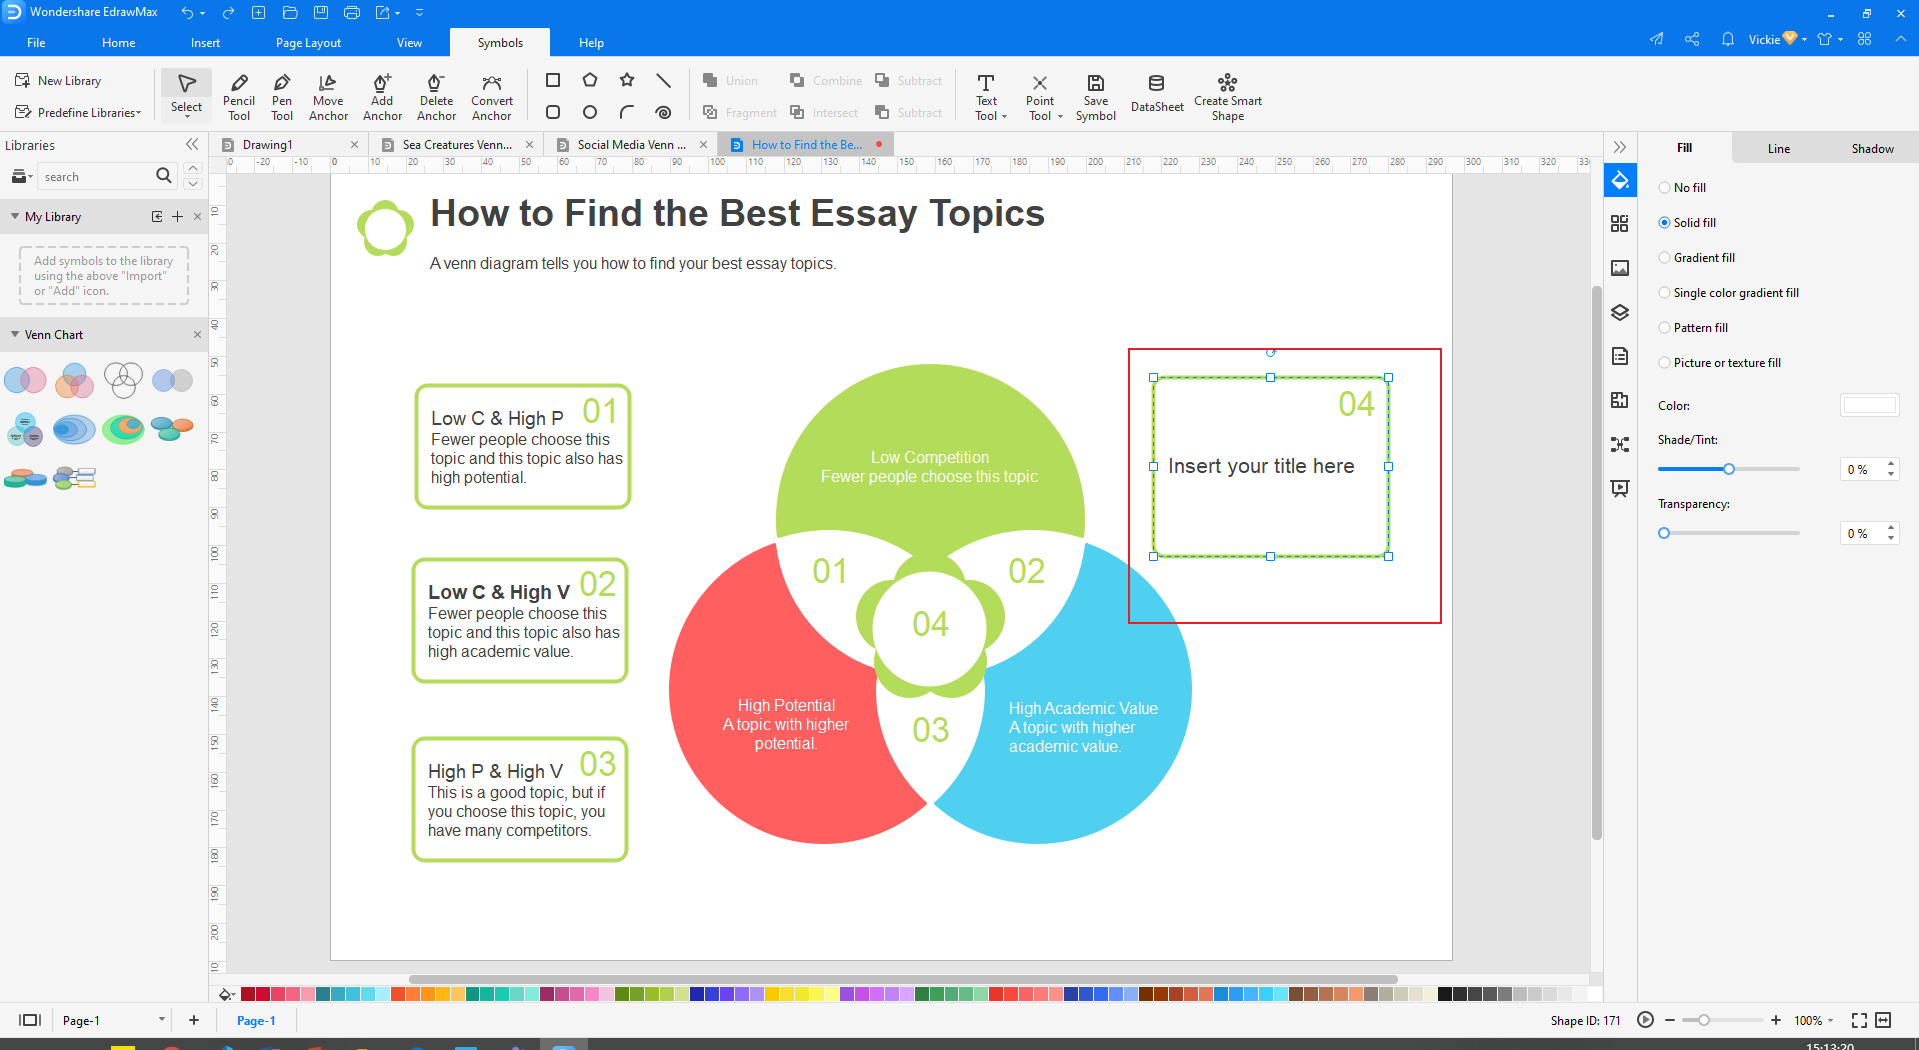
Step 3: Edit Venn Diagram and Text
Keep in mind that all elements in a Venn diagram can be edited, modified, or treated independently. This means you can remove one symbol and replace it with another, edit text only, etc. so here is how you edit your diagram:
• Right-click the diagram and click [Ungroup] from the pop text menu. (If they are grouped already, but if not, you don’t need to do this step)
• After ungrouping, you can now modify any element independently, like changing shape, position, or even adjusting its size.
• To edit text, double click on the text field [Example Text/ Insert Your Title], then type your preferred information there. Repeat this procedure to edit any other text you will like too.
• To change the color of the symbols, tap on that symbol, for example, a circle, and then choose your preferred color from the color tap below it.
• Selecting your them style: If you ill like to have your own them and style incorporated to make it unique and professional, click and choose from the available color and fonts.
• Once you’re done with medication, click Ctrl + A to select all symbols, then right-click on any part of the diagram and select [Group] from the pop-up menu. NOT necessary.
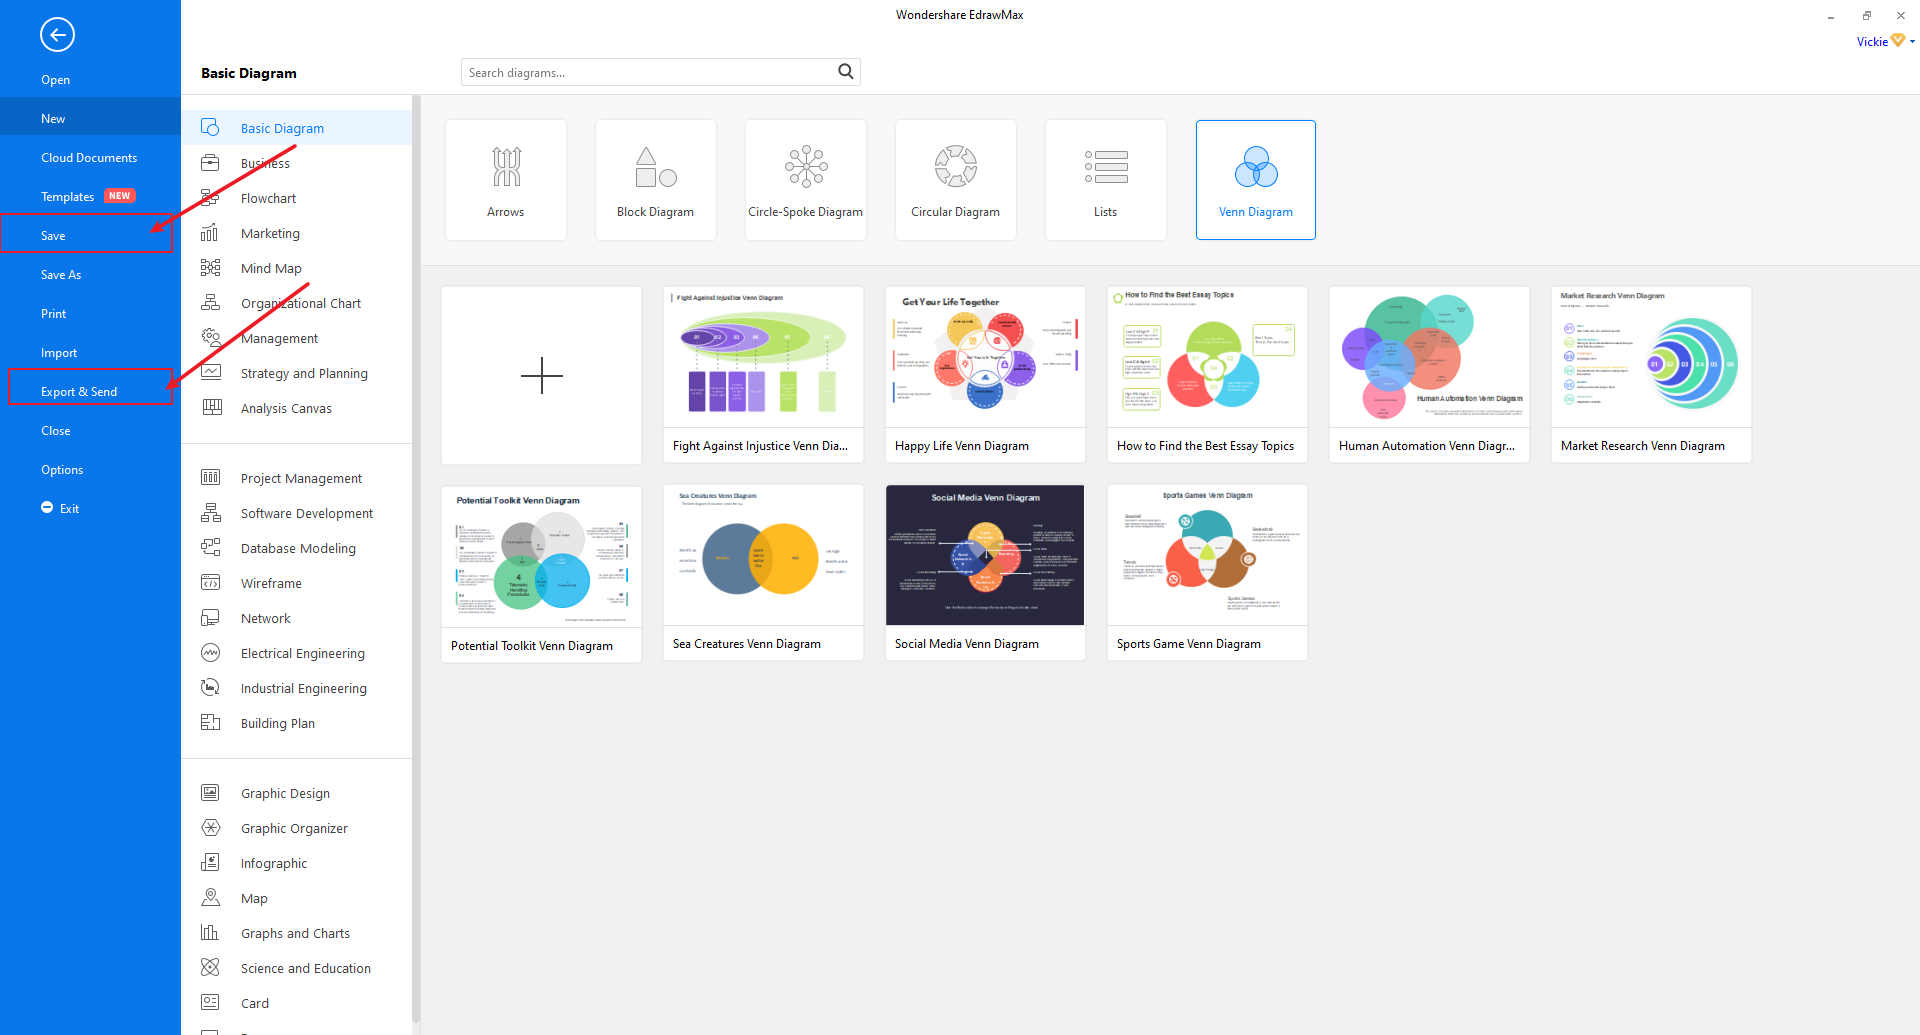
Step 4: Save, Export, and Share
After you’re done with all modifications, you can now save, Export, and share your Complete Venn diagram.
• To save it, click on the [File] at the top left corner and then select [Save or Save As] on the drop-down menu.
• To Export, it follows the same procedure but selects [Export] on the drop-down menu.
• To share it, click on the share icon at the top right side of your screen.

An all-in-one platform for 210+ diagrams.
・ Simple alternative to Visio
・ 26k+ symbols
・ 10K+ free templates
・ 10+ AI diagram generators


Part 6: Venn Diagram Example
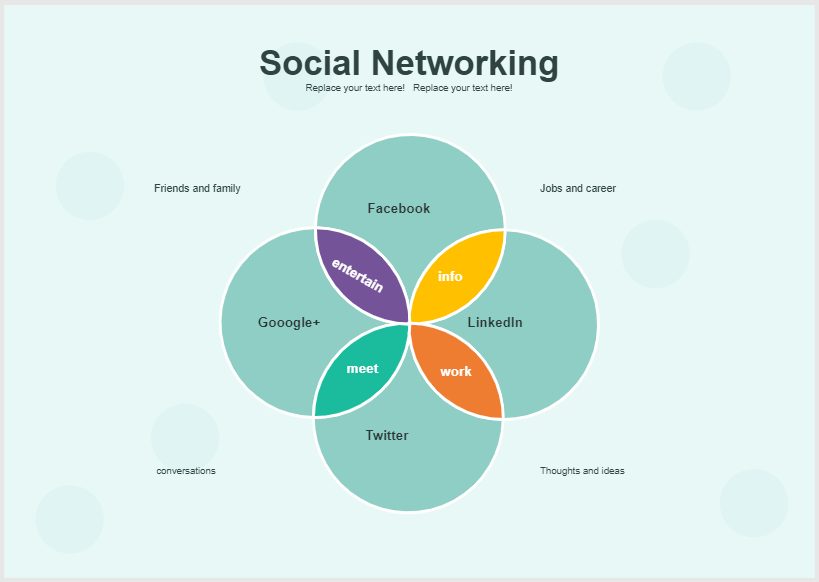
The social network example below shows how different social media platform influences social networking between different individuals. In this diagram, therefore, we can note the following key comparisons and relationship:
Info is the subsequent relationship between LinkedIn and Facebook, and it is ideal for jobs and career.
Twitter also allows conversation, as do Google+
The main relationship that Google+ and Facebook have is entertainment hence ideal to be used between friends and family.