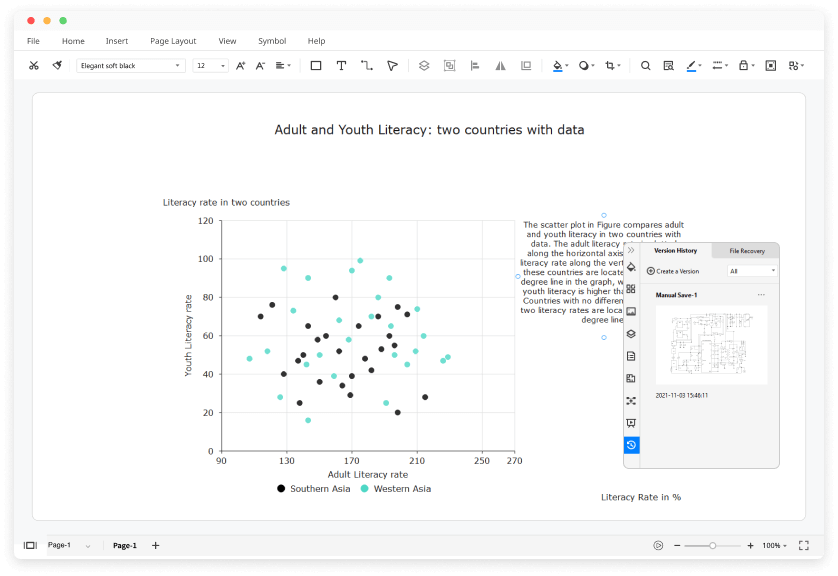
Scatter Plot Maker
Create professional scatter plots for free with easy-to-edit templates and spreadsheet editor.
Trusted By Over 25 Million Users & Leading Brands


Why EdrawMax to Make Your Scatter Plots?
Scatter plots for every need
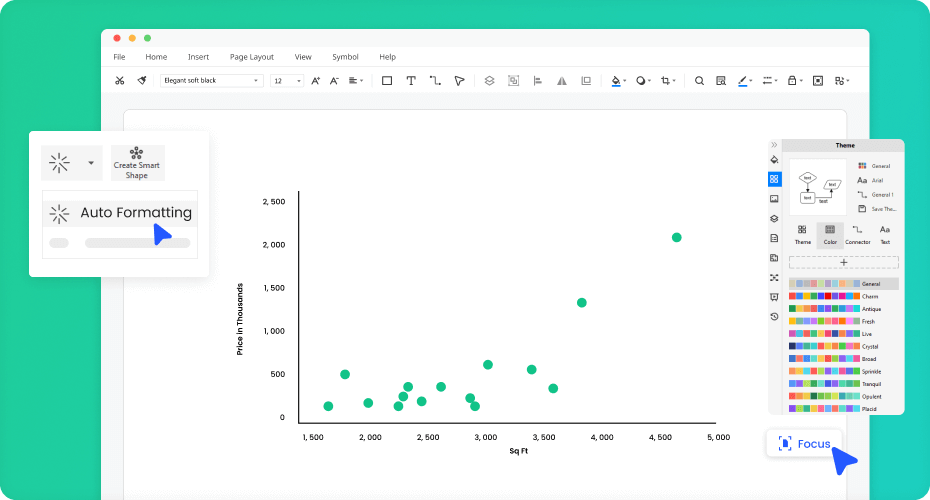
Creating scatter plots is a breeze
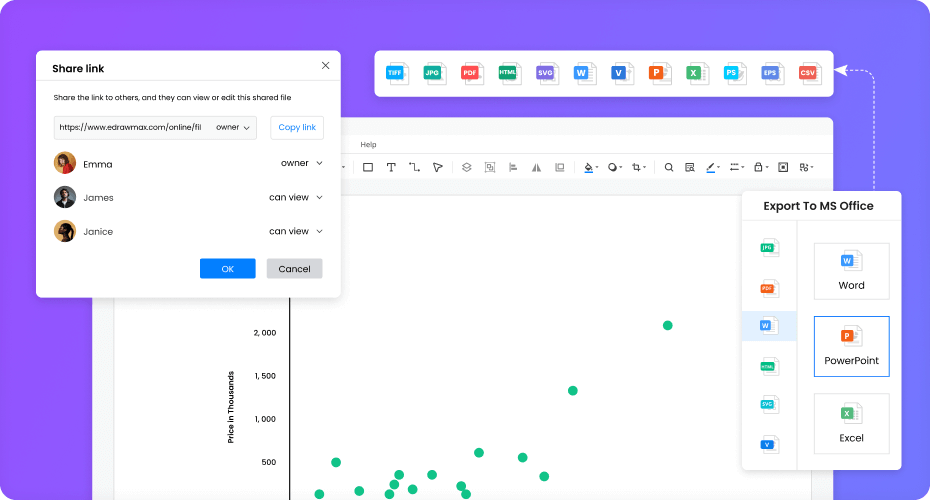
Store and share with much ease
Print, embed, and present without limit
More Features Of Scatter Plot Maker
Visio files import and export
Customized fonts and shapes
Insert images and attachments
Infinitive canvas
Various color theme
File encryption and file backup
How to Make a Scatter Plot?
Edraw Scatter Plot Templates
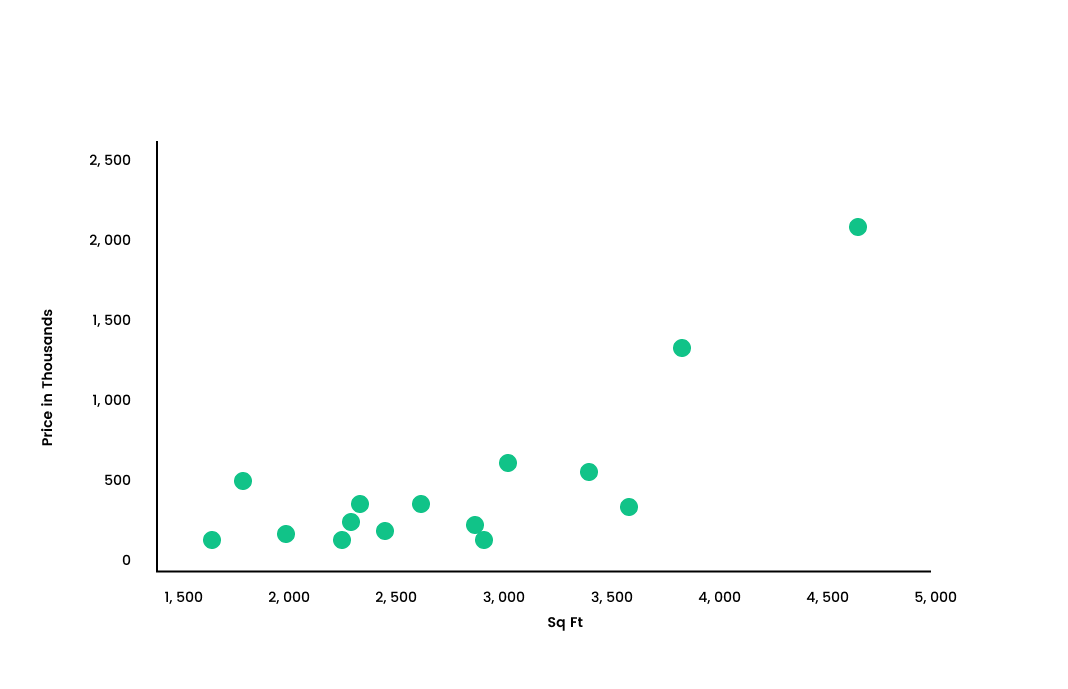
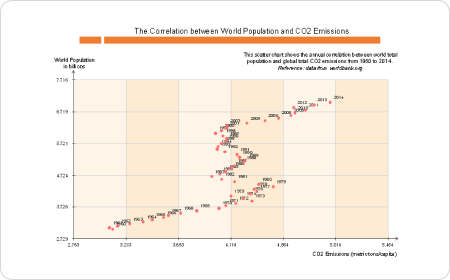
Scatter Diagram
Scatter diagram is a popular way of visualizing the relationship between two variables. It allows you to quickly and easily identify any trends or patterns in the data.
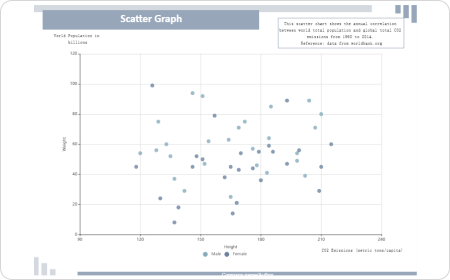
Scatter Graph
The scatter graph shows data points that represent the values of a variable. You can add a line between each point to make a trend line.
Scatter Chart
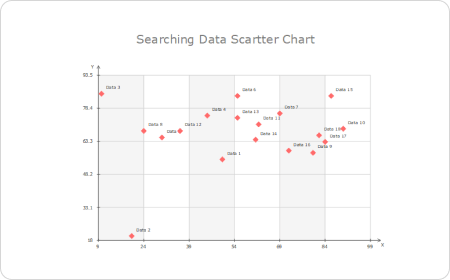
Students often find it difficult to make a good scatter plot. They often try to make a scatter plot by just using their imagination. EdrawMax scatter plot maker is here to help.
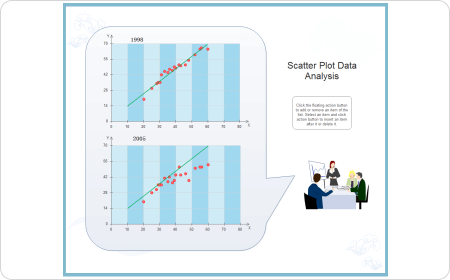
Scatter Plot Example
You can make your own scatter plot templates with the help of the EdrawMax scatter plot example.
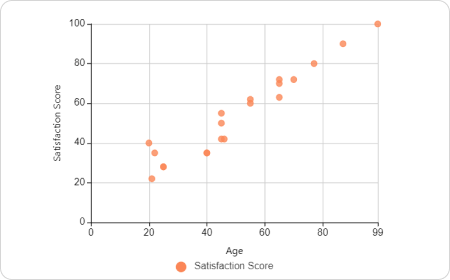
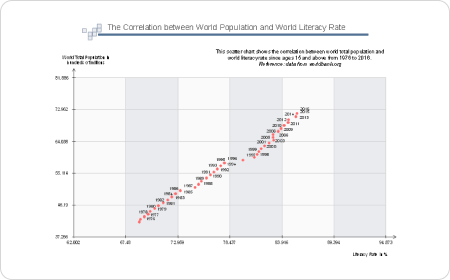
Scatter Plot Correlation
These scatter plots are based on a very simple correlation equation. The value of X is compared to the value of Y, and the value of X is plotted against the value of Y.
XY Chart
EdrawMax is a professional and free scatter plot creator that provides you with many professional chart templates. You can make an XY chart for your work and study.
Scatter Plot FAQs

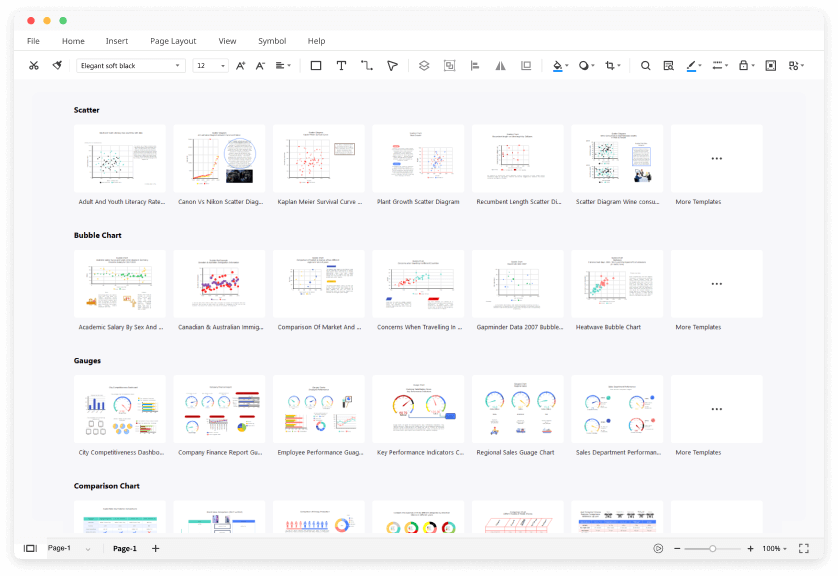
Does EdrawMax have any free scatter plot templates?
Except for the pre-made scatter plot templates in EdrawMax, you can download and customize templates from our Template Community. All the community-made templates are free to use for Edrawers.
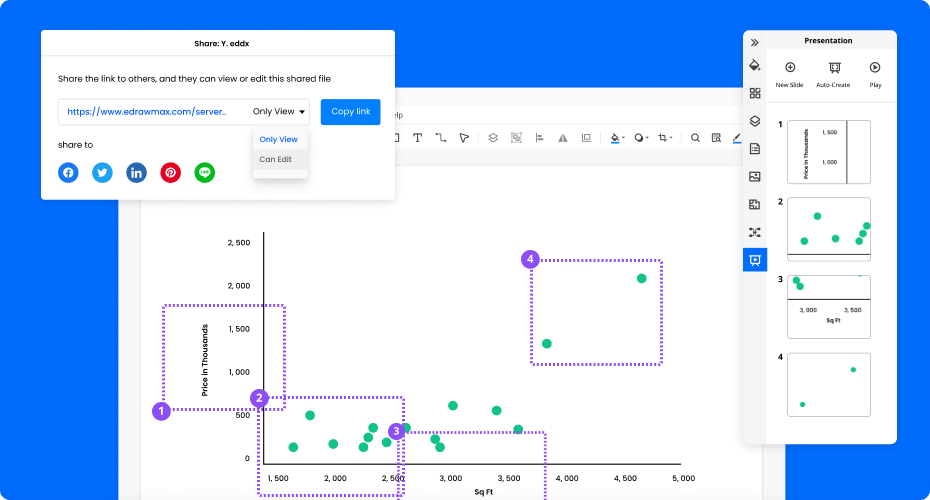
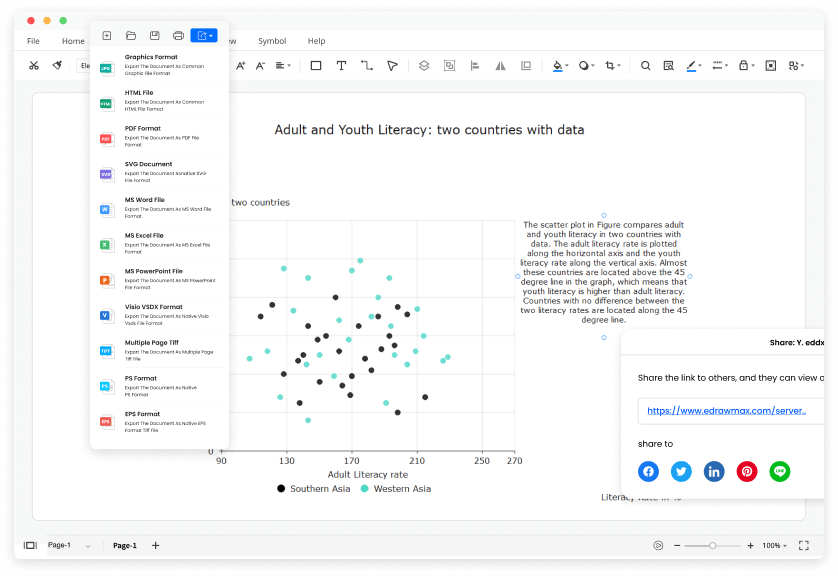
How can I share my scatter plots with others who don't use EdrawMax?
When your scatter plot is complete, you can post it on social media, publish on Edraw Template Community, or export the file as Word, Excel, PowerPoint, Visio, PDF, SVG, PNG and JPG. EdrawMax is dedicated to delivering a superior user experience.
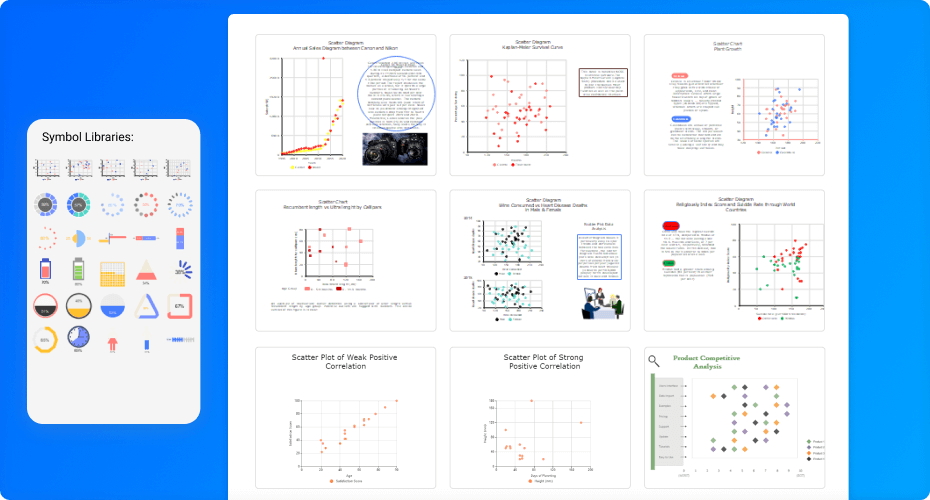
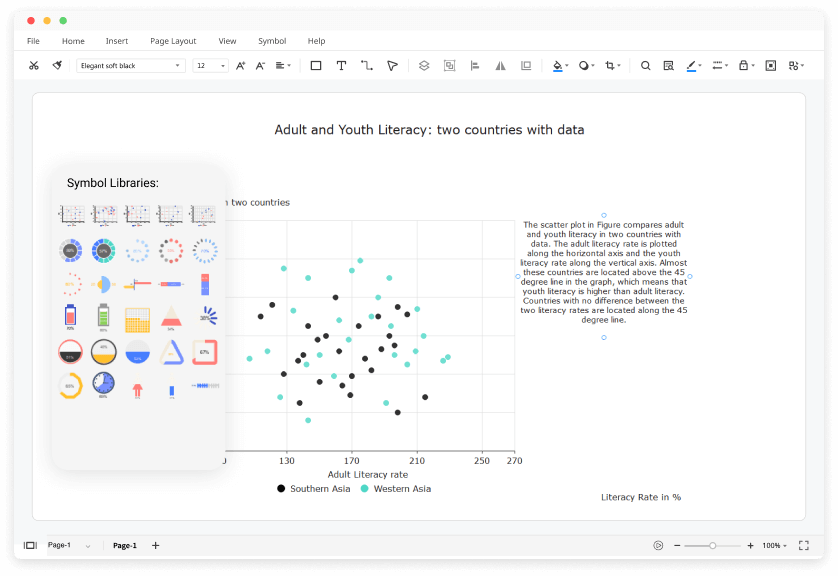
How can I find scatter plot symbols that I need?
No worries. You can find scatter plot symbols by opening and searching in the preset symbol libraries of EdrawMax.
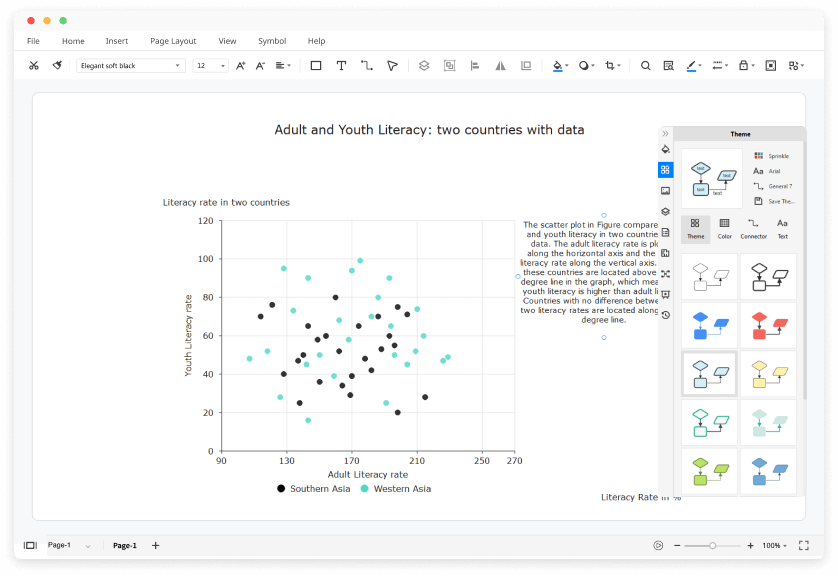
How can I create a scatter plot from scratch?
You can create a scatter plot from scratch by dragging and dropping symbols from the libraries and customizing colors, fonts, lines, etc. All the symbols in EdrawMax are vector, editable, and catered to different types of scatter plots.
Is EdrawMax's scatter plot maker free?
YES! It is free to create different scatter plots in EdrawMax. There are free templates, symbols, and easy-to-use editing tools for making scatter plots. Just download it and try EdrawMax now. You will love it right now.
More Resources
Unlock your diagram possibilities by exploring more diagram makers here.
Find more ideas, tips and knowledge to help create scatter plots.
Need help? Find the instruction or contact support here.
